BITCOIN BTC PRICE ANALYSIS AND NEXT EXPECTED MOVES!!CRYPTOCAP:BTC Update & Next Possible Trade Ideas!!
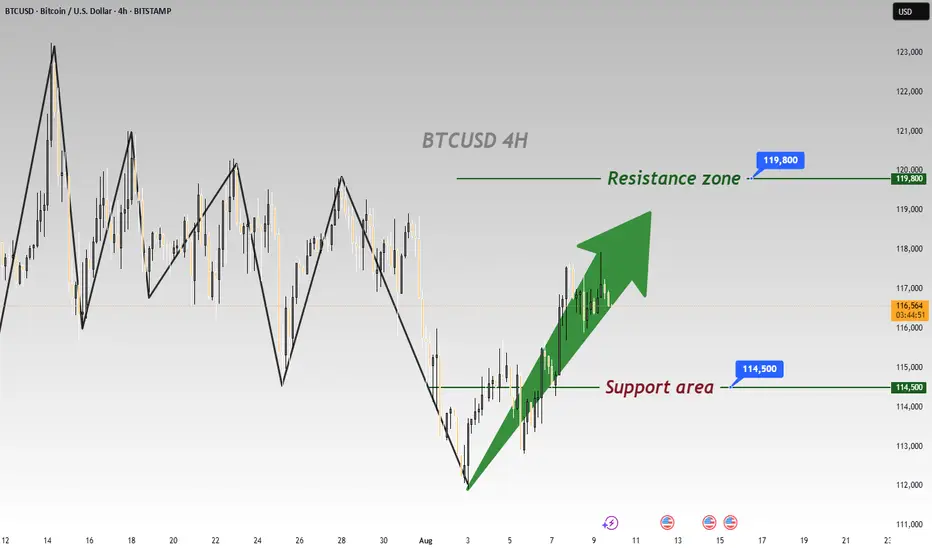
• Right Now For Short term i am expecting sideway movement in CRYPTOCAP:BTC Price. (Overall No Trade Zone Area)
REASON:
Volume is Low, LTF's Structure look Bullish & HTF's Structure is Bearish... I think we will stuck in a trap🚨
• But after consolidation if price manage to hold 114600$ then we will look for long setup OR It's Price Drop B/w 111500$ to 110000$ zone then we will also look for quick long scalp🫡
• Trade ideas that i marked on a chart are also for quick scalp.
• Let's see how Price react in comming days🫠
Warning : That's just my analysis DYOR Before Taking any action🚨🚨
Btcusdtanalysis

Shorting BTCUSDT – Strong HTF Bearish Signals in PlayRecent Price Action:
- First Rejection (8/14): Bitcoin was rejected at the previous ATH (~$102.3K).
- Second Rejection: Price failed to surpass the secondary swing high (~$122.4K), leading to a sharp drop (liquidation of buy orders).
- Rebound Attempt: Price dipped to $106.8K, filling the CME gap and likely triggering short-term short liquidations over the weekend. However, the rebound lacked sustainability.
- Breakdown Confirmation: On Monday’s market open, BTC broke below key support, extending the drop to the 0.786 Fib level (~$114.6K).
Market Structure Shift (Higher Timeframe Confirmation):
- The breakdown invalidated the prior bullish structure on H4+ timeframes, confirming a bearish bias.
- The inability to hold above key levels and the liquidation-driven moves suggest weakening demand.
Short Setup Opportunity:
- Ideal Entry Zone: 116.8K - 117K
- SL: ~118k
- TP: ~112k
- Confluence: 0.618 Fib retracement from recent swing high.
Rejection at this zone would further validate bearish continuation.

BTCUSD set to rise $124482?BTCUSD trade setup for today :
Before we look at potential entry in this pair first let’s look at multiple timeframe analysis in this market.
Monthly: 124482 Monthly resistance price has got rejection strongly from the top
Weekly: Price has just got just broken out of the support
Daily: Price on the daily significant support level
Entry timeframe 4H : Price has printed 4h has got rejected strongly from the daily support level.
Possible trade recommendation : Bullish trade with high probability set up

BTC/USD) Technical analysis Read The captionSMC Trading point update
Technical analysis of BTC/USD daily chart analysis you shared:
---
Analysis Idea – Bitcoin (BTC/USD)
1. Key Resistance Zone (Yellow Box):
BTC faced multiple rejections from the highlighted resistance area (shown by red arrows), indicating strong selling pressure.
2. Trendline Break:
A clear break below the ascending trendline confirms weakness in bullish momentum and suggests a shift toward bearish structure.
3. EMA 200 (Blue Line):
The 200-day EMA at 103,179 acts as a dynamic support. If price continues downward, it will likely test this area.
4. Target Zone:
Bearish continuation points toward the 100,720 – 100,419 support zone, marked as the target point on the chart.
5. RSI (42.74):
RSI is trending lower, supporting bearish momentum but not yet oversold — indicating more room for downside before a potential bounce.
Mr SMC Trading point
---
Idea Summary:
Bitcoin is showing signs of a bearish reversal after repeated resistance rejections and a trendline break. Price is likely to head lower toward the 100,700 region, with the 200 EMA providing possible short-term support.
Please support boost 🚀 this analysis)

BTC: Rebound Imminent, Go LongBTC today broke below 115000, then rebounded right away 📉→📈. The rebound will keep going and retest 120000—now’s a solid chance to go long! 🚀
⚡️⚡️⚡️ BTCUSD ⚡️⚡️⚡️
🚀 Buy@ 115000 - 115500
🚀 TP 117000 - 118000 - 119000
Daily updates bring you precise trading signals 📊 When you hit a snag in trading, these signals stand as your trustworthy compass 🧭 Don’t hesitate to take a look—sincerely hoping they’ll be a huge help to you 🌟 👇

BTCUSD falls on inflation fearsBTCUSD falls on inflation fears
Bitcoin dropped by 2% on August 18 to 115,500.00, hitting a low of 115,040. This is a 7.5% drop from its all-time high of $124,350.00 The drop came after hotter-than-expected US inflation data, with the July PPI at 3.3%. This reduced hopes for a Fed rate cut in September. The decision by US Treasury Secretary Scott Bessent to not add Bitcoin to strategic reserves also dented confidence. Support levels are at 115.000.00 and 112,500.00. A break below these levels could risk a drop to 110,000.00. The Fed's Jackson Hole Symposium and the August 21st jobless claims report will be the major drivers for this week.
High chances that the asset will rebound from 115,000.00 support level and support trendline towards 120,000.00 at least. The asset is still in a bullish trend. Additionally, there are still not so many institutional investors in the asset, which gives a potential for a long-term bullish market in the future.

BTCUSD:The meeting will likely impact further declines.Amidst uncertain news, BTCUSD is less favored than XAUUSD. After the Asian market opened, BTCUSD experienced a significant drop, exceeding 3000p. Assuming the meeting has not concluded, uncertainty will cause BTCUSD to fall further. Short-term short selling is likely to continue.

BTCUSDT HIT 350 PIPS OUR TRADE Hello Its ZGM
Congratulations 🥂 Who Following Our Trades BTC Hit +350 Pips Short Trade In Fair Value Gap Timeframe : H2
Just Locked In And Follow Our Trades Manage Your Capital See Our Latest Post Now

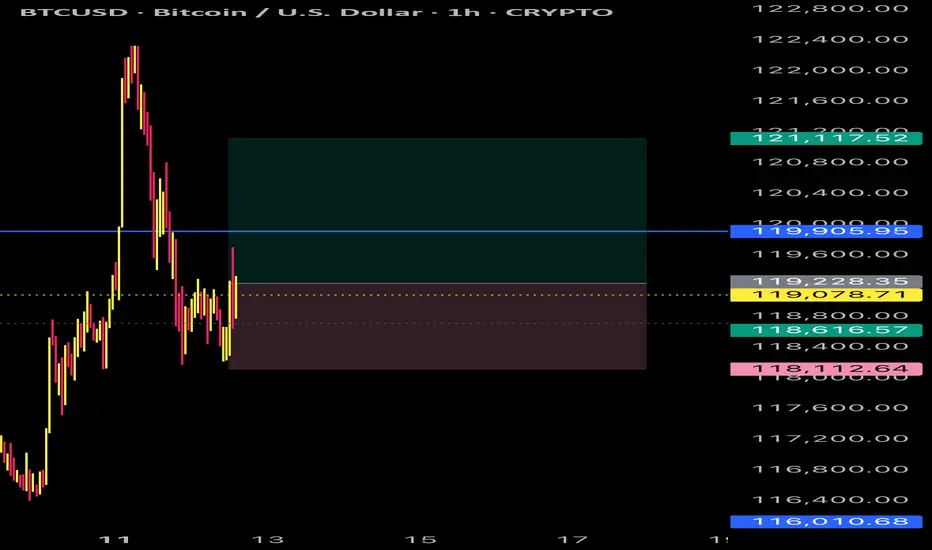
Bitcoin Setup: Long Entry Around $115-116K Area | 5:1 R/R Trade📊 If price drops into the white boxed area, I'm looking for a long entry.
But… there's a chance we sweep the lows near $115,555 first before moving up — so avoid blind limit buys. I'll wait for a reaction at the yellow line before entering.
🎯 I'm expecting price to hunt for liquidity around the white box area — essentially targeting stop losses from less experienced traders — before making its move higher.
This isn't necessarily based on strict technical logic, but rather from years of trading experience watching how these patterns typically unfold.
⚠️ **Setup is invalid if:**
• Move happens before this week's weekly candle closes
• Price breaks below the white box
• Price pumps without returning to the box
🚀 If we get this move early next week, I'm targeting at least the blue circled zone.
ATH is possible, but conservatively I'll take profits there.
📈 This trade setup offers a risk-to-reward ratio of 5:1. Without including fees, the breakeven win rate for this trade would be approximately 16.67%.
Knowing these figures in advance helps me avoid emotional trading.
💡 If you often find yourself trading based on emotions, I recommend doing this type of pre-planning and quantifying your setups before execution — it can be a simple yet highly effective improvement.
---
**Trading is simple.** You don't need multiple indicators or dozens of lines on your chart. A clean and simple chart often works best — it keeps your decisions consistent and reduces uncertainty.
Sure, it might not look flashy, and my analysis may seem a bit "plain" compared to others… but that's how I like it.
If you find this analysis useful, feel free to follow me for more updates.
---
*Disclaimer: This post is for general informational and educational purposes only. It does not constitute financial advice, investment recommendation, or a service targeting specific investors, and should not be considered illegal or restricted information in any jurisdiction.*

BTC/USD) Bullish trend analysis Read The captionSMC Trading point update
Technical analysis of (BTC/USDT) on the 4-hour timeframe, using Smart Money Concepts and a falling channel breakout approach.
---
Technical Breakdown:
1. Market Structure:
Price has been moving within a descending channel, forming lower highs and lower lows.
BTC just bounced strongly from the Fair Value Gap (FVG) zone, marked in yellow, and the lower boundary of the channel, suggesting a potential trend reversal.
2. Key Levels:
FVG (Demand Zone): Between ~112,000–114,000 — price reacted from this zone with clear bullish momentum.
200 EMA (114,799.70): Price is currently below it, but if it reclaims this level, it will strengthen the bullish setup.
Target Point: ~123,287–123,327 — aligns with the upper boundary of the channel and previous resistance.
3. Projected Price Path:
Step 1: Price is expected to retest the mid-channel resistance and potentially break above.
Step 2: If confirmed, BTC may rally toward the 123k+ target zone, continuing the trend reversal.
4. RSI (14):
RSI is currently at 42.70, moving up from oversold territory (33.05 low), which supports a bullish reversal.
No bearish divergence seen, indicating room for upside.
Mr SMC Trading point
---
Trade Idea Summary:
Bias: Bullish
Entry Confirmation: Strong bounce from FVG and bullish candle close above 114,800 (EMA)
Target Zone:
TP1: 118,000 (channel midline)
TP2: 123,327.97 (channel top / resistance zone)
Invalidation: Close below 112,000 or breakdown of channel and FVG
Indicators: RSI recovery + strong volume bounce supports bullish scenario
plesse support boost this analysis)

BTCUSDBTCUSD needs some more downside before we start to see upwards momentum.
Disclosure: We are part of Trade Nation's Influencer program and receive a monthly fee for using their TradingView charts in our analysis.

BTCUSD: buyBTCUSD's performance is consistent with my expectations. It has rebounded slightly from the bottom and is currently trading at 118,200, representing an overall rebound of approximately 1,000p. Based on the trend, it's still at the bottom. It's still a safe bet to buy.
There was no major news in the market over the weekend that had an impact on trading products. While the meeting news wasn't clearly positive or negative, there was some progress in increasing holdings in the world's largest gold ETF, increasing by approximately 4 tons compared to the previous day. Furthermore, the Federal Reserve's interest rate decision will be announced next week. These two factors appear to be influencing gold prices and warrant our attention.
BTCUSD traders can choose to take some long positions during the holiday. Gold traders can enjoy the holiday and revisit more trading opportunities next week.

BTCUSD: BUYBTCUSD's performance over the weekend was very weak, with fluctuations of only about 1,000p. However, it is currently in the process of bottoming out, and a rebound is possible at any time. Therefore, despite the sluggish market over the weekend, investors who want to trade can still choose to buy BTCUSD and profit.

BTCUSDT:Elliot Wave 15minAccording to the previous analysis, it is expected that Bitcoin's upward trend will occur with the formation of waves 1 and 2. Considering the market structure, the market structure must be broken and stabilized above the previous ceiling, followed by a decline towards liquidity as the second wave, after which we will expect growth.

BTCUSD plunges on bad U.S. PPI report data and Bessent's commentBTCUSD plunges on bad U.S. PPI report data and Bessent's comments
Bitcoin fell to the 117,000 mark yesterday after US Treasury Secretary Scott Bessent confirmed that Washington will not buy more Bitcoin for its strategic reserves. Additionally, The U.S. Producer Price Index (PPI) data was released and it was quite disappointing. The core PPI year-over-year (YoY) increase was +3.7%, which was higher than the expected +2.9%. This confirms that tariffs are having the intended effect... and it seems that we may see another increase in inflation in the medium term. Therefore, I am not sure that the Federal Reserve will lower the key interest rate on September 17th.
Still, in short-term, btcusd has some support. The price is expected to decline towards lower border of the rising wedge, then rebound from it. In the mid-term, of course, rising wedge signals of a trend reversal, so, should be careful with long positions.

Bitcoin Market Loot Plan Activated — Watch It Climb!🔥🚨 THIEF TRADER’S ULTIMATE BTC/USD HEIST PLAN! 🚨🔥
Asset: BTC/USD "Bitcoin vs U.S. Dollar" – Crypto Market Robbery in Progress!
Plan: BULLISH HEIST – LAYERED ENTRY MASTERMINDED!
🎯 THIEF’S ENTRY STRATEGY (LAYERED LIMIT ORDERS):
"The vault is unlocked! Swipe the loot at ANY PRICE! But for elite thieves, use LAYERED LIMITS like a PRO!"
Buy Limits (Example):
🔹 122,000.00 (First Dip Grab!)
🔹 120,500.00 (Second Layer – More Stealth!)
🔹 121,500.00 (Third Strike – Smooth Criminal!)
🔸 121,000.00 (Final Trap – Max Loot!)
👉 Adjust layers based on YOUR risk appetite! More layers = More escape routes!
🛑 THIEF STOP LOSS (OG STYLE):
"SL? Yeah, we have one… but REAL THIEVES adjust on the fly!"
🔪 SL @ 117,500.00 (If Bitcoin snitches, CUT & RUN!)
⚠️ Pro Tip: Tighten SL if market flips bearish! Don’t get caught!
💰 TARGET: ESCAPE BEFORE THE COPS ARRIVE! 🚔
🎯 130,000.00 (Final Heist Zone – Police Barricade!)
🏃♂️ 129,000.00 (Early Exit? Smart Thieves Take Profit & DISAPPEAR!)
⚡ THIEF TRADER’S GOLDEN RULES:
✔ SCALPERS: Only LONG side! Quick in, Quick out!
✔ SWING THIEVES: Hold & Trailing SL for MAX LOOT!
✔ RISK? Your wallet, Your rules! Don’t blame the plan!
📢 THIEF ALERT! NEWS = VOLATILITY TRAP!
🚨 Avoid new trades during high-impact news!
🚨 Lock profits with TRAILING SL!
💥 BOOST THIS HEIST PLAN! (More boosts = More stolen money!💰)
🔥 LIKE, SHARE, & FOLLOW FOR NEXT HEIST! Stay stealthy, thieves! 🏴☠️🚀
🚀 SEE YOU AT THE NEXT CRYPTO ROBBERY! 🚀
#ThiefTrader #BitcoinHeist #LayeredEntries #CryptoGang

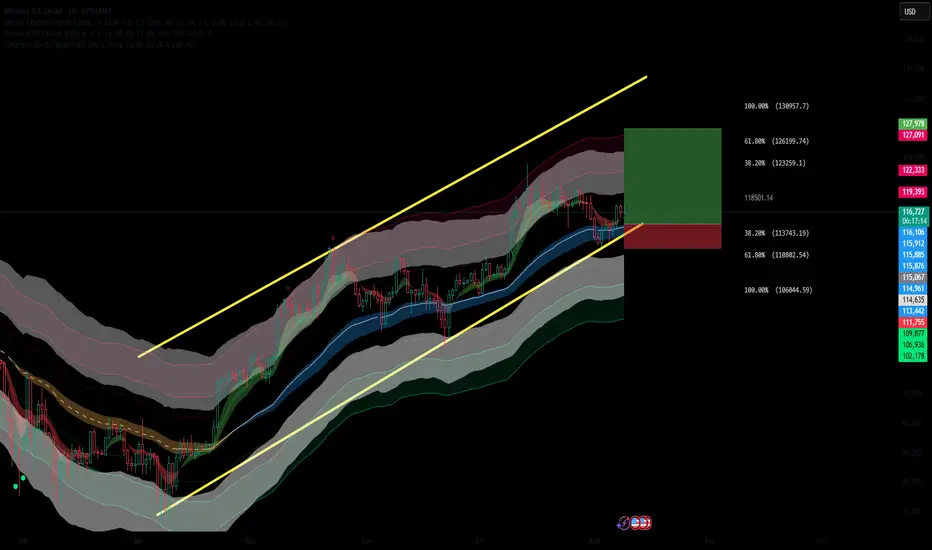
BTC Holding Strong: Fibonacci Levels Point to $130KBITSTAMP:BTCUSD is holding above a key dynamic support zone at the lower boundary of its ascending channel, with current price action signaling a potential continuation to the upside. This long setup is supported by multiple bullish confluences.
✅ Bullish Confluences:
Fibonacci Retracement Support: Price respected the 38.2%–61.8% Fib retracement zone between $113,769 and $110,828, confirming a strong demand area.
Trend Structure: Clear higher low formation on the daily chart, maintaining the bullish channel pattern.
EMA Cloud Support: Price remains above the multi-band EMA cloud, showing sustained bullish pressure and trend bias.
Channel Support: Bounce from the ascending channel’s lower trendline, keeping structure intact.
Bullish Candlestick Formation: Daily candle holding above key support with buying pressure evident.
Ideal entry would be between 113k and 114500.
🎯 Fibonacci-Based Targets:
TP1 – $123,285 (38.2%): Initial resistance and reaction zone.
TP2 – $126,225 (61.8%): Mid-extension target, aligns with prior swing high zone.
TP3 – $130,983 (100%): Full measured move to the channel top.
SL: Placed just below the 61.8% retracement (~$110,800), protecting against a breakdown of the bullish structure.
BTCUSD declined. What's next?BTCUSD declined. What's next?
Since the last report, bitcoin experienced significant decline on 3% from 122,000.00 without any significant reasons. Highly possible, that it is connected with profit-taking, as the price surpassed significant resistance level of 120,000.00. However, the asset reversed from the upper border of the descending channel (red color) and made another attempt to break through 120,000.00 level. Currently, the price just consolidates slightly below this level and above the average horizontal volume, according to a volume profile. In the mid-term the rise towards 130,000.00 is still expected.

BTCUSD SCALP Bitcoin scalp,I will be following the trend and keeping it simple with no indicators used for all these trades, will keep taking profits
BTC Buy / Long SetupWait for the entry till London Session, and Hold the trade, Must use SL with proper risk management.

BTC is heading to $130k+After 4 weeks of consolidation and strong liquidity grab from the weekly support BTCUSD started to rise to the upside with a bullish trend continuation showing possible upside bias. As 4h bull flag has broken the support and price started to trend, we may see this instrument reaching to $130k+?
A possible bullish trade is high probable!!

BTC perfectly hits $120K, latest BTC analysis and operations#BTCUSD
After nearly a week of volatile consolidation, BTC once again touched around 120,000. I have already made it clear to everyone before that once BTC stabilizes above 116,500, it may first touch 118,000 and then challenge the macro resistance level of 120,000. I think anyone who had carefully reviewed the strategy and thought seriously about the ideas behind it would have made substantial profits. Currently, BTC maintains an overall upward trend, but may face the risk of an overbought pullback in the short term. Those with sufficient funds in their accounts can consider shorting with a light position. BTC may reach 118,000-117,000 and stabilize before rebounding.

Go long again when it pulls backWhen BTC was around 112500 last week, I mentioned that it would rebound to at least 116500 📢, which was a great opportunity to go long 💰. As expected, after fluctuating in the low range for two days, it rebounded immediately🏹, peaking at 118000. It may still continue to rise, hit the 120000 threshold again🌟, and then pull back upon encountering the first resistance🌡️
⚡️⚡️⚡️ BTCUSD ⚡️⚡️⚡️
🚀 Buy@ 114000 - 114500
🚀 TP 116000 - 117000 - 118000
Daily updates bring you precise trading signals 📊 When you hit a snag in trading, these signals stand as your trustworthy compass 🧭 Don’t hesitate to take a look—sincerely hoping they’ll be a huge help to you 🌟 👇