Bitcoin 30M Bearish Bias Inside Rising ChannelMarket Structure
Overall macro bias remains bearish (strong sell-off on the left).
Price is currently moving inside a rising channel, which is acting as a bearish corrective structure.
Recent price action shows weak momentum near channel resistance → signs of exhaustion.
📐 Key Levels
Resistance Zone: 78,700 – 80,200
Current Price Area: ~77,900
Support / Target Zone: 76,800 – 75,100
🧠 Trade Idea (Short Bias)
Best entries near upper channel resistance.
Expect choppy consolidation, then a breakdown toward channel support.
Measured move target aligns with the previous demand / liquidity zone.
🎯 Bearish Scenario (Primary)
✔ Price rejects from channel top
✔ Break below 77,800 confirms weakness
✔ Continuation toward 76,800 → 75,100
⚠️ Bullish Invalidation
A clean 30M close above 80,200 invalidates the bearish setup.
That would open upside toward 82K+.
✅ Summary
Bias: Bearish continuation
Pattern: Rising channel (corrective)
Strategy: Sell rallies, not breakouts
Btcusdtanalysis

Bitcoin (BTCUSDT) — H4 Formation of the 3rd Wave + Trendline RetBitcoin (BTCUSDT) — H4 Formation of the 3rd Wave + Trendline Retest
🔎 Market Structure (H4)
On the H4 timeframe, Bitcoin has completed a strong impulsive decline followed by a corrective phase and is now forming a potential 3rd bullish wave.
Key technical points:
Clear impulse → correction → continuation structure
Price has retested the broken descending trendline
Current consolidation suggests preparation for wave 3 expansion
As long as price holds above the recent low, the structure favors upside continuation.
📐 Elliott Wave Context
• Wave 1 — impulsive move from local lows
• Wave 2 — corrective pullback into Fibonacci zone
• Wave 3 — expected to develop after trendline retest
This is a classic continuation setup, where the 3rd wave typically shows strong momentum and range expansion.
📍 Entry Zone
Entry: 79,367.25
Entry is aligned with:
Trendline retest
Fibonacci support cluster
Completion of wave 2 structure
Aggressive entries should be avoided until momentum confirms.
🎯 Target Levels (from the chart)
Upside targets are defined using Fibonacci extensions and structure highs:
TP1: 82,268.93
TP2: 84,038.16
TP3: 87,002.19
TP4: 91,229.95
Partial profit-taking is recommended at each target.
🛑 Invalidation / Stop
Stop: 74,502.72
Placed below the low of wave 1, fully invalidating the bullish wave-3 scenario if broken.
🧠 Risk & Trade Management
• This is a trend continuation setup, not a reversal
• Wave 3 confirmation is critical — avoid over-leverage
• Risk should remain controlled until impulsive acceleration appears
• Failure to hold above support may lead to deeper consolidation
📌 Summary
Bitcoin on H4 is forming a potential 3rd bullish wave after a clean trendline retest.
As long as price remains above 74,502, the structure favors upside continuation toward higher Fibonacci targets.

Bitcoin – Market Context & Liquidity PerspectiveEven though Bitcoin remains bullish in the long term, price has been in a corrective bearish phase since October, which is a normal reaction after a strong impulsive move.
Since October 2022, price has been retracing and is currently revisiting a key area that many traders are watching closely.
In the past, this level acted as resistance before being broken. Once broken, it became support, and price has recently reacted from this area.
At this level, many participants are positioning long, while others are already positioned short. It is important to remember that for price to move higher, sell-side liquidity is required.
In order to generate that sell-side liquidity, price often needs to trade below support levels where liquidity is resting. For this reason, I expect Bitcoin to sweep liquidity below the 72,000 level at minimum.
As long as the 98,000 high remains intact, there is no clear structural reason for price to move higher from current levels. Before a break above 98,000, a break below the 72,000 support is, in my view, more likely.

BTCUSDT - "GAME " ON 2m CHART, A QUICK SELL SET UP - 02-02-2026BTCUSDT - G-Money's short version analysis based purely on technical analysis only, no nonsense or "BS". I do totally ignore any fundamental analysis, technical analysis only
BTCUSDT - still kinda on the "move" and continue DOWN... (2m TRADE, RISKY...)
Who did enter this trade earlier congratulations! Who missed it... See you next time! ;)
Chart is itself explaining. Kept a "KISS" approach all the way ( "Keep It Simple, Stupid") & beginners friendly... ;)
I do hope that nobody ignoring SL ( Stop Loss) ! Without it, It is a fastest way to loose hard earned money...
;)
Trade safe & don't do "gambling". In the end it never pays, not worth it to risk loose all your $...
PS: above technical analysis is done for the community & educational purpose only! It is not a financial advice. Just share my very own insight to it.

BTCUSDT - 2m UPDATE, EXIT WITH PARTIAL PROFIT 03-02-2026BTCUSDT - still kinda on the "move" and after some "INSTITUTIONAL" manipulations will continue DOWN...
Who did enter this trade earlier congratulations! Who missed "BE" Stop Loss... See you next time! ;)
Sadly 2m "quick" trade "mutated " and multiply to 5m failed set ups, developed institutional "accumulation" and SL sweep range .
"BE" Stop Loss exits from 2 trades ( Leverage * 50 = +60%P/L and LEV.*20=+6% P/L )
Stay "SAFE" today, don't rush with entering trades, seems going to be Loss Stop "hunting" day...
Educational "piece":
An Institutional Stop Loss (SL) Sweep (also known as a liquidity sweep or stop hunt)
is a trading concept within Smart Money Concepts (SMC)
where large financial institutions deliberately drive prices beyond well-defined support or resistance levels to trigger the clustered stop-loss orders of retail traders
Chart is itself explaining. Kept a "KISS" approach all the way ( "Keep It Simple, Stupid") & beginners friendly... ;)
I do hope that nobody ignoring SL ( Stop Loss) ! Without it, It is a fastest way to loose hard earned money...
;)
Trade safe & don't do "gambling". In the end it never pays, not worth it to risk loose all your $...
PS: above technical analysis is done for the community & educational purpose only! It is not a financial advice. Just share my very own insight to it.

BTCUSD 15M | Descending Channel Reaction – Buy the PullbackMarket Structure
Price was moving inside a descending channel (overall corrective / bearish pressure).
Strong rejection from the lower channel boundary → sharp impulsive bounce.
Now BTC is testing the upper channel / resistance zone, showing strength but also short-term hesitation.
🟨 Key Levels
Support zone: 77,750 – 76,450
→ Previous demand + breakout base.
Current price: ~78,890
Resistance / trigger area: 79,200 – 79,400
Upside target: 79,700 – 80,200
📈 Expected Scenario (Bullish Continuation)
A healthy pullback toward 78,000–77,800 would be normal.
As long as price holds above 77,750, bullish structure remains valid.
Break & 15M close above channel resistance → continuation toward 79.7k – 80.2k.
⚠️ Invalidation / Risk
15M close below 76,450
→ bullish idea fails
→ price may revisit lower channel support.
🧠 Trading Insight
This is a pullback → continuation setup, not a blind breakout.
Best entries come:
From support retest, or
After confirmed breakout + retest of resistance.
📌 Bias: Bullish while above 77,750
🎯 Target: 79,700 → 80,200
🛑 Invalidation: Below 76,450

BTC Bullish Setup: RSI < 30 Has Marked Strong ReversalsBTC Daily Chart – RSI < 30 Has Historically Marked Strong Bounce Zones
On the BTC daily chart, we can see a recurring pattern: whenever the RSI dips below the 30 level (oversold conditions), price has historically reacted with a notable bounce.
The highlighted blue circles show multiple instances across different market phases where:
- RSI dropped into oversold territory
-Price was trading near key support or demand zones
\-BTC followed with a relief rally or trend continuation move
This does not guarantee a bottom every time, but it does suggest that risk-to-reward improves significantly when BTC becomes oversold on higher timeframes like the daily chart.
Key takeaways:
- RSI < 30 on the daily has often aligned with local or macro bottoms
- These zones are worth watching for reversal signals, bullish divergence, or confirmation from price action
- Best used in combination with support levels, volume, and market structure
Cheers
Hexa

BTCUSD It is Inevitable...I hate to say it… but this chart is giving me flashbacks.
When you zoom out on BTC’s weekly structure, you see similarities between 2021 and what’s happening right now in 2025. This doesn't look good to me.
After the double-top formation in 2021, we got a relief rally that tricked everyone into thinking new highs were coming. But it was just a Bull Trap.
Fast forward to today:
Price is crawling back into the identical type of bull trap zone we saw last cycle at 0.38 Fibonacci (same as 2021).
If the market keeps repainting the same structure, BTC could deliver one more “hope” bounce into the red circle (which will be another bull trap)…only to roll over again and start a deeper correction.
No hopium here… just the chart speaking for itself.
I would recommend avoiding swing trades that leaves you exposed you to an uncertain market. Day trading remains effective but only on smaller timeframes.
Good Luck!

$BTC Weekly Fractal Breakdown. Liquidity around 70k!CRYPTOCAP:BTC — Weekly Market Structure Overview
Bitcoin is currently following a price sequence that closely resembles the previous market cycle.
During the last major distribution phase, price topped, broke market structure, retraced, and then declined approximately 32% into a weekly Fair Value Gap (FVG).
In the current cycle, the same structural behaviour has occurred, with a larger drawdown of roughly 40%, bringing price directly into a comparable weekly FVG.
---
Current area of interest
Weekly Fair Value Gap: 70,000 – 80,000
Price has now reached this zone.
The next significant technical reference is the 185-week exponential moving average (EMA), currently located near 70,000.
---
Historical behaviour at these levels
When Bitcoin reaches a weekly FVG during a distribution phase, the market typically follows a three-step process:
1. An initial reaction bounce
2. A period of range development
3. A directional resolution, which is usually one of the following:
– Reclaim of market structure, leading to continuation
– Failure to hold the FVG, resulting in a deeper correction
---
Key technical levels
Resistance: 91,000 – 95,000
Short-term risk below: 76,000
Next major liquidity zone: 70,000
---
This behaviour reflects systematic market rebalancing after distribution, rather than random price movement.
Participants who understand a higher-timeframe structure are better positioned—those who do not often provide liquidity for stronger hands.
---
As outlined in my previous BTC analysis, a sustained loss of the 185-week EMA would likely pave the way for the 50,000 region, a move that historically unfolds over several months rather than occurring rapidly.
For now, Bitcoin is expected to consolidate around the 70,000 area. Until price can reclaim a higher-timeframe structure, the short-term bias remains to the downside.
DYOR | NFA
Please hit the like button if you like it. Do not forget to follow me!
If this chart crosses 200 likes, I'll cover altcoins in the coming week.
Thank. you.

BTCUSDT - FEB/MARCH "VIBES" A QUICK SELL SET UP - 01-02-2026BTCUSDT - G-Money's short version analysis based purely on technical analysis only, no nonsense or "BS". I do totally ignore any fundamental analysis, technical analysis only
BTCUSDT - still kinda on the "move" and continue DOWN...
Who did enter this trade earlier congratulations! Who missed it... See you next time! ;)
(TRY TO "EXPLORE" LTF ENTRY SET UPS, DON'T RUSH TO "JUMP IN", TAKE YOUR TIME...)
Chart is itself explaining. Kept a "KISS" approach all the way ( "Keep It Simple, Stupid") & beginners friendly... ;)
I do hope that nobody ignoring SL ( Stop Loss) ! Without it, It is a fastest way to loose hard earned money...
;)
Trade safe & don't do "gambling". In the end it never pays, not worth it to risk loose all your $...
PS: above technical analysis is done for the community & educational purpose only! It is not a financial advice. Just share my very own insight to it.

BTCUSD – Bearish Channel Resistance Rejection Setup (30M)Alright, let’s break this BTCUSD (30-min) chart down clearly 👇
You’ve marked it well already — structure is doing most of the talking here.
🔍 Market Structure
Clear descending channel (lower highs + lower lows)
Price is respecting the channel boundaries → strong bearish control
Overall bias on this timeframe: Bearish continuation
🟦 Channel Behavior
Price is currently near the upper half / resistance zone of the channel
Multiple rejections from this zone in the past
Dashed midline acting as dynamic resistance
This tells us:
Rallies are corrective, not impulsive.
📍 Key Levels (from your chart)
🔴 Resistance / Sell Zone
82,800 – 83,500
Labeled correctly as RESISTANCE POINT
Ideal area for short entries after rejection
🟢 Entry
Around 82,450 – 82,800
Wait for:
bearish candle close
or rejection wick
or minor lower-high confirmation
🎯 Target
80,250 – 80,300
Aligns with:
channel support
previous liquidity sweep
Strong probability target if structure holds
🛑 Stop Loss
84,700 – 84,800
Above:
channel resistance
invalidation of bearish structure
📉 Trade Idea Summary
Bias: Short
Setup Type: Trend continuation (bearish channel)
Plan:
Let price react at resistance
Look for rejection / weak bullish candles
Enter short
Target channel support
SL above channel = protected trade
Risk–Reward:
✅ Clean and favorable (worth taking if confirmation appears)
⚠️ Important Notes
If price breaks and holds above the channel, this setup is invalid
No FOMO — wait for reaction, not blind entry
Best confirmation = rejection + volume slowdown

Bitcoin Long-Term Monthly Chart: Parabolic Advance Meets DistribMacro Trend
Bitcoin is still in a long-term bullish structure. Each cycle shows higher highs and higher lows since inception.
The move from ~20k to ~90k happened in very few monthly candles, which signals a parabolic phase rather than healthy trend growth.
2. Current Candle Structure
The most recent candles show:
Large bullish impulse followed by
Strong rejection wicks and consecutive red monthly candles
This usually indicates profit-taking and distribution, not immediate trend continuation.
3. Volatility & Momentum
The current red candle (~-10%) after a blow-off green candle suggests:
Momentum is cooling
Buyers are no longer in full control
Historically, after similar structures (2013, 2017, 2021), BTC entered extended consolidation or deep pullbacks.
4. Volume Insight
Volume peaked during the explosive green candles and is now declining, which often means:
Smart money already positioned
Late buyers are absorbing supply
5. Key Levels to Watch
78k–80k: Current support (short-term)
60k–65k: Strong macro support (prior cycle top zone)
45k–50k: Extreme but historically reasonable retracement in bull cycles
6. Probable Scenarios
Base Case (Most Likely):
Sideways to downward consolidation over several months (range expansion).
Bull Continuation:
Needs a strong monthly close above prior highs with increasing volume.
Bearish Extension:
Loss of 60k opens the door for a deeper macro correction.

BTC/USDT – Bearish Flag Breakdown | Bigger Correction Ahead?Bitcoin is currently forming a classic Bearish Flag pattern on the higher timeframe after a strong impulsive sell-off. This structure often signals trend continuation, and price action is now approaching a critical decision zone. BINANCE:BTCUSDT
📉 Strong impulse move down (flagpole) confirms bearish momentum
🏳️ Bearish flag consolidation forming inside rising channel
❌ Rejection near flag resistance increases breakdown probability
🔻 Breakdown could open the door toward:
🌍 Fundamental Perspective
1.Bitcoin sentiment is currently pressured by:
2.Profit-taking at higher levels after extended bullish runs
3.Macro uncertainty & risk-off sentiment across global markets
4.Interest rate expectations and USD strength impacting crypto flows
5.Reduced short-term liquidity entering the market
💰Take Profit (TP): At the Key Zone – major support area identified ahead.
🛑Stop Loss (SL): Above the pattern structure / recent swing high.
✅Psychological Discipline:
1️⃣Stick to plan – No Revenge Trades.
2️⃣Accept losing trades as part of the strategy.
3️⃣Risk only 1–2% of your account balance per trade.
✅ Support this analysis with a
LIKE 👍 | COMMENT 💬 | FOLLOW 🔔
It helps a lot & keeps the ideas coming!
⚠️ Disclaimer: This analysis is for educational purposes only and does not constitute financial advice. Forex trading involves high risk. Trade only with capital you can afford to lose and always do your own research.

Bitcoin Breakdown Accelerates – ETF Outflows & Geopolitical RiskAs I expected in the previous idea , Bitcoin( BINANCE:BTCUSDT ) not only reached its target but even dropped further, surpassing all initial targets (full target and beyond).
In the past 24 hours, Bitcoin’s decline has been driven by several factors. First, the increasing tensions in the Middle East play a significant role. Second, over one billion dollars has been withdrawn from ETFs, which is not a positive sign for Bitcoin.
Currently, Bitcoin seems to have broken through the support zone($86,420-$83,820), and this break has been accompanied by high volume. It also appears to be in a pullback phase.
From an Elliott Wave perspective, we can anticipate that Bitcoin may begin a new five-wave decline. The intensity of this wave could vary depending on fundamental conditions and incoming news.
I expect that once Bitcoin enters Cumulative Short Liquidation Leverage($86,240-$84,850), it may drop to around $80,273. If the bearish momentum continues, we could see even lower targets.
Notes: Over the weekend, the possibility of increased tensions between the U.S. and Iran, as well as broader geopolitical issues, could impact Bitcoin’s movement. Also, given that trading volumes tend to drop on weekends, we shouldn’t expect massive price swings unless significant news breaks. Therefore, it’s crucial to manage your risk carefully.
First Target: $80,273
Second Target: $78,463
Stop Loss(SL): $86,756
Cumulative Long Liquidation Leverage: $81,000-$78,130
CME Gap: $93,060-$92,940
💡 Please respect each other's opinions and express agreement or disagreement politely.
📌Bitcoin Analysis (BTCUSDT), 1-hour time frame.
🛑 Always set a Stop Loss(SL) for every position you open.
✅ This is just my idea; I’d love to see your thoughts too!
🔥 If you find it helpful, please BOOST this post and share it with your friends.

BTC/USDT - Bitcoin H1 | Continuation Pattern Signals Downside📝 Description🔍 Setup (Technical Structure) BINANCE:BTCUSDT
BTC/USDT is forming a classic Bearish Pennant pattern on the H1 timeframe.
After a strong impulsive sell-off (flag pole), price consolidated inside a tight pennant structure, showing lower highs and weak buying pressure.
Price remains below EMA & Ichimoku cloud, confirming bearish control and continuation bias.
This structure typically favors trend continuation, not reversal.
📍 Support & Resistance
🔴 1st Support: 85,800 – 86,000
🔴 2nd Support (Flag Target): 84,000 – 84,200
🟡 Pennant Resistance Zone: 90,500 – 91,000
Flag-pole height projection aligns with lower support targets
#BTCUSDT #Bitcoin #CryptoTrading #BearishPennant #PriceAction #TechnicalAnalysis #TradingView #Kabhi_TA_Trading
⚠️ Disclaimer
This analysis is for educational purposes only.
Crypto markets are highly volatile — always manage risk and use proper position sizing.
💬 Support the Idea 👍 Like if you’re bearish on BTC
💬 Comment: Continuation or fake breakdown? 🔁 Share with traders watching Bitcoin

The BTC "Fakeout" Play: My Exact Plan for $94,000The plan remains exactly as discussed. We need to see price reclaim support to confirm a 'fakeout' of the recent lows, which would open the door for an upward continuation toward $94,000 – $95,000.
⚠️ The Bear Case: However, if we see strong red candles on the daily close over the next few days, it’s a warning sign. This potential weakness could drive price further down toward the lower support zones at $84,800 – $83,500.

BTC Faces Major Resistance Before FOMC – Breakdown or Breakout?As I expected in the previous idea , Bitcoin( BINANCE:BTCUSDT ) has followed the anticipated bullish and bearish trends and has reached all of its targets (full target).
Now, the question is whether Bitcoin can sustain above the $90,000 level. Stay tuned!
At the moment, Bitcoin is moving near the resistance zone($90,600-$89,300) and around the 50_SMA(Daily), and the resistance line.
From an Elliott Wave perspective, it seems that Bitcoin is completing a Double Three Correction(WXY) within the ascending channel.
I expect that Bitcoin might not break through this resistance zone($90,600-$89,300) on the first attempt and could start to decline, potentially dropping to around $88,133. If the bearish momentum continues, we might see even lower targets.
First Target: $88,133
Second Target: Cumulative Long Liquidation Leverage: $87,000-$85,630
Stop Loss(SL): $91,823(Worst)
Cumulative Short Liquidation Leverage: $92,000-$91,000
CME Gap: $93,060-$92,940
In the coming hours, markets face the Fed Funds Rate decision and Powell’s press conference, which typically bring elevated volatility. If the Fed holds rates at 3.75% as expected, the initial reaction may be muted, but real movement will depend on forward guidance. Historically, when outcomes align with expectations, gold tends to stay supported amid uncertainty, especially with U.S. government shutdown risks in the background, while Bitcoin remains sensitive to liquidity signals and risk sentiment. Any shift in Powell’s tone — whether more cautious or more hawkish — can quickly drive sharp moves.
⚠️ Traders should expect volatility both at the release and during the press conference, avoid impulsive entries, and prioritize risk management.
Note: Rising tensions in the Middle East could quickly intensify Bitcoin's downward trend
💡 Please respect each other's opinions and express agreement or disagreement politely.
📌Bitcoin Analysis (BTCUSDT), 1-hour time frame.
🛑 Always set a Stop Loss(SL) for every position you open.
✅ This is just my idea; I’d love to see your thoughts too!
🔥 If you find it helpful, please BOOST this post and share it with your friends.

BTC KEY ZONES FOR UPCOMING SESSIONSLets see guys how price gonna react from this zones, they are really crucial zones the reaction gonna give us entries here but dont enter without confirmation.
If we got any idea related to confirmation near to those zones then we will just update.

BTC/USDT|Resistance becomes support89K holds.
Structure remains intact.
No prediction.
Just execution.
As long as price holds above 89,000,
bullish structure stays valid under my system.
If structure breaks, I’m out.
📊 1H structure

Coinranger|BTCUSDT. Potential reversal to 90930🔹Fed rates at 22:00 UTC+ 3, FOMC press conference at 22:30 UTC+ 3. We can fly on this news.
🔹US earnings season is in full swing.
🔥BTC
🔹Still holding towards 89840:
1️⃣ The main upper level has been clarified at 89840. Above that are 90930 and 92930, but these are just worth keeping in mind for now. This is a complete set of upside waves.
2️⃣ Below, the important 88,500 level is actual and 85,000 and 84,700 lower are still relevant.
Until the rate issue, bitcoin may be trading in a micro-flat of 89,840 - 88,500. There's a chance afterward of a move higher to 90,930.
---------------
Share your thoughts in the comments!

Coinranger| BTCUSDT. Continuing decline to 85,000🔥News
🔹No important news today. Only an old data on american market will be released, which is usually considered preliminary.
🔥BTC
🔹Fell down last night and broke through previous peak. Current levels:
1️⃣ The levels above can only be calculated tentatively. 88,500 is the first level for the end of the pullback.
2️⃣ The levels below - 85,000 and 84,700 - almost coincident potential ends of the downward sets of waves on h1 and h4.
Without news, we could either continue the decline, or make a pullback, and then, for example, fall further.
---------------
Share your opinion in the comments!

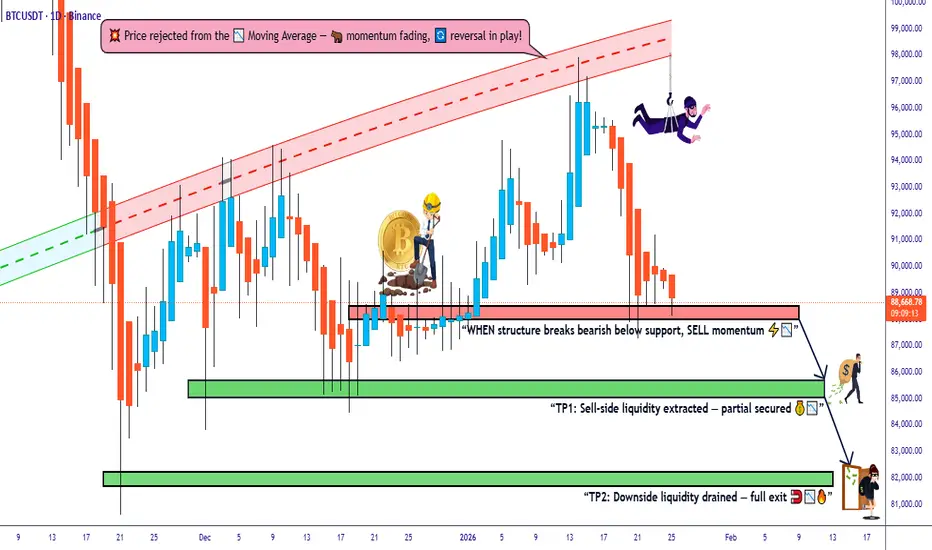
Bitcoin vs Tether: Structure Breakdown Trade Plan📊 BTC/USDT "BITCOIN VS TETHER" CRYPTO MARKET PROFIT PATHWAY SETUP 💰
🎯 TRADE TYPE: Day / Swing Trade - Bearish Bias w/ Bullish Rejection Signals
💡 REAL-TIME MARKET DATA (As of January 25, 2026) ✅
Bitcoin is currently trading around $88,516.85 USD, showing consolidation after recent volatility. BTC/USDT is down approximately 0.40% in the last 24 hours, with the market experiencing what analysts describe as a critical technical squeeze pattern.
🔥 TECHNICAL SETUP BREAKDOWN 🔥
📍 CURRENT PLAN: Bearish trend confirmed with multiple bullish rejection attempts at resistance zones
🎯 ENTRY ZONE: Support level breakout @ $88,000 📉
Pro Tip: Watch for volume confirmation on breakdown before entering position
🎯 TARGET 1: $85,500 (Initial profit-taking zone)
🎯 TARGET 2: $82,000 (Extended bearish target)
🛑 STOP LOSS: $91,000 placed at recent swing high resistance
⚠️ RISK DISCLOSURE ⚠️
Dear Trading OG's & Market Warriors 🏴☠️
These are MY technical levels based on current market structure. This is NOT financial advice! You're the captain of your own ship 🚢
✅ Your money, your rules, your responsibility
✅ Adjust TP/SL according to YOUR risk tolerance
✅ Never risk more than you can afford to lose
✅ Position sizing is KEY to survival in this game
📈 CORRELATED PAIRS TO WATCH 💎
Recent correlation data shows BTC exhibiting strong alignment with major cryptocurrencies, with Solana showing near-perfect correlation at 0.99, Ethereum at 0.89, and XRP at 0.86.
Monitor these pairs for confluence:
🔹 ETH/USDT (Ethereum) - Correlation: 0.89 | Trading ~$3,100
🔹 SOL/USDT (Solana) - Correlation: 0.99 (Almost identical movement!) | ~$175-$180
🔹 XRP/USDT (Ripple) - Correlation: 0.86 | Trading ~$1.89-$2.00
🔹 DOGE/USDT (Dogecoin) - Correlation: 0.87 | Meme power tracking BTC
🔹 ADA/USDT (Cardano) - Correlation: 0.86 | Parallel movement patterns
💡 KEY INSIGHT: The unusually high correlations suggest the market is moving in unison, with broad sentiment overriding individual asset characteristics. When BTC moves, expect these pairs to follow!
📰 FUNDAMENTAL & ECONOMIC FACTORS 🌍
🔴 CRITICAL MACRO EVENTS INFLUENCING THIS TRADE:
1️⃣ Regulatory Landscape Shift 🏛️
Institutional experts highlight that regulatory clarity, particularly the potential passage of the Digital Asset Market Clarity Act, could be a key driver for Bitcoin's recovery path. The CLARITY Act aims to establish the CFTC as the primary regulator for digital commodities and end "regulation by enforcement."
2️⃣ Institutional ETF Flows 💼
Bitcoin spot ETFs accumulated over $1.9 billion in net inflows during the first week of January 2026, showing continued institutional appetite despite price weakness. However, recent patterns show a $1.2 billion inflow followed by a $243 million outflow, typical of tight consolidation phases.
3️⃣ Bollinger Bands Squeeze Alert! 📊
Bitcoin's Bollinger Bands have narrowed to less than $3,500, the tightest compression since July 2025, signaling an imminent major price move in either direction. This technical pattern historically precedes significant volatility explosions.
4️⃣ Market Sentiment Analysis 😰
Current market sentiment shows "extreme fear" conditions, which can actually be a contrarian bullish indicator. Historically, periods of extreme fear have coincided with attractive entry points for long-term investors.
5️⃣ Interest Rate Environment 📉
Potential Federal Reserve rate cuts and a more accommodating monetary policy stance toward crypto could support Bitcoin in 2026, though geopolitical uncertainties and elevated equity valuations create a complex investing environment.
6️⃣ Expert Price Forecasts 🎯
Industry analysts forecast a wide range for Bitcoin in 2026, from lows of $75,000 to highs of $225,000, with major institutions like Standard Chartered and Citi projecting targets between $143,000-$150,000.
7️⃣ Supply-Demand Dynamics ⚖️
Corporate treasuries and sovereign reserves have absorbed Bitcoin's annual production by a factor of 4.7 in 2026, creating a significant supply-demand imbalance that could support long-term price appreciation.
🎲 UPCOMING CATALYSTS TO WATCH 📅
🔸 January FOMC Meeting - Fed policy decisions impacting risk assets
🔸 U.S. Midterm Elections (2026) - Political uncertainty factor
🔸 GENIUS & CLARITY Acts - Legislative developments
🔸 AI Investment Sustainability - Tech sector correlation effects
🔸 Geopolitical Tensions - Safe-haven vs risk-off dynamics
🧠 TECHNICAL CONFLUENCE CHECKLIST ✔️
✅ Multiple bearish rejections at resistance
✅ Support level identified at $88,000
✅ Volume analysis confirming selling pressure
✅ Bollinger Bands squeeze = volatility explosion incoming
✅ RSI positioned neutrally (room to move either direction)
✅ 720-day moving average intact at $86,000 as long-term support
✅ Key resistance cluster at $94,000-$95,000 zone
💪 PROFESSIONAL TRADER MINDSET 💪
Remember:
🎯 Plan your trade, trade your plan
🎯 Risk management > Being right
🎯 Markets reward patience and discipline
🎯 One trade doesn't define your career
🎯 Protect your capital like it's your last dollar
📢 FINAL THOUGHTS 🚀
This setup offers a defined risk-reward opportunity in a market experiencing historically low volatility that typically precedes major price movements. The confluence of technical patterns, institutional flows, and regulatory developments creates an intriguing setup for both day and swing traders.
Trade smart, not emotional! 🧠💎
🔔 LIKE, BOOST & FOLLOW FOR MORE PREMIUM SETUPS! 🔔
💬 DROP YOUR THOUGHTS IN THE COMMENTS! 💬
🚀 LET'S GET THESE GAINS TOGETHER! 🚀
#Bitcoin #BTCUSDT #CryptoTrading #TechnicalAnalysis #DayTrading #SwingTrading #CryptoSignals #TradingView #BTC #Cryptocurrency #PriceAction #SupportAndResistance #TradingStrategy #RiskManagement #BearishSetup #MarketAnalysis #CryptoMarket #BTCAnalysis 📊💰🎯
BTC vs HYPE - or we will grow from here like hypeWhy the setups are actually similar (BTC ↔ HYPE)
Common characteristics:
Upward impulse → pullback
The pullback does NOT break the impulse low
Price is holding:
either the 0.382–0.5 Fibonacci zone
or an ascending local trendline
Structure = bullish pullback, but without confirmation
So this is not “weakness” — it’s a test.
2️⃣ Key moment — where we are now
Right now we are:
below the local high
at the edge of a Fibonacci zone, where:
either real buyers step in
or the market says: “Okay, let’s go deeper.”
And this is where it becomes critical:
how the Sunday candle opens
3️⃣ Two scenarios (and they are clean)
🟢 SCENARIO 1 — MOVE UP FROM HERE
Valid if:
Sunday opens without a gap down
The candle holds 0.382 / the trendline
We see:
a long lower wick
or an impulsive reaction to the upside
👉 Then this is:
liquidity collection
trend continuation
targets: a return to the local high + extension
This is a healthy, clean bullish continuation.
🔴 SCENARIO 2 — DROP ON THE OPEN
Triggered if:
Sunday opens below 0.382
The candle closes below the trendline
There is no fast buyback
👉 Then:
the pullback is invalidated
this becomes distribution → continuation down
logical targets:
0.618
or a full retest of the impulse
And this part is critical:
don’t try to catch the knife
because this would no longer be a “correction,” but a phase shift.
