BTCUSDT — H4 Wave 3 Formation + Trendline BreakoutBTCUSDT — H4 Wave 3 Formation + Trendline Breakout
🔎 Market Structure (H4)
On the H4 timeframe, price has completed Wave 1, followed by a corrective Wave 2.
The current impulse confirms the formation of Wave 3 after a breakout above the descending trendline.
The move is developing inside a broader corrective environment, therefore this is treated as a local impulsive structure within a higher-timeframe correction.
📐 Higher Timeframe Context
• Higher TF remains corrective
• Wave 3 is forming as an internal impulse
• After target completion, a corrective phase (Wave 4 / ABC) is expected
📈 Primary Scenario — Wave 3 Expansion
Continuation of the upside impulse within Wave 3, followed by a corrective pullback once expansion targets are reached.
🎯 Target Levels (from the chart)
Upside targets (Wave 3):
98,011
95,868
93,849
92,627
Key structural support:
90,575 — reaction / structure-holding level
🛑 Invalidation / Stop
88,439 — low of Wave 2
A breakdown below this level invalidates the Wave 3 scenario.
🧠 Trading Notes
• Avoid chasing price — priority on pullback entries
• Partial profit-taking near targets is recommended
• Increased caution due to higher-timeframe corrective context
📌 Summary
Bitcoin on H4 shows a clear Wave 3 formation after a confirmed trendline breakout.
Targets are defined above, however the broader structure remains corrective — risk control and position management are critical.
Btcusdtanalysis

Coinranger| BTCUSDT. Flat at 90500 - 87550?🔥News
🔹The WEF continues. Preliminary US manufacturing and services PMI data will issue at 17:45 (UTC+3) - no sharp movements expected.
🔥BTC
🔹Staying within yesterday's levels:
1️⃣ The levels above are the same: 91800 and 92855.
2️⃣ Below, 87550 remains actual.
The situation remains unclear. A pullback is still possible - we're currently seeing a triangle forming in the second wave. Potential flat ranges are 90500 - 87550.
---------------
Share your thoughts in the comments!

BTCUSD BUY ZONE ACTIVATED | Cloud Support Holding Upside TargetBitcoin is showing signs of a short-term recovery after a strong sell-off. Price is currently holding near a key demand zone around 89K, while trading below the Ichimoku cloud — indicating the broader trend is still bearish, but a technical bounce is possible.Market Structure: Overall structure remains bearish with clear lower highs and lower lows. The recent sharp drop shows strong selling momentum.
Current Price Zone: Price is reacting from a demand/support area around 88.8K–89.2K, where buyers stepped in after the sell-off.
Ichimoku Cloud: Price is still below the cloud, and the cloud is acting as dynamic resistance. This means trend bias is bearish, but pullbacks are possible.
Support Levels:
Immediate support: 88.8K – 89.0K
If this breaks, next support near 87.5K
Resistance / Targets:
First resistance: 91,000
Major resistance: 93,000 (previous structure + cloud area)
Price Expectation: A relief bounce toward 91K–93K is possible if support holds. Rejection from these levels may lead to another bearish continuation.
Confirmation Needed: Bullish momentum and strong candles are required to sustain upside. Without confirmation, this move remains a counter-trend bounce.

Bitcoin Short Term Sell Trading Opportunity SpottedH1 - Bearish trend in play
Two Solid Resistance Levels
Trend continuation very likely after pullback.
👉 If you enjoy this analysis, please Like, Follow, and Support the profile! Your engagement motivates us to share more quality setups.

Coinranger| BTCUSDT: Uncertainty after the drop🔥News
🔹The International Economic Forum continues. Trump's speech is at 16:30 (UTC+3)
🔥BTC
🔹We've clearly followed the forecast. Now:
1️⃣ It's still hard to say for sure about the levels above. Preliminary figures are 91600 and 92855. But we could fall into a flat for a while.
2️⃣ The price may reach 87550 before continuing the pullback. I haven't marked any lower levels yet, because we're unlikely to go there without a pullback.
The priority is a pullback; reaching the lower level is also possible.

BTCUSD Bullish rally A big pullback is about to start, not a new ATH run. It will not go all-time high — the bigger trend is still bearish and this move is corrective within a broader downtrend.
Bullish confluences supporting a pullback rally:
1️⃣ Trendline support held cleanly with strong reaction → buyers defending higher lows
2️⃣ Fib confluence: price bounced from the 38.2–50% retracement zone, a classic pullback area
3️⃣ Volatility band expansion / momentum shift showing short-term bullish pressure after compression
🎯 Target:
100% extension at 108k
⚠️ Expect upside continuation only as a pullback. Into 108k, I’ll be watching for rejection signs, as the macro structure remains bearish.

BTCUSD: Retracement from elevated levelsBTCUSD trended in a pattern of pulling back from highs and extending weak consolidation during the intraday session. Hit by the escalation of U.S.-EU tariff frictions, rising geopolitical risks and a sell-off in risk assets, the price plummeted sharply from the high of $95,500 and now hovers within the range of $87,000–$91,000. Market panic sentiment is mounting, bears hold the upper hand technically, and rebound momentum remains constrained.
Support Levels:
Short-term Strong Support: 87,000 (lower boundary of the intraday consolidation range, key support zone for rebounds)
Secondary Support: 86,000 (weekly moving average support, previous congestion zone)
Medium-term Support: 85,000 (defensive line for the medium-term trend)
Resistance Levels:
Short-term Strong Resistance: 91,000 (intraday rebound resistance level, bears’ defensive line)
Secondary Resistance: 92,000 (4-hour moving average resistance, key resistance for rebounds)
Medium-term Resistance: 95,000–96,000 (previous all-time high, a strong resistance zone dominated by bears)
Trading Strategy:
Buy 88000 - 88500
SL 87500
TP 90500 - 91000 - 92000
Sell 91000 - 91500
SL 92000
TP 89500 - 88000 - 87200

BTC medium to long term doesn't look goodHello traders,
BTC is following the classic market maker's sell off pattern a classic distribution.
Each bounce is corrective, not impulsive. 2025 top will not be reached again for now. Not before 2027 imo. If you bought high, welp...sell at any price jump to mitigate as much damage. This is how sell-off models work:
➡️ breakdown
➡️ relief rally to rebalance inefficiency
➡️ continuation lower
As long as price fails to reclaim previous value areas, rallies remain sell opportunities, not trend reversals. The path forward favors range-to-range repricing, with volatility expanding during markdown before a new base is formed.
Bias: Bearish until proven otherwise.
Good Luck!
All our analysis is shared with honesty, care, and real effort. If you find value in it, a like or comment means a lot to show your support🙏📊

BTCUSD: Pressure-driven pullback then low consolidationBTCUSD traded in a pattern of correcting under pressure followed by low-range consolidation and recovery today. During the Asian session, it came under selling pressure alongside other risk assets amid escalating U.S.-EU trade frictions, with bears dictating the near-term price action. The core trading range has shifted lower to 90,000–93,000.
Support Levels:
90,000–90,500 (Strong Support): Confluence of the intraday low and the EMA30 trend support level, which has attracted buying interest on multiple retests and serves as the core short-term defense zone for bulls. A breakdown below this level could trigger a further decline toward the 89,000–89,800 range.89,000–89,800 (Medium Support): Boasts robust support strength; a test of this range is likely to trigger a technical rebound.
Resistance Levels:
92,800–93,000 (Strong Resistance): Confluence of the upper boundary of the intraday consolidation range and short-term moving average resistance. Bulls have made multiple unsuccessful attempts to breach this level, which stands as the key defensive line for short-term bears. A decisive breakout could open up upside momentum toward the 93,500–94,000 range.93,500–94,000 (Medium Resistance): Confluence of the 0.618 Fibonacci retracement level and previous swing highs, exerting marked downward pressure and acting as a key target for the bulls’ medium-term rebound.
Trading Strategy:
Buy 90500 - 90800
SL 91000
TP 92000 - 92500 - 93000
Sell 92800 - 93000
SL 93500
TP 92000 - 92500 - 93000

Coinranger| BTCUSDT. Pullback to 93720 and continued decline🔥News
🔹The International Economic Forum in Davos begins today and will continue all week. America is closed for M. Luther King Day. No other significant news.
🔥BTC
🔹Finally fell to the target levels last night. New:
1️⃣ I've only calculated potential pullback levels so far above: 94590 and 93720. These are all pullbacks on the H1 timeframe. They are the most likely in the near future.
2️⃣ Below we have H1 target levels: 91970, 89500, and 87600. Between them, there are intermediate levels on the M15: 90970 and 89500.
For now, the pullback is the priority; the most likely level is 93720.
-------------------
Share your opinion in the comments.

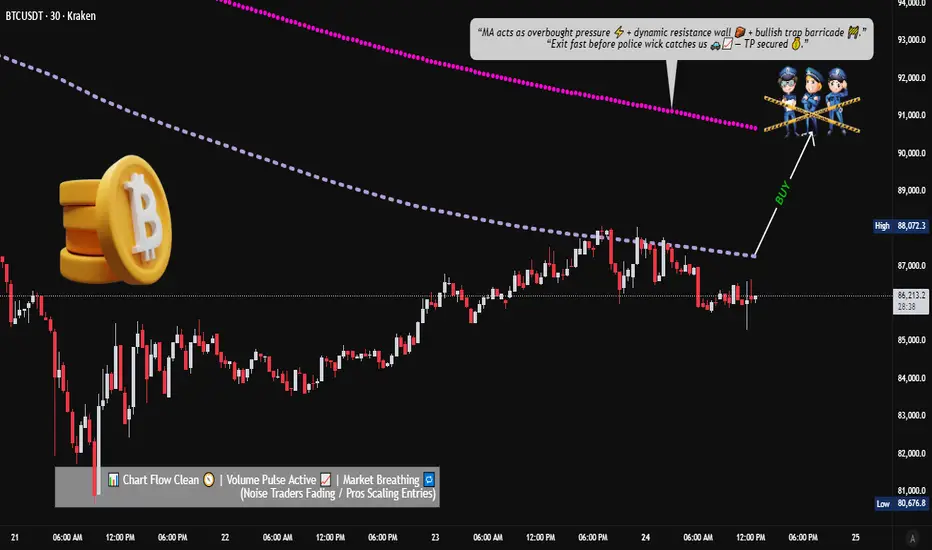
Bitcoin MA Breakout Setup: What Traders Should Watch Now📈 BTC/USDT – “BITCOIN VS TETHER” | Crypto Market Opportunity Blueprint (Day Trade)
🔥 Bullish Breakout Roadmap for Active Day Traders
🧭 PLAN:
Price is attempting a bullish breakout above key moving averages. Once price clears $88,000, momentum buyers may step in and drive a continuation leg upward.
🎯 ENTRY (Breakout Confirmation):
▶ Enter at any price level AFTER a clean moving-average breakout above $88,000.
Look for strong candle closes + volume expansion.
🛑 STOP–LOSS (Risk Management First):
⚠️ This is MY thief-style SL: $84,000
Dear Ladies & Gentlemen (Thief OG’s) — manage your own risk according to your playbook.
This is only my SL, not a rule. You’re free to adjust based on your own risk appetite.
💰 TARGET:
Moving averages align as a dynamic resistance zone, combined with overbought conditions and potential bull-trap signals.
Secure profits responsibly.
▶ Target: $90,800
Again — Dear Ladies & Gentlemen (Thief OG’s), this TP is MY personal level.
Book profits your own way, at your own risk.
🔍 Related Crypto Pairs to Watch (Correlation + Key Notes)
1️⃣ ETH/USDT (Ethereum)
Highly correlated with BTC in bullish phases
Strong ETH movement often front-runs or confirms BTC breakouts
Watch for ETH strength → may add confidence to BTC breakout trades
2️⃣ BTC.D (Bitcoin Dominance)
Rising BTC dominance = Capital flowing into Bitcoin → Supports bullish continuation
Falling dominance = Altcoins gaining share → BTC breakouts may weaken or turn choppy
3️⃣ TOTAL / TOTAL2 (Crypto Market Cap Charts)
Confirms whether capital is entering the entire crypto market
TOTAL rising with BTC strength = broad market confidence
TOTAL flat/dropping during BTC’s rise = possible bull trap
4️⃣ SOL/USDT (Solana)
Solana often moves aggressively when BTC breaks out
Sharp SOL rallies can signal strong risk-on momentum across majors
5️⃣ USDT.D (USDT Dominance)
When USDT dominance drops → Traders moving out of stablecoins → Bullish risk appetite
When it spikes → Smart money hedging → BTC breakout may fail
6️⃣ BTC/USDT Perp Funding Rate
Positive & increasing funding = heavy long side → Potential squeeze
Neutral funding = healthy breakout
Negative funding = breakout might be fueled by short covering
📊 Market Tone:
BTC continues to show strong buyer interest, but resistance pockets remain.
Trade mechanically. Don’t chase candles. Let structure confirm itself.
BTCUSD Stalls After Impulsive Drive: Market in Rebalancing ModeBitcoin is currently pausing after a strong directional move, with price action reflecting consolidation rather than a structural breakdown. Momentum has cooled, volatility is tightening, and the market appears to be recalibrating as participants reassess the next directional phase. This kind of behaviour often signals absorption of recent moves, keeping the broader structure intact while setting the stage for the next expansion.
Disclosure: We are part of Trade Nation's Influencer program and receive a monthly fee for using their TradingView charts in our analysis.

BTCUSD (45-Min) — Bearish Structure With Weak Momentum, WatchingMarket Structure
Price is forming lower highs, respecting a descending trendline (red dashed line).
This indicates a short-term bearish trend.
Current price is around 95,090, struggling to break above recent minor highs.
2. Price Action
Recent candles show small-bodied candles → lack of strong buying pressure.
Rejections near 95,200–95,300 suggest this area is acting as near-term resistance.
Downside pressure remains dominant unless the trendline is clearly broken.
3. RSI (14)
RSI is around 46, below the neutral 50 level.
This confirms bearish momentum, but not oversold.
No strong bullish divergence visible yet → sellers still have control.
4. AO (Awesome Oscillator)
AO is negative (-65) and flattening.
Indicates weak bearish momentum, not aggressive selling.
Often precedes either consolidation or a continuation move.
5. MACD
MACD lines are below zero and moving sideways.
Histogram is weak → momentum is bearish but slowing.
No bullish crossover yet, so trend reversal is not confirmed.
6. Key Levels
Resistance:
95,200 – 95,300
Trendline resistance above current price
Support:
94,650
94,400 (next major downside target if support breaks)
7. Bias & Scenarios
Bearish Bias: While below the descending trendline.
Bearish Continuation:
Break below 94,650 → possible move toward 94,400 or lower.
Bullish Invalidation:
Strong close above 95,300 + trendline break → shift toward 95,600–95,800.

: BTCUSD Daily Chart – Rising Trendline Holds, Momentum ImprovinPrice Structure
Bitcoin is trading around $95,000, respecting a rising trendline from the December lows.
The market has shifted from a strong downtrend (Nov) into a higher-low / higher-high structure, suggesting a short-term bullish recovery.
Price recently pulled back slightly after testing the $98k–$99k resistance zone, which is acting as near-term supply.
Trend & Support/Resistance
Key Support:
Trendline support: $92k–$93k
Horizontal support: $88k–$90k
Key Resistance:
Immediate: $98k–$99k
Major psychological level: $100k–$107k (next upside zone if breakout occurs)
RSI (14)
RSI is around 61–62, above the neutral 50 level.
This indicates bullish momentum without being overbought yet.
No clear bearish divergence at the moment; momentum remains constructive.
MACD
MACD lines are crossed bullish and flattening slightly.
Histogram remains positive, suggesting upside momentum is still present but losing some acceleration.
AO (Awesome Oscillator)
AO has turned positive (green bars), supporting the bullish continuation bias.
Momentum is improving compared to December.
Overall Bias
Short-term bias: Bullish to neutral
As long as price holds above the rising trendline, buyers remain in control.
A clean daily close above $99k could open the door to a $100k+ breakout.
A breakdown below $92k would weaken the bullish structure and signal a deeper pullback.

BTC/USD Price Framework Based on Structure and Liquidity🎯 BTC/USD Professional Trading Setup | Bitcoin vs US Dollar Analysis
💰 CRYPTO MARKET PROFIT PATHWAY SETUP (Day/Swing Trade)
📊 ASSET OVERVIEW
Trading Pair: BTC/USD (Bitcoin vs US Dollar)
Market: Cryptocurrency
Trade Type: Day Trading / Swing Trading
Strategy: Thief Layer Entry System (Multiple Limit Orders)
🔥 TRADE PLAN: BULLISH BIAS
🎯 ENTRY STRATEGY - "THIEF LAYERING METHOD"
This strategy utilizes multiple limit orders to capture optimal entry zones. You can enter at ANY price level, but recommended layer entries:
💎 Bull Limit Layer Entries:
Layer 1: $92,000
Layer 2: $93,000
Layer 3: $94,000
Layer 4: $95,000
Note: You can increase/decrease layers based on your risk appetite and capital allocation
🚨 TARGET ZONE - "POLICE FORCE RESISTANCE"
🎯 Primary Target: $105,000
Technical Reasoning:
Simple Moving Average (SMA) acting as strong resistance
Overbought conditions expected at this level
Correlation with traditional market resistance zones
Trap zone for late entries - ideal profit-taking area
⚠️ Disclaimer: Dear Ladies & Gentlemen (Thief OG's), I'm NOT recommending you set ONLY my TP. This is YOUR trade - take profits at YOUR own risk and comfort level! 💪
🛑 STOP LOSS - "THIEF PROTECTION ZONE"
🔒 Stop Loss: $89,000
⚠️ Disclaimer: Dear Ladies & Gentlemen (Thief OG's), I'm NOT recommending you set ONLY my SL. Risk management is PERSONAL - protect your capital at YOUR own discretion! 🛡️
🔗 CORRELATED PAIRS TO WATCH
Monitor these pairs for correlation signals and market confirmation:
ETH/USD (Ethereum) - $3,200-$3,500 range
Key Point: ETH typically follows BTC momentum with 70-80% correlation. Strong ETH moves confirm BTC direction.
SPX/USD (S&P 500) - Watch $5,900-$6,000 levels
Key Point: Risk-on sentiment in equities = bullish crypto flow. Inverse correlation during risk-off.
DXY (US Dollar Index) - Monitor 108-110 range
Key Point: Inverse correlation - Weak dollar = Strong BTC. Dollar strength = BTC pressure.
GOLD/USD (XAU/USD) - $2,650-$2,700 zone
Key Point: Both are "alternative assets" - Gold strength indicates inflation hedge demand, bullish for BTC.
NDX/USD (NASDAQ 100) - Tech correlation
Key Point: BTC trades like a risk asset - Strong NASDAQ = Bullish crypto sentiment.
📰 FUNDAMENTAL & ECONOMIC FACTORS
🌍 CURRENT ECONOMIC LANDSCAPE (Real-Time Considerations)
🔴 Key Factors Influencing BTC/USD:
🏦 Federal Reserve Policy
Current Fed stance on interest rates (January 2026)
Monetary policy direction impacts risk assets
Watch FOMC meeting minutes and statements
📊 Inflation Data (CPI/PPI)
High inflation = BTC bullish (inflation hedge narrative)
Low inflation = Possible risk-off, pressure on crypto
Next CPI release dates are critical
💵 US Dollar Strength (DXY)
Strong dollar = Bearish for BTC (inverse correlation)
Weak dollar = Bullish for BTC
Current DXY trending near multi-month highs/lows
🏛️ Regulatory Environment
SEC crypto regulation developments
Bitcoin ETF flows and institutional adoption
Global crypto legislation updates
⚡ Bitcoin-Specific Fundamentals
Hash rate and network security
Exchange inflows/outflows (whale movements)
Mining difficulty adjustments
Institutional accumulation patterns
📅 UPCOMING NEWS EVENTS TO WATCH
US Economic Data: GDP, Employment reports, Retail sales
Fed Speeches: Any commentary from Powell or voting members
Crypto Regulations: SEC announcements, ETF decisions
Global Risk Events: Geopolitical tensions affecting risk appetite
Tech Earnings: Major tech companies (correlate with BTC sentiment)
⚡ TECHNICAL CONFLUENCE
✅ Bullish Indicators:
Layer entry zones align with demand areas
SMA resistance provides clear target structure
Risk/Reward ratio favorable with defined SL/TP
⚠️ Risk Considerations:
Overbought conditions at target zone
Potential trap for late entries above $105K
Macro economic headwinds could shift sentiment
💡 THIEF OG'S PHILOSOPHY
🎯 "Make Money, Take Money, Manage Risk"
This isn't financial advice - it's a technical framework for disciplined traders. Your capital, your rules, your responsibility!
🚀 Trade smart, layer entries, respect the plan, and let the market pay you!
🔔 ENGAGEMENT CALL
👍 Like if this setup resonates!
💬 Comment your entry layers and targets!
🔄 Share with fellow Thief OG's!
⭐ Follow for more professional crypto setups!
📈 Good luck, Thief OG's! May the profits be with you! 💎🙌

BTCUSD Intraday AnalysisBTCUSD traded in a pattern of retesting support followed by consolidation intraday, maintaining a high-range oscillation overall with the bullish structure remaining intact. The core intraday tussle focused on the 94,000–96,000 range, where profit-taking flows and support buying coexisted in balance.
Intraday Short-term Levels:
Support Levels:
94,200–94,300 (Strong Support): Confluence of intraday lows, short-term neckline and the 0.618 Fibonacci retracement level, with effective buying interest confirmed by multiple retests.
94,800–95,000 (Medium Support): Lower boundary of the consolidation range, acting as a secondary key defense zone for short-term bulls.
Resistance Levels:
95,700–95,800 (Strong Resistance): Confluence of intraday highs and previous swing highs; a decisive breakout requires significant volume confirmation.
96,000–96,500 (Medium Resistance): Psychological level plus previous congestion zone, exerting marked downward pressure on price action.
Trading Strategy:
Buy 94800 - 95000
SL 94000
TP 95500 - 96000
Sell 95800 - 95600
SL 96000
TP 95000 - 94500

#BTC/USD Weekly Update Rally to $106k but still Scary!!BTC Weekly:— sharing an honest view, and I’m open to being wrong unless proven otherwise.
There could be another move toward $100k–$106k, but the structure suggests it may turn into a trap.
Given the current conditions, focusing on scalping high-volume coins with clear invalidation levels, tight stop losses, and modest targets seems more prudent.
Holding positions for the long term doesn’t appear optimal in this kind of market.
Still, always do your own research, NFA!
Thank you
#PEACE

BTCUSDT — H4 | Corrective Pullback / Bearish Continuation ScenarBTCUSDT — H4 | Corrective Pullback / Bearish Continuation Scenario
Bitcoin is trading below recent highs after a sharp impulsive move up, with price currently developing a corrective structure inside the rising channel. Short-term pressure remains to the downside.
🧩 Technical Overview
• Strong impulsive rally was followed by rejection near the upper channel boundary.
• Current price action forms a corrective pullback, not a confirmed trend reversal.
• Structure suggests potential continuation lower toward key support zones on H4.
📉 Bearish / Corrective Scenario
• Key resistance zone: 95,800–96,200
• Invalidation / Stop-loss: above 98,000
(above the recent swing high and channel resistance)
• Downside targets:
– 93,300 — first reaction / intraday support
– 90,170 — mid-range support
– 86,620 — lower channel boundary
– 81,330 — extended corrective target
A clean break below 93,300 would confirm continuation toward the lower targets.
⚙️ Market Context
• Higher-timeframe trend remains bullish, but H4 is in correction mode.
• Channel structure defines clear risk boundaries.
• Momentum favors further downside while price stays below resistance.
🧭 Summary
BTCUSDT is in a corrective bearish phase on H4 below 98,000.
Primary focus remains on a pullback toward 93,300 → 90,170 → 86,620, with a deeper extension possible if selling pressure accelerates.

Coinranger| BTCUSDT. Is growing still actual?🔥News
🔹No important news today. Potentially, Trump could start doing something in Iran. And, as we remember, in such cases, crypto can go down very fast.
🔥BTC
🔹However, yesterday it broke through 96,700 and even went a little higher:
1️⃣ Today's levels above: 98,900, and that's a bit too much. There are a couple of lower timeframe levels: 97,860 and 98,300. But today, both Trump and the pending US crypto laws are against crypto growing.
2️⃣ Levels below, a bit updated: 94,770, 93,460, 92,450
The downside move remains the priority. Glassnode data isn't talking about an influx of new capital, but about a short squeeze. This is a dangerous and fragile situation for such powerful growth.

XRP/USDT | Bullish Breakout + Structure Holding📈 XRP/USDT — Bullish Breakout Pathway Activated!
RIPPLE vs TETHER | Crypto Market Trade Opportunity (Day / Swing)
🔍 Market Overview
XRP/USDT is showing strong bullish intent after a confirmed moving average breakout followed by a healthy retest. Price structure remains constructive, suggesting momentum continuation if buyers maintain control above key zones.
This setup is designed for both Day Traders & Swing Traders, with a layered entry strategy for risk-controlled positioning.
🧭 Trade Plan – Bullish Bias
✅ Trend Direction: Bullish
✅ Confirmation: Moving Average Breakout + Retest
✅ Momentum: Buyers defending structure with volume stability
🎯 Entry Strategy (Layered Execution)
📌 Entry Type: Flexible / Any price level entry using Layering Method
Thief Layer Strategy (Bullish Limit Zones):
🟢 Buy Limit 1: 2.0500
🟢 Buy Limit 2: 2.1000
🟢 Buy Limit 3: 2.1500
➡️ Traders may add or adjust layers based on personal risk management and timeframe.
This approach helps average entries efficiently during pullbacks while aligning with the higher-timeframe trend.
🏁 Target Zone
🎯 Primary Target: 2.4000
📊 Rationale:
Moving Average acting as dynamic resistance (Police Force Zone)
Market currently showing overbought behavior near resistance
Possible liquidity trap & correlation pressure expected near highs
💡 Action: Partial profits recommended near resistance zones to protect gains.
🛑 Stop Loss (Risk Control)
🔴 Stop Loss: 2.0000
⚠️ This SL is based on structure invalidation, not emotion.
Each trader may customize SL placement according to account size and risk tolerance.
📌 Risk Disclaimer
Dear Ladies & Gentlemen,
This trade plan is not financial advice.
You are free to secure profits or manage risk according to your own strategy and discipline.
🔗 Related Pairs to Watch (Correlation Insight)
Monitoring correlated assets helps confirm strength or weakness in XRP:
COINBASE:XRPUSD 💵 – Dollar-based momentum confirmation
BINANCE:BTCUSDT 🟠 – Overall crypto market direction & risk sentiment
BINANCE:ETHUSDT 🔷 – Altcoin flow & capital rotation signal
CRYPTOCAP:USDT.D 📉 – Tether dominance (falling dominance = bullish for alts)
📌 Key Insight:
If BTC & ETH remain stable or bullish, XRP continuation probability increases.
Rising USDT dominance may signal temporary risk-off behavior.
🌍 Fundamental & Economic Factors to Monitor
📰 Crypto-Specific Drivers
Ripple ecosystem updates & adoption news
Regulatory clarity surrounding XRP
On-chain volume & wallet activity trends
🌐 Macro & Economic Factors (Global)
U.S. Dollar strength (DXY impact on crypto liquidity)
Central bank tone (risk-on vs risk-off sentiment)
Crypto ETF flows & institutional participation
📆 High-Impact Events to Watch
Major U.S. macroeconomic releases
Central bank statements affecting risk assets
Sudden volatility in BTC dominance
📌 Pro Tip: Always check economic calendars & crypto news feeds before entry or scaling.
⭐ Final Note
This setup combines technical structure, layered execution, correlation analysis, and macro awareness — built for disciplined traders who respect both profit and protection.
👍 If this idea adds value, boost with a like
💬 Share your execution thoughts in comments
🔔 Follow for more structured market pathways
Trade smart. Manage risk. Let structure lead. 🚀

Bitcoin Aligns With Bullish Trend Metrics — What’s Next?🚀 BTC/USD — Bitcoin vs Tether | Bullish Profit Pathway (Day/Swing) 📈
Asset: BTCUSD — Bitcoin vs Tether (Realtime live price feed) 📊
✅ Bullish Setup Confirmed
Bullish trend confirmed with Hull Moving Average breakout — structure shift on higher timeframes. Momentum signals showing accumulation near support zones. 🟢
🎯 Trading Plan — Entry (Layer Strategy)
Thief strategy: A layered limit entry style method (multi-limit entries):
✅ Layer 1: ~93,000
✅ Layer 2: ~94,000
✅ Layer 3: ~95,000
➡️ Add additional layers as per your risk profile and real-time order flow.
Why layering? Better average price, less slippage, more control over drawdowns.
📌 Target & Notes
🔹 Primary Target: ~99,000 — key resistance & overbought trap zone 🛑
🔹 Monitor reaction at overhead supply / previous swing highs.
🔹 Lock partial profits into reaction zones — don’t be greedy, protect capital.
🔹 Important: You choose your own TP & RR (risk/reward) depending on your play style.
🛑 Stop Loss
💥 Thief SL Zone: ~92,000
➡️ This is a structural invalidation level for this bullish scenario.
✅ Adjust based on your risk tolerance — your risk, your money.
🔗 Pairs to Watch & Correlations 🔎
📌 ETH/USD (Ethereum) — often correlated with BTC swings — if ETH breaks key structure, BTC bias can extend.
📌 BTC/USDT & BTC/EUR — cross-pairs reveal strength vs USD/dollar index behaviour.
📌 S&P 500 / NASDAQ Indexes — crypto sentiment often mirrors risk asset flows.
📊 Technical Levels / Key Zones
✔ Support Range: 90,000–92,500 — critical accumulation band. 📉
✔ Resistance — watch reactions near 99,000+ and breakout extension zones.
✔ EMAs / MACD / RSI — confirm entry and momentum continuation. 📈
📊 Fundamental & Macro Factors — Real-Time News (London Time)
📰 Inflation & CPI Impact: BTC rallied through ~$92k after U.S. CPI inflation held lower, sparking renewed Fed rate-cut expectations — supportive for risk assets like Bitcoin.
📰 Safe-Haven Demand: Softer US inflation + geopolitical tensions are boosting Bitcoin demand near $95k.
📰 Institutional Demand: ETF inflows & broader institutional traction continue to underpin structural support.
📌 Upcoming Watchlist:
👉 FOMC / Fed rate announcements — major macro driver.
👉 U.S. CPI / PPI releases.
👉 Dollar Index (DXY) movement — inversely influences BTC sentiment.
👉 ETF flow reports & regulatory headlines.
📌 Risk Management Reminder
⚠️ This idea is educational — do your own analysis (DYOR). Manage position sizing and risk per your plan.
📌 Discipline > Emotion. Keep a trading journal.
🙌 Happy trading Thief OG’s — let the charts speak. 💎

Coinranger| BTCUSDT. Is further growth possible?🔥News
🔹Today at 16:30 (UTC+3) will issue the US PPI data for December, and most likely for October at the same time. Plus retail sales at the same time.
🔥BTC
🔹We soared to 95,000 on Trump's words about aid to Iran and made a good level. Now:
1️⃣ There's still 96,700 above, but we're unlikely to go there.
2️⃣ New levels below: 92,850, 91,450, 90,200 (preliminary estimates)
Theoretically, BTC should decline after such a rise; the number of completed upward waves is enough for a pullback. But PPI and Trump could change reality. For now, the priority is a pullback to 92,850.

BTCUSD – Bullish Setup (Daily)
BITSTAMP:BTCUSD is showing early bullish reversal confluences after a prolonged downtrend.
Bullish confluences:
Price bounced from the lower volatility band / demand zone
Higher low formed, breaking short-term bearish structure
Price reclaiming the mid-band / dynamic resistance (trend MA)
Bullish reaction from Fib retracement support
Volatility compression → expansion likely to the upside
As long as price holds above the 90,000–90,500 support, bullish continuation is favored.
🎯 Fibonacci Upside Targets:
Target 1 (38.2%): ~95,300
Target 2 (61.8%): ~98,400
Target 3 (100%): ~103,400
A clean break and hold above the 61.8% Fib would significantly increase probability of a full retrace toward the 100% level.
Invalidation:
Daily close below ~88,800 invalidates the bullish setup.
