BTC UPDATEBTC Update: The major swing low of BTC has been broken.
Keep an eye on the following levels as potential bounce points:
HTF Minor Support: GETTEX:52K to GETTEX:48K
HTF Major Support: $44.5k to $41.5k
As a reminder, I previously mentioned that the internal low was broken, and we remain bearish on BTC
Btcusdtanalysis

Bitcoin Can Go Up TemporarilyIt seems that Bitcoin has finally managed to break the Heavy Support zone($61,100_$58,700) as I expected in my previous Posts .
According to the theory of Elliot waves , the main wave 5 in the Potential Reversal Zone(PRZ) has ended, and we should wait for corrective waves .
Also, we can see Regular Divergence(RD+) between two Consecutive Valleys.
I expect Bitcoin to rise, at least temporarily, to the target I specified on the chart.
Note: If Bitcoin can break the Potential Reversal Zone(PRZ), the scenario will change.
Note: An important point you should always remember is capital management and lack of greed.
Bitcoin Analyze (BTCUSDT), 1-hour time frame ⏰.
Do not forget to put Stop loss for your positions (For every position you want to open).
Please follow your strategy; this is just my Idea, and I will gladly see your ideas in this post.
Please do not forget the ✅' like '✅ button 🙏😊 & Share it with your friends; thanks, and Trade safe.

$BTC Daily Long Trade IdeaConfluences:
* Weekly turning bearish
* BTC Range Lows are being swept
* No bounce from current demand zone
* Head to the 50-53k Order Block.
We must see strong bounce from Order Block in order to fly highs.
DYOR,
Cheers! 🥂

$BTC Long Idea Strong Confluences:
*Bullish Bat Pattern
*Respecting Range Low
*RSI Extremely Over Sold
Simply BTC needs a retracement, which I am expecting.
Do not forget to follow and share :)
Cheers 🥂

#BTC/USDT Broke the support, Next move explained!Welcome to this Idea on Bitcoin.
As speculated in my previous update, the price was unable to break the 100 EMA, resulting in a rejection and subsequent decline. Now, $56,452 appears to be the next significant level to monitor. The 200 SMA on the daily chart is also crucial, with the price currently trading around this level. Let's observe if this support holds.
It's important that funds currently in meme coins shift to stronger assets, as they are siphoning liquidity from the market.
Patience is key here. I've posted over 30 altcoin charts in the last 8 days, and prices are gradually moving towards accumulation levels. If this cycle mirrors previous ones, the current market depression will soon end. We just need to stay vigilant and look for opportunities.
**BONUS:** Use the 245 EMA to plot market bottoms on lower time frames (LTF) in the daily chart. It's very useful—try some backtesting.
If you like my content, please hit the like button and share your views in the comments section. Thank you.
#PEACE

Bitcoin RoadmapBitcoin started to fall for the umpteenth time with the news that the Mt.Gox exchange would return Bitcoins to the losers , as if the Mt. Gox exchange would start refunding BINANCE:BTCUSDT and BINANCE:BCHUSDT from the beginning of July 2024 (almost 6 more days).
After a few months, the Fear and Greed index entered the " Fear " range again. But I think it will also enter the " Extreme Fear " range.
Bitcoin is currently moving near the Resistance zone($63,450_$62,100) , the 21_SMA(Weekly) , and the lower line of the Failed Falling Wedge Pattern . ( pullback is probably being completed )
Note: Bitcoin has come below the 21_SMA(Weekly) after almost 250 days.
Note: When a reversal pattern fails, it will play a continuation role.
According to the theory of Elliott waves , Bitcoin seems to be completing the microwave 4 of the main wave 3 . If the Heavy Support zone($61,100_$58,700) breaks, we can confirm the end of wave 4.
Before concluding, let's take a look at the Market Cap USDT Dominance% (USDT.D%) chart.
USDT.D% has managed to break the Important Downtrend line , and this indicates the increase of USDT.D% and possibly the break of the Resistance zone(5.54%_4.97%) in the following days, which also confirms the fall of Bitcoin .
I expect Bitcoin to attack the Heavy Support zone($61,100_$58,700) again after the completion of the microwave 4 of the main wave 3, and the break of the Heavy Support zone can coincide with the news of the refund of the Mt.Gox exchange .
Note: If Bitcoin can break the Resistance zone($63,450_$62,100), the scenario will change.
Note: An important point you should always remember is capital management and lack of greed.
Bitcoin Analyze (BTCUSDT), 4-hour time frame ⏰.
Do not forget to put Stop loss for your positions (For every position you want to open).
Please follow your strategy; this is just my Idea, and I will gladly see your ideas in this post.
Please do not forget the ✅' like '✅ button 🙏😊 & Share it with your friends; thanks, and Trade safe.

#BTC/USDT Critical point. Emergency Update!#BTC needs to break and close above the 100EMA on the daily chart. Keeping it straightforward: until this occurs, the price may target the liquidity below $60k. This is not an opinion, just what the charts indicate!
The rejection in altcoins is concerning.
While I'm not bearish, BTC is currently at a critical juncture. This is the right time for the bulls to step in!
This indicator has been highly effective in identifying local bottoms and tops.
Sooner or later, the market will rally for the final wave. Until that happens, be cautious with leverage and view these times as opportunistic for altcoins.
dyor, nfa
#Crypto
Do hit the like button and share your views in the comments section.
Thank you
#PEACE

BTCUSDT 1WBTC ~ Update
#BTCUSD Stay Calm. We are still talking bullish as long as we maintain this area.
We'll let you know when it's time to start selling.

Bitcoin BTCUSD Bullish Money Heist PlanMy Dear Robbers / Traders,
This is our master plan to Heist BTCUSD Market based on Thief Trading style Technical Analysis.. kindly please follow the plan I have mentioned in the chart focus on Long entry. Our target is Red Zone that is High risk Dangerous level market is overbought / Consolidation / Trend Reversal at the level Bearish Robbers / Traders gain the strength. Be safe and be careful and Be rich.
Note: If you've got a lot of money you can get out right away otherwise you can join with a swing trade robbers and continue the heist plan,
Loot and escape on the target 🎯 Swing Traders Plz Book the partial sum of money and wait for next breakout of dynamic level / Order block, Once it is cleared we can continue our heist plan to next new target.
support our robbery plan we can easily make money & take money 💰💵 Join your hands with US. Loot Everything in this market everyday

#Bitcoin low could be $54169, Here's Why!#Bitcoin monthly support is around the $56.5k level. We've been struggling to break the upper resistance of $73k.
The final wave is still due, so remain vigilant in the market.
The 9EMA on the monthly chart has been a reliable indicator for dips in the last couple of post-halving rallies.
The current price is at $54,169! Even if we reach that support level, not being positioned in BTC is riskier than being exposed to the market, so be thoughtful when making your decisions.
Remember, the market aims to bore you and kick you out.
Don't let them play with you.
WAGMI
Cheers, and don't forget to hit like and bookmark to stay updated.
#Crypto #BTCUSDT

Bitcoin (BTC): is local bottom achieved?The Bitcoin (BTC) price registered a sharp drop on Monday, falling to $60,330. The asset faced considerable selling pressure as sellers pushed the price as low as $58,474, shown by the long tail on the candlestick, indicating strong buying below $60,000. However, buyers were able to prop the price back above $60,000.
Analysts expect bulls to be quite active between $56,500 and $60,000. This is because if BTC falls below this level, we could see a slide down to $58,000, where the 200-day SMA could prop up the price. If this level is breached, BTC could drop to $55,000.
As seen in the price chart, BTC has strong support at $60,000. This support held on Monday, and BTC made a relatively strong recovery on Tuesday, rising by 2.52% and moving to $61,848. Buyers attempted to push BTC above $62,000, with the price reaching a day high of $62,458 before dropping to $62,458. Wednesday saw sellers back in control as BTC dipped below $61,000, dropping to $60,854 after a drop of 1.61%. The current session sees BTC up marginally as buyers and sellers look to assume control of the session. Looking at technical indicators, we can see the RSI is close to the oversold region, which could indicate a bullish reversal in the near future.
If BTC is able to recover, It will first target the $62,000 level. Should BTC surpass this level, we could see a climb to $65,000, which is a key resistance level. If Bitcoin is able to break and close above $65,000, we could see a rally to $70,000.

BTCUSD 1WBTC ~ Updated
#BTC So far so good. price closed above $59k.
BITSTAMP:BTCUSD Need to maintain this support. losing this support we need to make a bear plan. This is an accumulation area for maximalist bulls.

BTCUSDT likely to be rejected from daily resistance around 64.5kThe price has dropped significantly once rejected from weekly resistance WR1. Now it has bounced from weekly support WS1 and now on the way to daily resistance DR1. I believe the price will struggle at DR1 and will be rejected towards 4HS1 at least. And therefore, this short trade idea if the price reaches towards DR1. Lets see if price manages to reach there and fill our orders. By the way, keep in mind, the price has broken important support and structures so it is full in bearish mode.

BTCUSDT - one n only area, what's next??#BTCUSDT. what a move from 66400 as we discussed in our last idea and congratulations to all followers.
We already discussed about 64450 in our last couple of ideas, you can check our last ideas about btcusdt.
So guys that level have much importance on chart specially in weekly and daily chart if you can see.
So keep close that level 64450
If market clear that level then you can see a smoothly drop a d it will leads you towards 62k , 60k n up to 58k
Don't be lazy here.
Good luck
Trade wisely

Bitcoin RSI has dipped below 30.Bitcoin Technical Analysis Update
In the past, when Bitcoin's daily chart RSI drops below the 30 level on the daily chart, we often see an upward move in Bitcoin's price from that level. It is considered a bottom for Bitcoin in that trend.
Currently, Bitcoin's daily chart RSI has dipped below the 30 level. This could be considered a bottom for Bitcoin, and we can expect an upward move from the current level.
Regards
Hexa

BTC to 53k?As we know BINANCE:BTCUSDT couldn't break old High which is at 73750, now trading at 61k. I was focusing at 61k-63k range to look LONG-FUTURES trade but looks like BINANCE:BTCUSDT is shifted other way and much possible to check 53k area. There is a valid Order Block zone between 57k-59.5k. But as I mentioned earlier BINANCE:BTCUSDT more likely to hit 53k in coming days. Don't worry even BINANCE:BTCUSDT hit 53k we are still in bull market!
I will consider LONG-FUTURES trade around 53k. Will do update on entry and take profits!

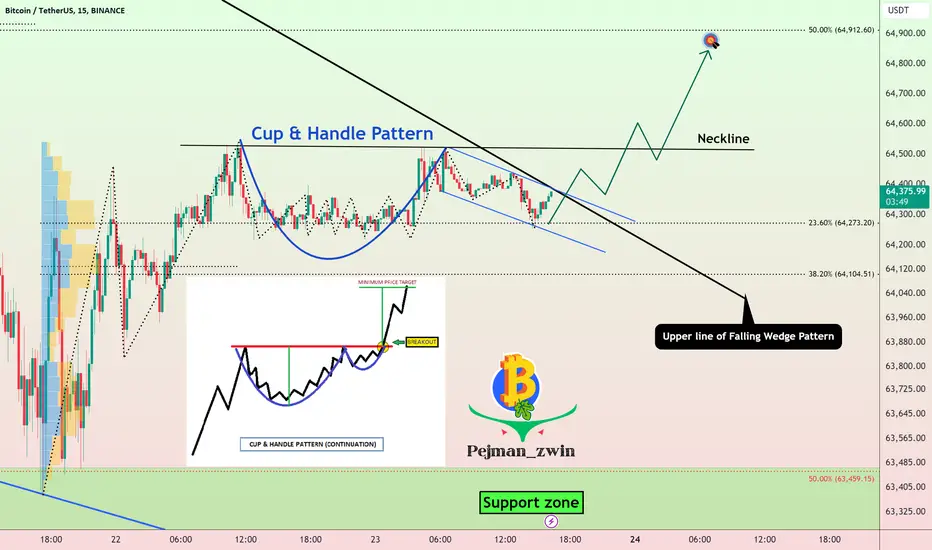
Bitcoin Analysis==>>Cup & Handle PatternBitcoin is moving near the upper line of the Falling Wedge Pattern .
In terms of Classic Technical Analysis , it seems that Bitcoin has succeeded in forming a Cup & Handle Pattern . ( continued pattern )
After breaking the neckline, I expect Bitcoin to rise to at least the target I've specified on the chart.
Note: An important point you should always remember is capital management and lack of greed.
Bitcoin Analyze (BTCUSDT), 15-minute time frame ⏰.
Do not forget to put Stop loss for your positions (For every position you want to open).
Please follow your strategy; this is just my Idea, and I will gladly see your ideas in this post.
Please do not forget the ✅' like '✅ button 🙏😊 & Share it with your friends; thanks, and Trade safe.
Bitcoin: Will Low Volume Push Price to $61,000?Bitcoin (BTC) has lost momentum over the past two days, raising concerns among analysts, and traders. The leading cryptocurrency is currently trading sideways, lacking the strong volume needed to break through key resistance levels.
Low trading volume often precedes price dips, and if we don't see a surge in buying pressure soon, we could see Bitcoin revisit the $61,000 area.
The $63,000 price point has proven to be a significant hurdle for Bitcoin in recent weeks. Without a significant increase in trading volume, I believe a price correction towards the $61,000 support level is a strong possibility.

BITCOINBitcoin analysis
Time frames of 1 hour and 4 hours
Bitcoin is above its 1-hour and 4-hour support and is worth buying trades. If you see the confirmation in the time frame of 5 and 15 minutes, you can enter the purchase transactions.

Bitcoin Analysis==>> FallingBitcoin once again started to react strongly after entering the Resistance zone($73,800_$71,900) . Although it tried to break this zone😊.
According to the Elliott wave theory , Bitcoin seems to have succeeded in completing the Main wave 5 .
In the chart, we can also see the Sell signal between 50_SMA(Daily) and 100_SMA(Daily) (it is a Bearish sign ).
Also, we can see the Regular Divergence(RD-) between two Consecutive Peaks .
I expect Bitcoin to continue falling at least to My targets .
Note: An important point you should always remember is capital management and lack of greed.
Bitcoin Analyze (BTCUSDT), 4-hour time frame ⏰.
Do not forget to put Stop loss for your positions (For every position you want to open).
Please follow your strategy; this is just my Idea, and I will gladly see your ideas in this post.
Please do not forget the ✅' like '✅ button 🙏😊 & Share it with your friends; thanks, and Trade safe.

Bitcoin Roadmap==>>FallingBitcoin is breaking the Important Support line .
According to Elliott's wave theory , Bitcoin seems to be completing wave 4 .
I expect Bitcoin to fall at least to the Potential Reversal Zone(PRZ) and attack the Support zone($65,730_$64,240) .
Note: An important point you should always remember is capital management and lack of greed.
Bitcoin Analyze (BTCUSDT), 15-minute time frame ⏰.
Do not forget to put Stop loss for your positions (For every position you want to open).
Please follow your strategy; this is just my Idea, and I will gladly see your ideas in this post.
Please do not forget the ✅' like '✅ button 🙏😊 & Share it with your friends; thanks, and Trade safe.

#BTC sitting on a thread! This is what you need to know!#Bitcoin is sitting around $66,306.30, flirting with the 50-day moving average, a critical line in the sand.
We've got solid support at $65,551 and resistance up at $71,452, So watch for a break below $65,551 for a potential drop to $60,364 or $57k. Volume's low, signalling consolidation.
If BTC holds above the 50-day MA, a push towards $71,000 is on the cards. Eyes on the breakout or breakdown.
Enjoy your weekend.
I'll be here if anything important comes up.
Have a great time!
Do hit the like button if you like my updates and share your views in the comment section.
#PEACE

BTCUSDT: Heading towards $82,000Dear Traders,
Price is currently making correction in daily timeframe, in our view price can drop to 62k to 63k region where we can see strong bullish pressure coming in the market. However, it is also notable that price can just reverse from the current price area that it is trading at, as price already have been dumped once to 54k and there is no strong reason that it would drop to 63k region.
*If you agree with the idea then like and comment, please follow if you want to support us**
Team Setupsfx_
