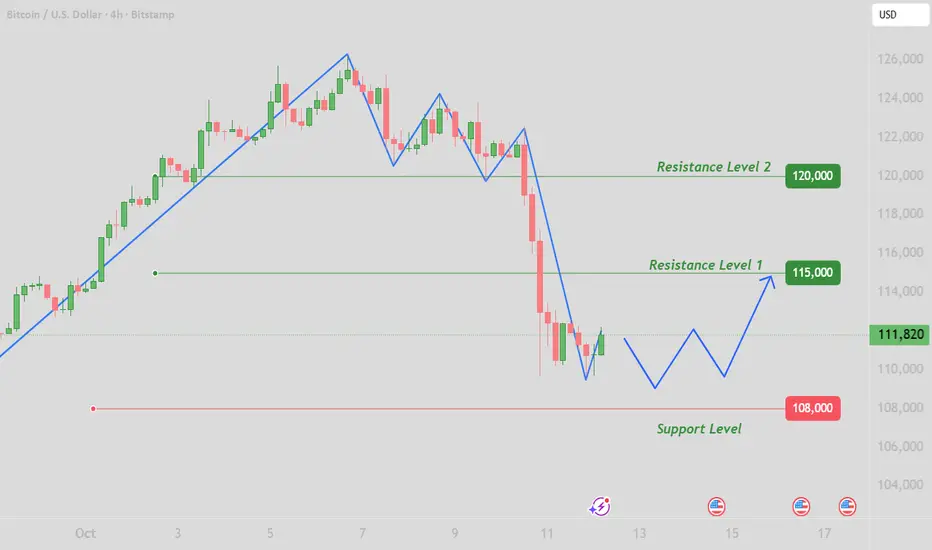
BTC: Oscillate and ConsolidateAlthough BTC rose in oscillations today, it encountered resistance near 112,500 and failed to break through after several attempts. This position has gathered a certain number of trapped orders and active sell orders, forming a short - term resistance range. If the bulls can gather enough strength to break through the 112,500 with increased volume, the upward space will be opened, and the price may further challenge the resistance levels of 115,000 or even 120,000.
However, due to the sharp decline in the early stage, the market sentiment is still relatively fragile, and investors are generally cautious. From a technical point of view, Bitcoin is likely to continue to oscillate and consolidate in the range of 108,000 - 115,000 today, and the long and short sides compete around key levels.
Btcusdtanalysis

BTCUSDBTCUSD has dropped heavily last week and could be potentially completing triangle for another push to start very soon.
Disclosure: We are part of Trade Nation's Influencer program and receive a monthly fee for using their TradingView charts in our analysis.

BTC: Oscillating to build a bottomOver the weekend, after a sharp decline in the early stage, the Bitcoin price is currently in a shock - bottoming phase. In the early stage, the short - selling force was strong, pushing the price down rapidly. However, over the weekend, the price fluctuation range gradually narrowed, indicating that the strength of the long and short sides tends to be balanced in the competition, and the market is looking for a short - term direction.
Although Bitcoin rose in oscillations today, it encountered resistance near 112,500 and failed to break through after several attempts. This position has gathered a certain number of trapped orders and active sell orders, forming a short - term resistance range. If the bulls can gather enough strength to break through the 112,500 with increased volume, the upward space will be opened, and the price may further challenge the resistance levels of 115,000 or even 120,000. However, due to the sharp decline in the early stage, the market sentiment is still relatively fragile, and investors are generally cautious. From a technical point of view, Bitcoin is likely to continue to oscillate and consolidate in the range of 108,000 - 115,000 today, and the long and short sides compete around key levels.
Buy 108000 - 110000
TP 113000 - 115000
SL 106000
Daily-updated accurate signals are at your disposal. If you run into any problems while trading, these signals serve as a reliable reference—don’t hesitate to use them! I truly hope they bring you significant assistance
ElDoradoFx PREMIUM 2.0 – WEEKEND BTCUSD ANALYSISBTC is trading around 111,600, recovering after last week’s sharp correction from 126,000.
Price is forming higher lows from 109,500, suggesting a short-term bullish correction while overall structure remains bearish.
⸻
🔍 Technical Outlook
Daily Structure (1D):
BTC is holding above the 200 EMA / major demand zone (107,700–108,800).
Momentum indicators (MACD + RSI) show early recovery — buyers stepping in after the deep retracement.
Trend is still bearish, but a clean push above 112,500–113,000 would confirm a short-term CHoCH bullish shift.
The Fibonacci retracement (126,000 → 107,200) marks the Golden Zone at 116,600–118,400, still the ideal swing-sell region.
Intraday (1H + 15M + 5M):
Charts show a clear bullish order block (OB) around 110,200–111,000 and a bearish OB above 112,800–113,200.
Fair Value Gaps (FVGs) remain unfilled near 112,400–113,000, likely short-term targets.
Market structure: forming Higher Lows (HLs) with momentum building on the MACD and RSI across lower timeframes.
Short-term bias: bullish correction until resistance confirms rejection.
⸻
📌 Breakout Levels to Continue Trend
Bullish continuation:
• Break above 111,800, retest 111,400–111,600 → upside path 112,400 → 113,200 → 114,000
• If price continues, next resistance aligns at 116,600–118,400 (Golden Zone)
Bearish continuation:
• Break below 110,200, retest 110,400–110,600 → downside path 109,200 → 108,000 → 106,800
• Clean close below 108,800 confirms daily bearish trend resumption
⸻
📅 Fundamental Watch
No major weekend data.
Sunday CME gap (109k–111k) could attract liquidity before Monday’s open.
Upcoming U.S. CPI next week will define the next strong directional move in BTC and risk assets.
⸻
⚠ Key Levels to Monitor
Resistance zones:
111,800 / 112,400 / 113,200 / 116,600 / 118,400
Support zones:
110,200 / 109,200 / 108,000 / 107,700 / 106,800
⸻
✅ Summary
BTC is consolidating inside a bullish order block, with momentum building toward 112.8k–113.2k, where a major bearish OB + FVG confluence exists.
A break and retest above 111,800 could extend the recovery to 113k–114k, while failure below 110,200 would reopen the path to 108k–106.8k.
Main trend remains bearish, but short-term correction likely continues before sellers regain control near the Golden Zone (116.6k–118.4k).
— ElDoradoFx PREMIUM 2.0 Team

After a strong downward movement, the price has formed a base anAfter a strong downward movement, the price has formed a base and is now showing signs of upward momentum. The chart suggests a long trade setup, with clear targets at 113,052 (Target 1) and 114,037 (Target 2), while maintaining a stop loss around 111,000.

BTC:Flash crashToday Bitcoin suffered a "flash crash", plummeting by over 13% in the early hours and falling below the $110,000 mark, which triggered forced liquidations for more than 1.6 million traders.
The core market situation can be summarized as leverage-driven cascading liquidations led by policy negatives. While short-term volatility has intensified, long-term key factors remain unchanged. Before the crash, Bitcoin’s leverage ratio soared to 50x, and high-leverage trading was prevalent among retail investors. Price fluctuations triggered forced liquidations, amplifying the decline.
We judge that the 103,000 level and the psychological threshold of 110,000 serve as crucial short-term support levels. If the price breaks below 100,000, a deeper correction may be triggered.
The Federal Reserve’s October interest rate decision, the progress of the U.S. government shutdown, and the follow-up developments of Trump’s trade policies will become core variables in the next phase.

BTC:Performance Recap for the weekThis week, the Bitcoin market witnessed an extreme price movement characterized by "a frenzy-driven rally – panic-induced volatility – a cliff-like crash", with a weekly volatility of 21.3%, marking the most drastic fluctuation record since 2025. Market sentiment oscillated repeatedly between greed and fear, and the trend can be specifically divided into three phases:
Monday: A momentum-driven rally to a phased peak
Tuesday to Wednesday: The first pullback after hitting a new high
Thursday to Friday: A black swan event triggering a crash-like decline
We judge that the 103,000 level (this week’s low) and the psychological threshold of 110,000 serve as crucial short-term support levels. If the price breaks below 100,000, a deeper correction may be triggered. The Federal Reserve’s October interest rate decision, the progress of the U.S. government shutdown, and the follow-up developments of Trump’s trade policies will become core variables in the next phase. Uncertainties surrounding geopolitics and macro policies may continue to intensify market volatility.

ElDoradoFx PREMIUM 2.0 – Weekend BTCUSD AnalysisBTC is trading around 110,200, after a sharp 12,000-pip correction from the recent 126,000 high.
This week’s movement confirms a bearish structure shift, driven by heavy liquidation and macro profit-taking after the extended bull leg.
⸻
🔍 Technical Outlook
📅 Daily Structure (1D):
• BTC broke below the 115,000 key support and is now testing the ascending trendline support near 108,800–107,700 (the previous swing-low region).
• The daily candle shows a long lower wick, signaling potential demand re-entry, but momentum remains weak.
• The 200-EMA (yellow) around 107,700 is critical — a close below would confirm a mid-term bearish reversal.
• MACD shows a strong bearish crossover with fading histogram strength, indicating decelerating bearish pressure.
• RSI has cooled to the 35–38 zone, approaching oversold — supporting a possible short-term rebound.
🎯 Fibonacci Golden Zone:
The retracement from the swing low (107,200) to the previous swing high (126,000) places the Fibonacci Golden Zone (61.8%–50%) between 112,000–114,500.
This zone will likely act as the first major resistance on any pullback.
If price retests this area and rejects, it offers a high-probability short continuation opportunity.
⸻
📈 Intraday Structure (1H + 15M + 5M):
• 1H structure remains bearish, with continuous Breaks of Structure (BOS) toward new lower lows.
• Short-term consolidation is forming around 110,000–110,500, right above the daily support zone.
• 15M and 5M charts show small bullish divergences on RSI and MACD, suggesting a possible technical bounce before continuation.
• 50EMA and 100EMA on intraday remain above price — still confirming short-term downtrend dominance.
• The current compression could lead to a small retracement toward 111,800–112,400, which aligns with the Fib retracement zone and intraday supply.
⸻
📌 High-Probability Entry Zones (≤600-pip SL)
🔴 SELL (Trend Continuation)
• Entry: 111,800 – 112,400 (Fib 50–61.8% zone)
• SL: 113,000
• TP1: 110,000
• TP2: 108,800
• TP3: 107,300 (200-EMA / Daily demand)
Bias: Short from retracement back into structure resistance & EMAs alignment.
🟢 BUY (Short-Term Reversal Play)
• Entry: 108,800 – 109,200 (demand & trendline)
• SL: 108,200
• TP1: 111,200
• TP2: 112,000 (Fib zone)
Bias: Only valid if RSI stays above 35 and MACD histogram flips green — scalp reversal before trend resumes.
⸻
📅 Fundamental Watch
• Weekend liquidity remains low — avoid chasing false breakouts.
• No major macro events until Monday, but watch CME Futures Gap risk between 109k–111k.
• U.S. CPI data from earlier in the week reinforced stronger USD; risk appetite still fragile — BTC sensitive to Dollar Index movements.
⸻
⚠ Key Levels to Monitor
Resistance: 111,800 / 112,400 / 114,500 / 116,500
Support: 109,200 / 108,800 / 107,700 / 106,800
⸻
✅ Summary
BTC remains in a bearish correction phase below 114,000 after failing to hold structure.
A pullback to 111,800–112,400 could offer the best short opportunity (sell-the-rally setup).
If bulls defend 108,800, expect a technical bounce back to 112k before another drop.
Below 107,700 = full bearish continuation toward 105,000,
while reclaiming above 114,500 = short-term bullish recovery.
— ElDoradoFx PREMIUM 2.0 Team
⸻
🥇 ElDoradoFx PREMIUM 2.0 – PERFORMANCE 10/10/2025 🥇
📊 MARKET RECAP:
🔻 SELL 🔴 +50 pips
🔻 SELL LIMIT 🔴 +20 pips
❌ SELL 🔻 –95 pips (SL)
🔻 SELL 🔴 +210 pips
🟢 BUY 🟩 +110 pips
🟢 BUY 🟩 +200 pips
🔻 SELL 🔴 +40 pips
---
🏆 GOLD TOTAL PIPS WON: +535 pips
📊 RESULT: 7 Signals → 6 Wins | 1 SL
🎯 ACCURACY: 86 %
---
🔥 Another strong trading day!
Controlled risk, solid entries, and consistent results 💪📈
👏 Congratulations if you profited ✅✅✅🚀🚀🚀

Bitcoin's drop, opportunity in disguise?Yesterday’s move took me by surprise.
I’ve been bullish on BTC and many altcoins, and without looking for excuses, I didn’t expect what happened last night (mine). The new tariff threats from Trump hit the markets like a hammer, triggering a sharp crypto selloff.
So, the question is — is this the start of a more meaningful drop, or actually an opportunity in disguise?
Looking at Bitcoin’s chart, price broke below the key 118k support zone, almost touching 108k, which I consider the real line in the sand.
In my opinion, bear markets don’t start like this. This drop looks more like a liquidation event — a clean sweep that flushed out weak hands and overleveraged positions.
If BTC dips under 110k again, I’ll be watching closely for buying opportunities. In the short term, at least a recovery toward 118k seems quite probable.

BTC: Range trading & event-driven tradingToday's BTC market demonstrates the dual characteristics of "rallying and then pulling back and range-bound fluctuation". In the short term, it will most likely remain in a range-bound state, and the probability of breaking out of the range before the option expiry is relatively low.
If the U.S. Dollar Index breaks below 99.2, BTC is expected to move upward to test the resistance level; if whales show signs of closing long positions, it may continue to decline.
Given that whales' 40x highly leveraged positions may trigger liquidity squeezes, it is recommended that retail investors limit their leverage ratio to no more than 5x and avoid chasing longs above 121,800.
Based on the current market conditions, it is advisable to adopt a composite strategy of "range trading & event-driven trading".
Buy 120500 - 121000
TP 121500 - 122000
SL 120000
Daily-updated accurate signals are at your disposal. If you run into any problems while trading, these signals serve as a reliable reference—don’t hesitate to use them! I truly hope they bring you significant assistance

BTC: In a weak consolidationCurrently, BTC is in a weak consolidation phase following a pullback. After touching an intraday low of 120,804.39, it rebounded sharply, indicating that the 120,800-121,000 range has short-term buying support. This level is close to the upper edge of the previous consolidation platform at 120,500 and forms a joint support zone with the key concentrated price level of 120,000 in the options market. However, the current price of 121,000 is still on the edge of the support level, and no clear stabilization signal has been formed yet.
Buy 120000 - 120500
TP 121000 - 121500 - 122000
SL 119500
Daily-updated accurate signals are at your disposal. If you run into any problems while trading, these signals serve as a reliable reference—don’t hesitate to use them! I truly hope they bring you significant assistance
BTC: Three-stage trajectorToday's BTC market shows a pattern of high-level consolidation with a pullback, characterized by a three-stage "surge - retracement - consolidation" trajectory. In the early session, it attempted to break through the 124,000 resistance level but failed. Subsequently, it pulled back to around 121,000 to seek support, and later, a bull-bear tug-of-war unfolded within the 122,000 range.
Close attention should be paid to the October 15 deadline for the U.S. government shutdown (Polymarket predicts a 56% probability of it lasting until that date). If the shutdown is extended, leading to further delays in ETF approval, Bitcoin may retrace below 120,000, and in extreme cases, test the support level at 118,000.
The current market is suitable for a "low-leverage + position-splitting strategy": Holders can set 121,000 as the trailing stop level. Given that the current support level has moved upward and trading volume has not contracted, the stop-loss range can be appropriately widened. On the other hand, observers may wait for the price to stabilize above 123,600 or for signs of stabilization with reduced volume after retracing below 120,500 before considering entry, avoiding chasing gains or selling in a panic within the consolidation range.
Buy 121000 - 121500
TP 122000 - 122500 - 122300
SL 120000
Daily-updated accurate signals are at your disposal. If you run into any problems while trading, these signals serve as a reliable reference—don’t hesitate to use them! I truly hope they bring you significant assistance
#Bitcoin Weekly Update !!#BTC UPDATE
#Bitcoin has printed a new weekly high, confirming the ongoing strength of the broader uptrend. Both the 21 EMA (yellow) and the 55 EMA (green) are trending upward, indicating that medium-term momentum remains bullish.
The key structural level to focus on is the former weekly resistance around $120,000, which Bitcoin has successfully broken above. As long as the price holds above this level on a closing basis, the bullish bias will remain intact.
If the breakout holds, the next potential target lies in the mid-$130K range.
However, if Bitcoin closes below $120,000, the move would be neutralized, potentially opening the door for a retest of the EMAs in the $112K–$114K zone.
For now, both the trend structure and EMAs suggest that the continuation of this bullish trend is likely.
BTC:Caution should be exercisedIn early trading today, Bitcoin briefly surged to a high level before plunging sharply, and finally stabilized with fluctuations around the 122000 mark.
The 125000-126000 range is a cluster of previous highs, is rife with a large number of trapped positions and profit-taking positions. Sustained expanded trading volume is required to achieve an effective breakthrough, and it will be quite challenging to break through in the short term.
Caution should be exercised regarding the impact of factors such as a leverage liquidation wave, a policy shift at the Federal Reserve's December FOMC meeting, and increased volatility amid the high valuation of global cryptocurrencies on the trend.
Buy 121100 - 121500 TP 122000 - 122500 - 123000
Daily-updated accurate signals are at your disposal. If you run into any problems while trading, these signals serve as a reliable reference—don’t hesitate to use them! I truly hope they bring you significant assistance
Bitcoin - The path remains clearly bullish!💰Bitcoin ( CRYPTO:BTCUSD ) remains bullish either way:
🔎Analysis summary:
For the past 1.000 days, Bitcoin has simply been heading higher. Considering that the previous bullruns lasted about 800 days, Bitcoin is ready for a correction. But market structure tells us, that Bitcoin remains bullish, even if we see a short term correction in the near future.
📝Levels to watch:
$50.000, $1.000.000
SwingTraderPhil
SwingTrading.Simplified. | Investing.Simplified. | #LONGTERMVISION

#BTC UPDATE!CRYPTOCAP:BTC is currently breaking below the 1H uptrend line, showing early signs of weakness.
If we get a confirmed 1-hour candle close below this trendline, short setups could come into play.
The first key support sits around $123,200, with the next major demand zone near $119,415.
For now, the focus is on how this hourly candle closes. A strong rejection could push BTC back above $124,474, but a confirmed breakdown would likely shift short-term momentum to the bearish side.
DYOR, NFA
CRYPTOCAP:BTC BITSTAMP:BTCUSD BINANCE:BTCUSDT
#Crypto

#BTCUSDT: Two Areas To Buy Swing, Same Target $150KDear traders,
We are resuming publication here on TradingView. If you agree with our insights, consider liking and commenting on the idea.
Let’s focus on Bitcoin. Its price has rallied since the last two weeks, showing extreme bullish volume in the market. This is mainly due to fear of negative fundamentals in the US economy, which is showing a lack of trust in the US Dollar. As traders and investors seek alternatives to the US Dollar, the main two prospects that look promising are Gold and Bitcoin.
So, what’s next? We think there are two possible buying areas where the price could reverse. The first is at a minor correction, and the second is a major correction. However, we believe the minor correction looks more promising at the current market conditions, while the major corrections would require fundamental intervention. Both present good opportunities.
This is our view only, and it doesn’t guarantee that the price will follow our predictions. Do your own analysis and research before making any decisions. We thank each of you for your support throughout and expect it to continue.
Much Love and Regards,
Team Setupsfx_

Want to Trade Like a Pro? This BTC Layer Strategy is Your Answer🚀 Become a Pro Trader: The "Thief" Layer Strategy for BTC/USDT (Bullish Swing Plan) 🚀
Unlock a professional money-making operation! This detailed plan combines a unique entry technique with deep fundamental & sentimental analysis to give you an edge.
📈 Trade Idea: BTC/USDT (Swing / Day Trade)
Bias: Bullish | Timeframe: 4H - 1D
🎯 The "Thief" Layer Entry Strategy
This strategy "steals" good entries at various levels instead of chasing the market.
Entry Method: Multiple Buy Limit Orders (Layering)
Proposed Entry Zones: $111,000 | $111,500 | $112,000 | $112,500
You can add more layers based on your capital and risk appetite.
⛔ Stop Loss (Risk Management)
Hard Stop Loss: $110,000 (Below key support)
⚠️ IMPORTANT NOTE (Thief OG's): This is MY stop loss. You MUST adjust your SL based on your personal risk management strategy. Protect your capital first.
🎯 Take Profit (Exit Strategy)
Primary Target: $116,000 (Strong Resistance + Overbought Zone)
The Plan: Escape with "stolen" profits before any potential trap snaps shut!
⚠️ IMPORTANT NOTE (Thief OG's): This is MY target. You are free to take profit earlier or adjust based on your own analysis. Secure your bags!
🔍 Why This Plan? The "Thief's" Analysis
This trade setup is backed by a confluence of technical, fundamental, and sentimental factors.
📊 Technical & Sentimental Backdrop (As of Sept 9, 2025)
Price Action: BTC showed strength with a +1.52% gain, bouncing from the $111,184 support.
Market Sentiment (Fear & Greed Index): 48/100 (Neutral) 😐. This indicates a balanced market with no extreme fear or greed—often a good base for a move.
Retail vs. Institutional:
Retail Traders: 55% Long (Slightly Bullish) 🤔. Fueled by Fed rate cut expectations.
Institutional Traders: 60% Short (Cautiously Bearish) 🏢. Their selling pressure appears to be exhausting, as shown by declining volume on dips. This creates a contrarian opportunity.
🌍 Fundamental & Macro Tailwinds
The $7.26T Cash Pile: Money market funds are holding a massive $7.26 Trillion. A Fed rate cut could unleash this capital into risk assets like Bitcoin. 🏦
Fed Rate Decision: An expected 25-50 bps cut is highly bullish for crypto, potentially triggering a major rotation.
Strong Bitcoin Fundamentals:
Low Inflation Rate: Only 1.17% (low new supply pressure). ✅
Network Health: Active addresses and settlement volume remain stable (~$12.9B/24h).
Dominance: BTC is outperforming traditional safe havens like gold (+102% YoY vs. gold's +42%).
✅ Overall Outlook Score
Bull (Long) Score: 55/100 → Neutral-Bullish 🐂
Bear (Short) Score: 45/100 → Weak Bearish Pressure 📉
🎯 Final Thief's Outlook: Cautiously optimistic. The layered entry strategy allows us to capitalize on potential upside driven by macro factors while strategically managing risk.
👀 Related Pairs to Watch
BINANCE:ETHUSDT | BINANCE:SOLUSDT | BINANCE:BNBUSDT (Altcoins follow BTC's lead)
TVC:DXY (U.S. Dollar Index) | CBOE:SPX (S&P 500)
✨ “If you find value in my analysis, a 👍 and 🚀 boost is much appreciated — it helps me share more setups with the community!”
#BTC #Bitcoin #Trading #Strategy #LayerStrategy #SwingTrading #Cryptocurrency #TechnicalAnalysis #FundamentalAnalysis #ThiefStrategy

BTCUSDBTCUSD needs correction and further upside to break the ATH again.
Disclosure: We are part of Trade Nation's Influencer program and receive a monthly fee for using their TradingView charts in our analysis.

Bitcoin Swing Trade Setup – Institutional Inflows Fuel Bulls🎭 BTC/USD – Money Heist Plan 🚀 (Swing + Scalping Strategy)
📊 BTC/USD Real-Time Market Data
Current Price: $111,156.01
24h Change: +$2,117.61 (+1.94%)
Day’s Range: $108,540.93 – $111,180.45
52-Week Range: $49,538.00 – $123,640.00
😰 Fear & Greed Index
Score: 49/100 → Neutral 😊
Trend: Shifted from “Fear” to “Neutral” in the last 24 hours.
🧠 Investor Sentiment Outlook
Retail Traders: Cautious (63% worry about crypto safety).
Institutional Traders: Bullish (💵 $3.7B net inflows in August).
🌍 Fundamental & Macro Score
Policy Uncertainty: High (U.S. tariffs, Fed policy shifts).
Fed Rate Cut Probability: High (expected September cut).
Key Event: Non-Farm Payrolls (Sept 5; forecast 45K jobs).
Gold Rally: $3,508/oz (+30% YTD, strong hedging demand).
🐂 Market Outlook
Short-Term: Neutral → Slightly Bearish (September volatility ahead).
Long-Term: Bullish (Institutional inflows + macro liquidity).
Bull/Bear Score: 55% Bullish vs 45% Bearish.
🎯 Thief’s Trading Plan (Layered Entry Strategy)
I’m setting up multiple limit orders (“Thief Layers”) instead of going all-in — this spreads risk, builds better entries, and keeps flexibility.
Entry (Layered Buys):
$109,000 → $109,500 → $110,000 → $110,500
(Add more layers as per your own strategy)
Stop Loss (Thief SL):
$107,500 (Adjust for your own risk appetite)
Target Zone (Profit Extraction):
$116,000 (Checkpoint before major resistance zone)
💡 Key Takeaways
BTC rebounded +1.94% but faces headwinds from whale profit-taking & policy risks.
Neutral sentiment (49/100) reflects a balanced investor mood.
Friday’s NFP jobs data could shape Fed rate expectations → big volatility catalyst.
🔍 Related Pairs to Watch
BITSTAMP:ETHUSD | COINBASE:SOLUSD | BITSTAMP:XRPUSD | BINANCE:BTCUSDT | CRYPTOCAP:BTC.D
#BTCUSD #Bitcoin #CryptoTrading #SwingTrade #Scalping #TradingStrategy #LayeredEntries #CryptoCommunity
✨ “If you find value in my analysis, a 👍 and 🚀 boost is much appreciated — it helps me share more setups with the community!”

ElDoradoFx PREMIUM 2.0 – Weekend Bonus BTCUSD Analysis 04/10/25
BTC is trading around 122,280, consolidating after an explosive rally of over +11,000 pips from the 110,600 demand zone. After a strong bullish impulse, momentum is slowing as price hovers near short-term resistance.
⸻
🔍 Technical Outlook
Daily (1D):
BTC printed a massive bullish breakout from the descending channel, rallying from 110,600 to 123,800 before facing rejection at 123,900 — a previous structural high and psychological resistance.
• MACD: strong bullish momentum but starting to flatten, suggesting exhaustion.
• RSI: near 70, indicating overbought conditions.
• Parabolic SAR: still below price (bullish bias intact).
→ The daily structure remains bullish, but pullbacks are likely before continuation.
Intraday (1H):
Price is forming a short-term range between 121,950–122,900.
• The 200 EMA (white) is below price at 120,800, confirming ongoing bullish structure.
• However, MACD histogram shows decreasing buying volume and potential cross to the downside → early sign of correction.
• RSI hovering around 55–60, neutral zone → consolidation after high volatility.
Short-Term (15M / 5M):
BTC is showing lower highs while holding the 122,150–122,250 zone, building a potential bull flag.
• On the 15M chart, a small descending channel connects the highs at 122,790 → 122,460 → 122,300.
• 5M chart shows repeated liquidity sweeps below 122,180, followed by immediate rebounds → strong short-term demand.
Fibonacci Golden Zone (from swing low 120,779 → swing high 123,887):
Golden zone = 122,000–122,300 — BTC is trading exactly inside it now, offering a high-probability reload area for buyers if defended successfully.
⸻
📈 High-Probability Entry Zones (Max 60 pips SL)
🎯 Buy Setup (Fibonacci Golden Zone Support):
• Entry: 122,000–122,200
• SL: 121,900 (below structure)
• TP1: 122,600
• TP2: 122,900–123,000
• TP3 (extended): 123,800 (previous high)
→ Confluence: Fib Golden Zone + short-term EMA support + strong RSI defense.
🎯 Sell Setup (Short-Term Resistance Rejection):
• Entry: 122,850–123,000
• SL: 123,100
• TP1: 122,450
• TP2: 122,100
→ Only valid if price fails to hold above 122,850, confirmed by bearish candle structure on 15M.
⸻
📌 Breakout Levels to Continue Trend
• Bullish Continuation: Above 123,000–123,200 → momentum could extend into 123,900–124,400.
• Bearish Continuation: Below 121,900 → opens correction toward 121,200–120,800 (EMA + liquidity pool).
⸻
📅 Fundamental Watch (Weekend)
• No major events until Monday.
• Weekend liquidity is extremely thin, expect sharp stop hunts and sudden wicks.
• CME futures closed at 122,350 → small gap risk on Sunday open.
• Market sentiment remains cautiously bullish after strong week for risk assets.
⸻
⚠ Key Technical Zones
Resistance:
• 122,850 → 123,000 → 123,900 (major)
Support:
• 122,000 → 121,900 → 120,800
⸻
✅ Summary
BTCUSD is consolidating inside the Fibonacci golden zone (122,000–122,300) after a massive breakout week. The bias remains bullish while above 121,900, but momentum is slowing. Scalpers can buy dips within the golden zone for short-term 200–600 pip reactions. A clean breakout above 123,000 confirms bullish continuation, while a break below 121,900 triggers a correction toward 120,800.
— ElDoradoFx PREMIUM 2.0 Team

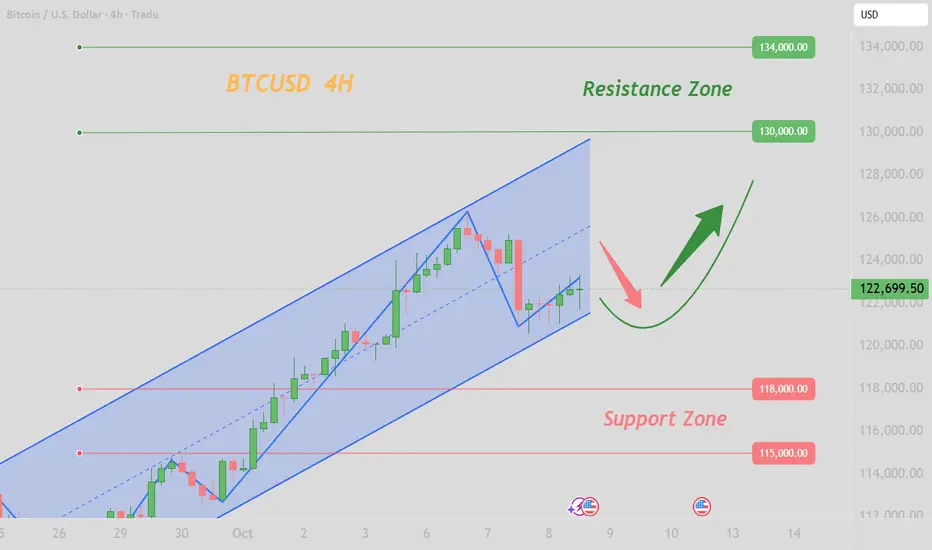
BTC/USD – Short Setup from Resistance Zone (Oct 2025 Analysis)Trend & Channel
The price has been moving inside an ascending parallel channel (highlighted in pink).
Current price is $122,395, approaching the upper boundary of the channel, where resistance typically appears.
Key Levels
Entry Point: Around $124,257 – suggested short-entry zone.
Support/Resistance Zone (Blue Box): Between $128,000 – $130,442. This is where rejection is expected.
Stop Loss: Above $132,000 – just outside the resistance zone to protect against a breakout.
Target Point: $104,097 – near the lower boundary of the channel, aligning with prior support levels.
Price Action Setup
The chart suggests a short trade setup (sell) if BTC/USD hits the $124K–$130K zone.
Expectation: After touching this resistance area, price could reverse downward toward the $104K target.
Risk-to-Reward Ratio
Risk: About $8,000 (132K - 124K).
Reward: About $20,000 (124K - 104K).
Approximate R:R = 2.5 : 1, which is favorable for a swing trade.
✅ Summary:
This is a bearish short-term outlook for BTC/USD. The strategy is to wait for price to reach the 128K–130K resistance zone, enter a short position, keep a stop loss above 132K, and aim for a target around 104K

BTC/USDT: Bullish Surge to 136K?BINANCE:BTCUSDT is gearing up for a bullish move on the daily chart , with an entry either from the current level or a pullback to the specified trendline .
The target at 136000 aligns with the next major resistance, signaling strong upside potential. Set a stop loss on a daily close below 108500 to manage risk effectively.
A break above 118000 with solid volume could trigger this surge, driven by market sentiment and BTC dominance. Watch key news! 💡
📝 Trade Plan:
✅ Entry: From current price or on a pullback to the trendline
❌ Stop Loss: Daily close below 108,500 to manage risk
🎯 Target: 136,000 (next major resistance)
Ready for this lift-off? Drop your take below! 👇
