BTC/USDT - The Calm Before the Storm - Breakout or Breakdown?Bitcoin is not simply moving sideways.
Price is currently compressed inside a critical technical structure, where buying and selling pressure is tightening aggressively. Historically, this type of compression often precedes a strong impulsive move.
After the sharp decline from the 126,000 area, BTC has entered a controlled consolidation phase within a falling wedge, while still trading below the major descending trendline. This is a decisive zone where the market chooses between reversal or continuation.
---
Current Market Structure
The higher-timeframe trend remains bearish, but selling pressure is weakening
Higher lows are forming, signaling early buyer participation
Volatility is shrinking → energy is being stored
Price is approaching the apex of the pattern, meaning a breakout decision is near
This is the market loading liquidity before the next major move.
---
Bullish Scenario — “Reversal Confirmation Zone”
If BTC:
Breaks and closes strongly above the descending trendline
Holds above 94,300
Shows expanding volume
Then:
The corrective phase is likely complete
Bearish structure starts to fail
A medium-term bullish reversal becomes highly probable
Upside targets:
99,000 → 103,000 → 107,000
A clean breakout could shift market sentiment from fear to confidence.
---
Bearish Scenario — “Continuation Trap”
If BTC:
Gets rejected again at the trendline
Loses the 90,300 support
Breaks down below the wedge structure
Then:
The consolidation becomes a bearish continuation pattern
Late buyers get trapped
The dominant downtrend resumes
Downside targets:
86,000 → 82,200 → potential retest of 80,500
---
Key Levels to Watch
94,300 – 99,000 → Breakout validation or fakeout zone
90,300 → Psychological mid-range support
86,000 – 82,200 → Final defensive demand zone
Price reaction at these levels matters more than any indicator.
---
Bitcoin is trading at a structural decision point.
This is not an area for FOMO — it is an area for confirmation.
➡️ Breakout = follow the trend
➡️ Breakdown = respect risk
Let price action do the talking.
---
#BTC #Bitcoin #BTCUSD #CryptoAnalysis #TechnicalAnalysis #PriceAction #FallingWedge #MarketStructure #CryptoTrading #SmartMoney
Btcusdtanalysis

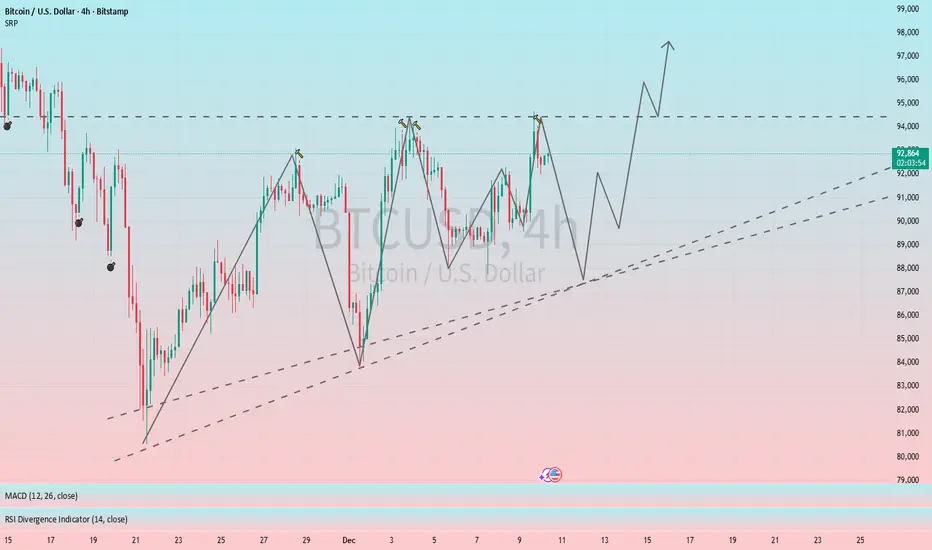
BTC Trade Set Up Dec 12 2025Price is making HH now i will want to see it sweep SSL to then make internal 15m-5m bullish structure to continue higher to BSL

BTCUSD Analysis - Major Supply Zone + Reversal1. Higher-Timeframe Context
BTC is currently trading inside a broad consolidation range after a strong impulsive leg to the upside followed by an equally sharp corrective decline. The market has created clear liquidity pockets both at the top and bottom of the range, suggesting price is hunting for inefficiencies rather than trending cleanly.
The current structure shows that BTC is in the middle of a retracement phase after rejecting the lower boundary of the range.
2. Impulse Move & Liquidity Grab
A significant vertical bullish impulse can be seen near the left side of the chart, creating a sharp displacement candle. This move broke short-term structure and left behind a clean imbalance.
After the rally, price failed to maintain directional continuation and rotated back lower, indicating the move acted more like a liquidity sweep rather than genuine trend continuation.
This is important because markets typically return to revisit these inefficient zones before deciding the next major direction.
3. Reversal Zone (Key Supply Area)
The highlighted green zone represents a high-probability supply area where:
Volume Burst: Indicates aggressive buy-side activity that may have come from late buyers or trapped longs.
Reversal Zone: This is the last major bearish origin block that caused the breakdown. Price re-entering this area signals a likely reaction.
A reaction here is expected because this zone contains both:
Unmitigated supply
Liquidity engineered above recent swing highs
This combination often creates a magnet for price and a turning point afterward.
4. Expected Price Behavior
Price is currently climbing back toward the Reversal Zone.
The chart suggests two possible scenarios:
Scenario A – Pattern Confirmation Before Short
Price taps the reversal zone, forms a bearish confirmation pattern (e.g., bearish engulfing, 2-candle reversal, break of intraday low), and begins trending downward.
This aligns with the diagram arrows showing rejection and continuation down.
Scenario B – Liquidity Grab Then Rejection
Price may wick slightly above the zone to collect liquidity, then sharply drop.
This is common behavior in areas with heavy wick rejections on history.
A clear message noted on the chart: “Need Pattern Here” – meaning that entries should only be attempted once the market shows clear reversal structure, not by blindly shorting the zone.
5. Short-Term Targets if Rejection Happens
If rejection confirms, potential downside targets include:
Return to mid-range
Retest of intraday support around recent consolidation
Lows near 90,800–91,200
Possible extension toward the range bottom if momentum increases
These levels are visible on the chart where previous structural lows were formed.
6. Market Psychology at This Zone
This area is important because:
Buyers who bought late in the impulse are trapped
Short sellers are waiting for optimal entries
Liquidity accumulates above swing highs
Institutions often push price into such zones to fill large orders
This creates a high-probability reversal environment, but confirmation is essential.

GET READY FOR BITCOIN HIGH PROBABILITY LONG SETUP SOON!!!🚨BTC HIGH PROBABILITY BUY SETUP 🚨
* Here We Can See Clearly The Next Potential Moves For BTCUSD Coming Hours/Days.
* Keep Your Eyes Close On Your Trading Positions.
* Happy PIP Hunting Traders.
FXKILLA.

BTCUSD: Bullish entry setup.Higher high and lower high shown in 1D chart. Long entry for bullish BTC. Long target 96875 at least.

BTC After the Flush: Building a Base Into 2026Bitcoin printed a clear correction from the 126,333 spot top into 80,625, a 36% retrace that finally reset an overheated trend. After that impulse down, price stopped bleeding and started building a base. That is the context for my long, not a breakout chase.
My first entry triggered at 85,000. If price sweeps lower, I will add, with my final planned entry sitting in the 72,000 to 70,000 region. The whole idea is simple: scale into higher time frame demand after a deep reset, then let the market do the work if it wants to rotate back into risk.
Technicals: on the daily, the selloff created an obvious “damage candle” sequence, followed by compression and range behavior. I am treating the 80K to 85K band as the core demand zone. The level that matters for confirmation is the recovery of the mid range resistance around 94,652, because a clean reclaim would shift the structure from “bounce” to “reversal attempt” and opens the door for a move back into the 100K area and, eventually, a retest of the prior ATH zone near 126K if momentum returns.
Fundamentals : the macro backdrop is supportive for risk if financial conditions keep easing. The Fed has already moved policy lower and continues to guide the market with forward projections, which is the type of environment that can reprice duration and high beta assets.  At the same time, institutional crypto flows have been rebuilding. CoinShares reported a rebound in digital asset ETP inflows with Bitcoin leading, and daily US spot Bitcoin ETF flow data has also shown positive net flows on recent sessions.  On derivatives, CME positioning and open interest remain a key dashboard for whether this base is being built with size behind it. 
Execution note: I am not trying to “be right” on the exact bottom. I am trying to be positioned where the risk is definable and the upside is asymmetric. If the narrative changes, I will adjust. If the market gives the move, I will pay myself and protect capital.
Note: Please remember to adjust this trade idea according to your individual trading conditions, including position size, broker-specific price variations, and any relevant external factors. Every trader’s situation is unique, so it’s crucial to tailor your approach to your own risk tolerance and market environment.

BTC Trade Secures 3800 pipsPrice swept external BSL which i expected price to pushdown to lower SSL which played out perfectly now i will want to see bullish structure from where its at or to come down lower to sweep SSL before continuing higher

BTCUSDT Bullish Reversal: Potential Move to Supply Zone at 93,58BTCUSDT has recently formed a strong low around 89,205, suggesting that the market could be preparing for a bullish reversal. The price has pulled back into the demand zone, offering a potential entry point for traders looking to capitalise on this move. This setup follows a break of structure (BOS) to the upside, indicating that the market may be shifting towards a bullish trend.
As the price approaches the demand zone, traders should closely monitor for any signs of confirmation, such as a bullish candlestick pattern or a significant increase in volume. These signals could provide the necessary confirmation that the market is ready to move higher. The strong low near 89,205 is expected to provide support, and a bounce from this level could push the price back towards higher levels.
The next key target for Bitcoin is the supply zone around 93,580, which represents a potential area of liquidity. Once the price enters this zone, it is important to monitor the price action for signs of rejection or continuation. If the price breaks through the supply zone, it could indicate further upside momentum. However, if the price fails to break through, a reversal could be expected, and traders should be prepared for potential pullbacks.
For those considering entering the market, it is crucial to wait for confirmation before placing any trades. Entering prematurely could expose traders to unnecessary risk, as the market could still reverse or consolidate. A well-timed entry at the demand zone with proper risk management strategies in place could yield positive results if the market continues to move higher.
In summary, BTCUSDT is showing signs of bullish potential after forming a strong low and pulling back into the demand zone. Watch for confirmation before entering, and use the supply zone at 93,580 as a key level to monitor for possible price rejection or breakout. Proper risk management is essential to navigate this setup and capitalise on potential price movements."

$BTC/USDT ANALYSISOn the 2-hour chart, BINANCE:BTCUSD is still trading inside a wide consolidation range, but the overall structure shows a slow upward trend supported by the rising diagonal trendline below the price. Every time BTC has dipped toward that ascending line, buyers have stepped in and pushed it back up, which means the market is still respecting bullish pressure from the bottom. On the upside, the main problem remains the heavy supply zone around 93,500 to 94,500, where price has repeatedly rejected and failed to break through. Each attempt into that zone has triggered selling and pulled the market back down, showing that sellers are still defending this level strongly. At the moment, price is sitting near the mid-range, recovering after a sharp drop, but it has not shown any clean breakout or breakdown yet. As long as the ascending support trendline holds, the market stays in a slow bullish structure, but unless BTC breaks above the 94,500 zone with strength, the chart will continue to move sideways between support and resistance.

BTCUSD: It’s All Going According To PlanPrice came down as expected. Now we have entered into a consolidation range before proceeding lower. This is normal and in the bots algorithm to short Bitcoin again. The key target to wait for on the pullback is between 95k-105k. After this stop, price will decrease over the next year to between 50k-60k; that’s where the buying will come in and the next cycle will start.

BTCUSDT - Signal#BTCUSDT - Signal
H4 - Formation of a triangle line retest + ABC structure on H1. Stop behind the low of the 2nd wave. When a fractal appears on H4, move the stop beyond the fractal.
Entry: 92137.62
TP: 97069.86 - 102633.68 - 107836.60 - 116236.75
Stop: 89430.90 - *91297.27

BTC Trade Set Up Dec 10 2025Price pushed higher yesterday sweeping 4h BSL and is now trading within a range so i want to see a clear break and close of either direction to target higher or lower liquidity

BTC/USD (Bitcoin) LONG AND SHORT SET UPLong set up
Entry Price 1: $90,500
Entry Price 2: $86,500
Stop Loss: $83,500
Take Profit 1: $94,500 (Close 25%)
Take Profit 2: $97,500 (Close 50%)
Take Profit 3: $100,500 (Close 75%)
Take Profit 4: $110,500 (Close 100%)
Status: ACTIVE
Short set up
Entry Price 1: $92,500
Entry Price 2: $94,500
Stop Loss: $97,500
Take Profit 1: $90,500 (Close 25%)
Take Profit 2: $88,500 (Close 50%)
Take Profit 3: $86,500 (Close 75%)
Take Profit 4: $83,500 (Close 100%)
Status: ACTIVE

Ascending triangle formation indicates a bullish outlook for BTC#BTCUSD BITSTAMP:BTCUSD BINANCE:BTCUSDT
From the 4H chart, BTC's short-term trend has formed an ascending triangle pattern, which is a typical bullish pattern. Short-term resistance is located at 93500-94500, a break above this level would likely lead to further gains. The key support level to watch is 88000-87500. If the price retraces to this range, we can consider going long on BTC.
BTCUSD Stabilizes Near 92,000 – Key Entry Zones & TargetsBitcoin prices kicked off a sharp unilateral rally from around 90,000 yesterday. The upward momentum was extremely strong, as prices not only broke through the key 94,000 level smoothly but also hit a short-term high near 94,550. This move successfully broke the previous consolidation range of 88,000–91,000, setting a new price high in nearly three weeks and reflecting robust short-term bullish momentum.
However, facing heavy pressure from strong resistance near 95,000, prices subsequently entered a phase of sustained pullback. Hourly charts saw a string of consecutive bearish candles, with a marked retracement magnitude that drove prices gradually down to around 92,000. Today, BTCUSD trended with an oscillating pullback after breaking the key level, and it is currently stabilizing around the 92,000 mark without further sharp declines.
Resistance Levels:
The immediate strong resistance remains in the 94,000–94,550 range, which was the short-term high established in the early hours of today. For bulls to reignite an upward move in the near term, a breakout above this range is essential to unlock further upside potential. Further up, the 95,000 round-number level acts as a major psychological resistance, which exerted significant suppression and triggered the pullback during the previous rally.
Support Levels:
92,000 serves as the most immediate support level, which has already been tested during the morning pullback and is currently showing effective support. Below that, the core support band lies in the 91,000–91,500 range—a zone that was the upper edge of the previous consolidation platform and acts as a critical bullish defense line. If this support fails to hold, the next major support zone will be 88,000–90,000, which has withstood multiple market tests in the past and boasts relatively strong support strength.
Trading Strategy:
Buy 92000 - 92500
SL 91000
TP 94000 - 94500 - 95000
Sell 94000 - 94500
SL 95000
TP 92000 - 91000 - 90000

Selena | BTCUSD – Bullish Structure Holding Above TrendlineBITSTAMP:BTCUSD
Price continues to respect the ascending trend structure formed after the breakout from the descending channel.
The current pullback into 91,400–91,850 support aligns with rising trendline confluence, making this the critical continuation zone for the next bullish leg.
🔹 Bullish Setup
A confirmed rejection from support + breakout above 93,600–94,000 will open the next expansion leg.
🎯 TP1 → 94,800
🎯 TP2 → 95,600
🎯 Final Target → 96,300–96,800 liquidity zone
🔸 Invalidation
❌ Break & close below 91,300 weakens continuation potential.
Next demand is far lower — deeper retracement may unfold.
⚠️ Educational-analysis only — not financial advice.

B I T C O I N MONEY Btcusd valid scalp setup to was the highs according to structure and price action,
( 50/50 method required + Trial Stop )

BTC updates
Here’s the Bitcoin result as well: it has gained 4%, and as expected, the 90,500 level pushed the price upward with high precision.
If you’d like to see more of my analyses, make sure to follow.

BTC Trade Set Up Dec 9 2025Price remains bearish making LH on the 1h and has swept BSL with a strong engulfing candle forming so i am targeting SSl

$BTC/USDT ANALYSISBitcoin is moving inside a symmetrical triangle on the 8-hour chart and the price is sitting near the middle of the range, trading below the 50MA which is acting as a resistance zone on top. Bulls are defending the lower trendline while sellers are active near the upper trendline, creating a squeeze where volatility is slowly reducing. If price holds above support, it may continue to move sideways inside the triangle, but a strong candle above the 50MA and triangle top would show strength, while a drop toward the ascending support would show weakness. Right now market is neutral and waiting for a clear break from this pattern, so upcoming moves around these trendlines will decide the next direction.

BTC Trade Set Up Dec 8 2025Price is overall bearish making LH/LL on the 4h, has came up too tap into supply and now will expect price to make internal 15m bearish structure to continue lower to lower SSL and demand areas

Bitcoin Weakness Unfolding – Kijun Break Confirms Bear Bias🚨 BITCOIN (BTC/USD) BEARISH PROFIT PATHWAY 🚨
Hey Traders! 👋 A compelling bearish setup is unfolding on PURPLETRADING:BTCUSD. This swing trade plan leverages a classic Ichimoku signal with a sophisticated entry method for optimal risk distribution.
📉 THE BEARISH THESIS:
The bearish momentum is confirmed by a decisive breakout BELOW the Kijun Sen (Baseline). This indicates a significant shift in medium-term momentum, favoring the sellers.
🎯 MY TRADING PLAN:
Direction: BEARISH 🐻
Style: Swing Trade
Strategy: "The Thief" Layer Entry
⚡ ENTRY STRATEGY (The "Thief" Layer Method):
Instead of one risky entry, we use multiple sell limit orders at key resistance levels. This averages our entry price and builds a position as price moves in our anticipated direction.
Proposed Sell Limit Layers:
Layer 1: 96,000.00 🟥
Layer 2: 94,000.00 🟧
Layer 3: 92,000.00 🟨
Layer 4: 90,000.00 🟩
You can adjust the number of layers and prices based on your capital & risk appetite.
🛑 RISK MANAGEMENT (STOP LOSS):
A safety stop loss is placed above a key resistance zone at 98,000.00.
⚠️ IMPORTANT NOTE: This is MY plan. You MUST adjust your stop loss based on your personal risk tolerance and strategy. Protect your capital!
🎯 PROFIT TARGET (TAKE PROFIT):
Our primary target is 82,000.00, where we expect a confluence of:
Strong Support from the Triangular Moving Average (TriMA).
Oversold Conditions on lower timeframes.
A potential bull trap being sprung.
💡 SMART EXIT TIP: Consider taking partial profits on the way down. You are NOT obligated to hold until the final target. Secure profits according to your own plan!
🔍 RELATED ASSETS & KEY CORRELATIONS:
Watching these related markets can provide confirmation and strengthen the thesis:
TVC:DXY (U.S. Dollar Index): 🟢 A stronger DXY often puts downward pressure on Bitcoin. Watch for bullish momentum in the dollar as a tailwind for this bearish BTC setup.
BITSTAMP:ETHUSD (Ethereum): Crypto majors often move in tandem. If Ethereum shows similar weakness and breaks key supports, it confirms a broader crypto market pullback.
^SPX (S&P 500 Index): In recent years, BTC has shown correlation with risk-on assets. A declining stock market could accelerate the sell-off in Bitcoin.
AMEX:GBTC (Grayscale Bitcoin Trust): Monitor for significant discounts or premiums to NAV, as it can reflect institutional sentiment.
✅ LIKE & FOLLOW if you find this analysis helpful! It helps the algorithm and keeps you updated on my latest market insights. ✅
📣 Let me know your thoughts in the comments! Are you bullish or bearish on Bitcoin here? 👇

$BTC/USDT ANALYSISBitcoin on the 8-hour chart is consolidating within an ascending triangle formation, showing clear higher-low structure support near the rising trendline. The price is currently trading below both the 50-period moving average and the Ichimoku Cloud, which are acting as strong dynamic resistance levels. The highlighted red zone around 92,000–93,500 USDT represents a heavy supply area where previous rejections occurred.
As long as Bitcoin holds above the ascending trendline support near 86,000–86,500 USDT, the structure remains intact, suggesting buyers are still defending this zone. A clear breakout above the 50 MA and the 92,000 USDT resistance region would confirm a bullish continuation toward 95,000 USDT and beyond. However, failure to hold the rising support trendline could trigger a short-term correction toward 84,000 USDT before any recovery attempt.
