BTC at Critical Support — Bounce or Breakdown?BTC 4H Update
BTC is still moving in a controlled pullback after failing to break the 93,241 resistance. The rejection shows the market continues to respect this supply zone, and price is now hovering just above short-term support.
The key area to watch is the 88,850–89,200 support zone. If BTC can hold this level, a rebound toward 90,193 is likely, followed by another attempt to break the major resistance. A successful breakout would open the path toward the 98k–99.5k zone shown on the chart.
However, if this support breaks, price may slide into the OB 87,670–86,300 or even revisit the 85,650–85,000 support area — the same zone that created the recent higher low. Losing that level would weaken the bullish structure.
For now, structure is still intact, and BTC just needs a clean bounce to maintain upward momentum.
Btcusdtanalysis

Bitcoin Momentum Building — Bullish Plan Activated!BTC/USDT — “BITCOIN VS TETHER”
Crypto Market Opportunity Blueprint (DAY / SWING Trade) 💹✨
🔥 Plan: Bullish plan confirmed
The structure is supported by a Hull Moving Average (HMA) pullback, behaving like a clean re-accumulation phase — showing buyers quietly loading before the next expansion wave.
This pattern typically appears before trend continuation legs, especially when volatility compresses after a strong impulse.
🎯 Entry
📌 YOU CAN ENTRY AT ANY PRICE LEVEL
(Structure shows strength across multiple levels with buyers defending dips.)
🛡️ Stop Loss
⚠️ This is thief SL @ 86000
Dear Ladies & Gentleman (Thief OG's), adjust your SL based on your own strategy & personal risk tolerance.
🔍 Important:
I am not recommending to use only my SL.
It's your own choice — you can make money then take money based on your own risk.
🎯 Target
Price is moving into a zone where the moving averages act as a strong resistance, combined with overbought conditions and potential trap formation, so escaping with profits is wise.
📌 Our target @ 98000
Again — Dear Ladies & Gentleman (Thief OG's):
I am not recommending to set only my TP.
You can make money then take money at your own risk.
📡 Related Pairs to Watch (Correlations & Key Behaviors)
Below are correlated assets that help confirm BTC/USDT’s flow, momentum, and broader crypto market direction. These are presented in $ format for TradingView tagging.
1️⃣ BINANCE:ETHUSDT (Ethereum)
Strongest beta-pair to Bitcoin.
When BTC shows re-accumulation, ETH often leads the breakout earlier.
If ETH breaks major resistance first → increases confidence in BTC continuation.
2️⃣ BINANCE:SOLUSDT (Solana)
High-momentum asset; reacts faster than BTC.
If SOL pumps aggressively while BTC consolidates → indicates risk-on sentiment across crypto.
Good for measuring market confidence.
3️⃣ BINANCE:BNBUSDT (BNB)
Acts as a market stability indicator.
If BNB stays firm above key moving averages, liquidity remains strong across the crypto market.
Helps confirm medium-term bullish structure.
4️⃣ BINANCE:ETHBTC (Ethereum / Bitcoin Ratio)
A critical relative-strength indicator.
If ETHBTC drops → capital rotates into BTC dominance, supporting your Bitcoin bullish plan.
If ETHBTC rises → broad alts strength, but BTC may not accelerate instantly.
5️⃣ CRYPTOCAP:TOTAL2 (Altcoin Market Cap)
When TOTAL2 rises with BTC → marketwide confidence.
When TOTAL2 stagnates but BTC rises → BTC-only rally (typical before big breakouts).
Useful to detect inflow distribution.
6️⃣ TVC:DXY (US Dollar Index)
Inverse correlation with Bitcoin.
If DXY weakens → supports BTC bullish continuation.
Important for swing traders taking multi-day positions.
7️⃣ CRYPTOCAP:USDT.D (Tether Dominance)
When USDT.D drops → money flowing from stablecoins into crypto.
When USDT.D rises → risk aversion.
Perfect tool for confirming if BTC demand is real.
📈 Summary Insight
Together, BTC’s HMA pullback + re-accumulation structure, rising momentum across correlated pairs, and declining defensive indicators build a high-probability bullish continuation environment for the next expansion wave.

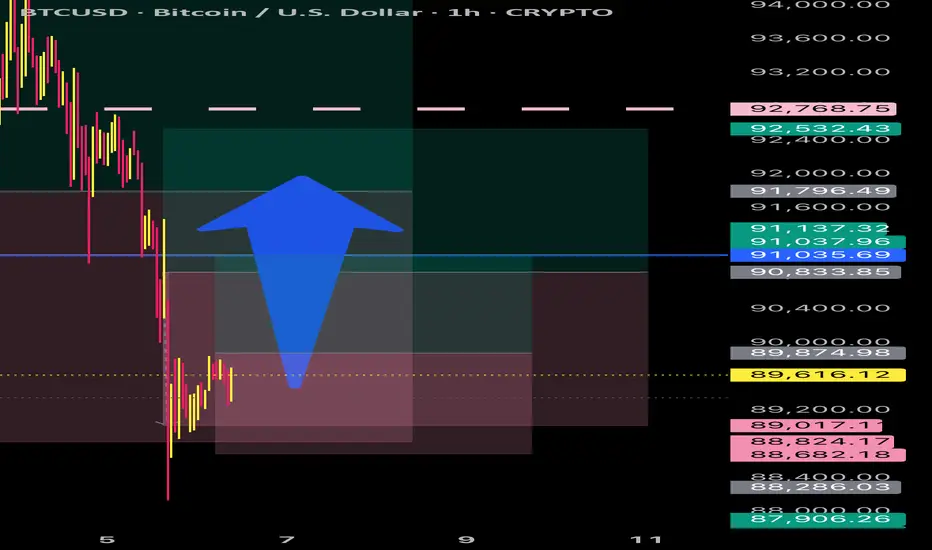
BTC SCALP Btcusd looking to give us a nice and simple push to the upside , so I shall scalp this cryptocurrency and take partial profits
BTC Trade Set Up Dec 5 2025price has shifted to bearish structure creating LL/LH on the 1h, so i will want to see price break and close under SSL, fill the 4h FVG and continue to make bearish structure to continue lower to demand and SSL

104k Moonshot or Brutal 96k Rejection? Bitcoin’s Final Bull TrapFriends, Bitcoin has played out exactly as outlined in my previous idea.
As I mentioned last time, that drop could have either been:
1. The start of a deeper bearish continuation after a minor correction, or
2. Wave B of a larger ABC correction — in which case BTC had to reclaim above 93k.
The chart has confirmed the second option — it was wave B.
Therefore, we are now building wave C upwards, and Bitcoin has already broken above 93k.
On the current chart I still have two active scenarios:
🟠 Orange arrow scenario:
A quick push toward ~96k followed by a reversal and drop back to the recent lows.
In this case, the entire three-wave move we’ve seen so far could become wave A of a larger corrective structure.
🟢 Green arrow scenario (my preferred one for now):
Continuation higher to the 102–104k zone, completing wave C of this correction, and only AFTER that we finally update the recent lows.
My ultimate downside target remains 60k and below, but first let’s see which path Bitcoin chooses in the coming days.
Which scenario do you think will play out — orange or green?
Drop your thoughts in the comments! 👇
Like, comment, follow if you find this helpful — really appreciate your feedback and reactions! 🚀

BTCUSD: Reversal From Target & Demand Zone Liquidity Sweep Setup📊 BTCUSD – 30-Minute Smart Money Analysis + MMC Concept Used
Demand Zone Reaction | Volume Burst | QFL Strategy
🔍 1. Market Overview
Bitcoin on the 30-minute chart is currently pulling back after failing to break above the recent intraday high. Price is slowly drifting downward, showing signs of controlled seller pressure. This decline is driving BTC toward a key demand + target zone, marked in blue, with deeper liquidity resting in the green “Volume Burst” zone.
This setup suggests a potential reversal opportunity, but only with confirmed price action.
📉 2. Structure Breakdown
A. Decline After Swing High
BTC rejected the upper levels and started forming:
Lower highs
Lower lows
Weak bullish candles
This shows sellers are still in control until price touches a stronger demand pool.
B. QFL Level Marked
The "QFL" marking on the chart reflects:
A base level where price previously formed
A zone that held liquidity and triggered a bullish bounce last time
A zone that smart money may revisit to collect liquidity again
If no pattern forms at the first demand box, BTC may double the QFL, meaning price can dip into the deeper liquidity pool before reversing.
🎯 3. Key Zones to Watch
🟦 Target + Demand Zone (Upper Zone)
This is the first area where buyers may step in.
Expect:
A possible micro reversal pattern
Short-term bounce opportunity
Scalping potential
However, you must wait for a clean bullish pattern here (engulfing, pin bar, break of minor structure).
The chart clearly states:
“Pattern Needed Otherwise Double The QFL”
Meaning: No pattern = price moves lower.
🟩 Volume Burst Zone (Lower Liquidity Pool)
This deeper zone is stronger because:
It represents the previous area where a volume spike occurred
Smart money positioned aggressively here before
Liquidity is highly concentrated
If price reaches this zone, the reversal probability becomes significantly higher.
This area is ideal for high-probability long entries.
📌 4. Smart Money Logic
The price movement aligns with institutional behavior:
The current drop is likely a liquidity hunt
BTC is moving toward unfilled demand
Buyers may re-enter strongly once the market taps the liquidity pockets shown
Institutions often engineer these dips before the next bullish impulse.
📈 5. Professional Trading Plan
1. Let price fall into the demand zone.
Do not enter early.
2. Look for confirmation:
Bullish engulfing
Market structure shift
Large volume candle
Clean rejection wick
3. If no pattern forms in the first zone:
Expect price to dip toward the lower Volume Burst Zone.
4. Main long entry interest:
Lower (green) zone offers the best probability.
📝 Conclusion
BTC is heading toward a well-defined demand structure. The next move depends on how price reacts in the highlighted zones. A bullish reversal is possible, but confirmation is critical. Without a pattern, BTC may dip deeper to collect liquidity—exactly as marked on the chart.
This setup reflects precision-level smart money behavior, offering a clean high-probability trading opportunity for disciplined traders.

Elise | BTCUSD 4H — Break of Bearish Structure |BITSTAMP:BTCUSD
Price previously rejected from the major corrective zone and continued bearish until a final liquidity grab created imbalance and shift of character. The recent breakout from the bearish channel and bullish momentum suggests institutional repositioning, preparing for upside continuation toward higher correction levels.
Key Scenarios
🚀 Bullish Case (Primary Bias)
If price re-tests and holds above 93,500–95,300, upside continuation is expected:
🎯 Target 1: 100,500
🎯 Target 2: 105,800
🎯 Target 3: 116,200 (Major Correction Zone)
📉 Bearish Case (Invalidation)
A clean breakdown below 88,500 would shift bias back to bearish and may revisit the liquidity grab zone.
Current Levels to Watch
Entry Zone: 93,500–95,300
Support: 88,500
First Breakout Confirmation: Above 96,000
⚠️ Disclaimer: This analysis is for educational purposes only — not financial advice.

BTCUSDT: Bullish Push to 98500?BINANCE:BTCUSDT is eyeing a bullish reversal on the 4-hour chart , with price rebounding from a broken level near cumulative long liquidation, converging with a potential entry zone that could trigger upside momentum if buyers defend against further dips. This setup suggests a recovery opportunity after recent pullback, targeting higher resistance levels with excellent risk-reward.🔥
Entry between 87500–88500 for a long position (entry at current levels with proper risk management is recommended). Targets at 95000 (first), 98500 (second). Set a stop loss at a close below 85000 , yielding a risk-reward ratio up to 1:3 overall. Monitor for confirmation via a bullish candle close above entry with rising volume, leveraging Bitcoin's resilience post-correction.🌟
Fundamentally , Bitcoin is consolidating around $89,000 in late November 2025 after a sharp retreat from its all-time high of $126,000, driven by fading momentum and institutional caution amid a 15%(from top) October decline contrary to historical patterns. Despite dipping below $85,000 recently (trough at ~$80,553), fundamentals remain strong with institutional investors holding steady, reduced Fed rate cut expectations supporting USD strength, and long-term forecasts eyeing upside to $240,000 driven by macro asset behavior and cycle highs. Bitcoin correlates with the S&P 500 , and recently we've seen growth in the S&P 500. 💡
📝 Trade Setup
🎯 Entry (Long):
87,500 – 88,500
(Entry at current levels with proper risk management is also valid)
🎯 Targets:
• 95,000 (first)
• 98,500 (second)
❌ Stop Loss:
• 4H close below 85,000
⚖️ Risk-to-Reward:
• Up to 1:3 on full run
👇 Share your thoughts below! 👇

BTCUSD – Key Level Rejection with Potential Liquidity Sweep TowaChart Analysis
1. Price Context
BTCUSD is trading around $90,675.
The chart shows price rejecting the Key Level and failing to hold above the Daily CLS (daily close level).
Recent candles indicate loss of bullish momentum with a series of lower highs forming.
2. Key Zones on Your Chart
🔴 Daily CLS (Resistance)
Marked in red.
Price tried to break and hold above this level but rejected, showing it is acting as strong overhead resistance.
The shaded gray area above looks like the stop-loss zone for shorts, suggesting a bearish setup.
🟢 Key Level
Marked slightly below the Daily CLS.
Price broke above it earlier but is now retesting from the top, failing to reclaim.
This retest-rejection pattern signals a shift from bullish to bearish sentiment.
3. Trade Bias Indicated by the Chart
Your marked zone suggests a short position setup:
Entry around current price or just under the Key Level.
Stop-loss in the gray shaded box above the Daily CLS.
Take Profit 1 at 50% CLS TP1, a midpoint liquidity target.
Final TP near the green support at the bottom.
This structure reflects a liquidity-based short setup, expecting:
A sweep of local highs → rejection → push down to fill inefficiencies or revisit liquidity pools below.
4. Market Structure
Price printed a strong move up earlier, leaving inefficiency below.
Now forming lower highs and lower lows on the lower timeframe.
Hold below Key Level suggests continuation downward.
5. Bearish Confirmation Signals
✔ Failure to hold above Daily CLS
✔ Break of Key Level and retest as resistance
✔ Weak bullish follow-through
✔ Liquidity target below at 50% CLS

BTCUSD 4H Bullish setupBitcoin is showing a strong bullish structure on the 4H chart.
Price is currently holding above the EMA ribbon and rejecting the lower band with clear buying pressure — a typical sign of continuation after a corrective pullback.
🔶 Bullish Confluences
Price holding above dynamic support (EMA cloud turning green).
Higher-low formation after the recent sell-off, signaling buyers stepping in.
Fibonacci channel support respected, with price bouncing from the midline.
Strong candle reaction from the 0.382 retracement zone, often a bullish continuation level.
Upside liquidity sitting above 93.3k and 95.5k, attractive magnet for price.
🎯 Fibonacci Extension Targets
TP1 – 38.20%: ~93,525
TP2 – 61.80%: ~94,876
TP3 – 100%: ~97,063
If momentum increases, price could push toward the 100k zone again, with extended targets beyond.

BTCUSD: The Premium Mitigation TrapThe Narrative: Mitigation Before Expansion While the crowd chases green candles, the Daily structure tells a different story. We are witnessing a textbook CRT Mitigation Phase. Price is not reversing; it is simply rebalancing inefficiencies to prepare for the next leg of institutional delivery.
Technical Breakdown:
The Magnet (Bearish FVG): Price is currently drawing up into a significant Bearish Fair Value Gap (FVG) sitting between $95,900 and $97,500. In the CRT framework, this gap acts as a "price magnet". Smart Money uses this rise to rebalance price and induce retail bulls before slamming the door.
Premium Pricing: This move brings Bitcoin into "Premium" pricing relative to the recent dealing range. Institutions sell in premium; they do not buy. This rally is the Manipulation Phase designed to hunt Buy-Side Liquidity (stops) above local highs before the real move occurs.
The Draw on Liquidity (DOL): Once the FVG is filled and the trap is set, the Draw on Liquidity flips aggressively to the downside. The structural targets are clear: the resting Sell-Side Liquidity pools at $78,418 and $74,592.
The Execution Plan:
We remain patient and let the price come to us.
Wait: Allow price to trade into the Grey FVG Box ($96k region)
Confirm: Watch for a "Thick Candle" rejection or a lower timeframe shift in structure to confirm the Smart Money entry.
Expand: Target the clean lows below $75k.
“Smart money doesn't chase price; they wait for price to enter their zones.”

BTCUSD Prediction November 2025I,m on buy position on BTCUSD since it hit support,opened a day with bullish bias ,Volume tool support it too .

BTCUSD : Short-Term Bearish Correction OutlookBitcoin is forming a potential corrective sequence on the 4-hour timeframe after completing its recent impulsive recovery phase. Current price behaviour reflects an early shift in momentum, suggesting the market may be preparing for a deeper pullback before reassessing the next directional leg as December progresses.
Disclosure: We are part of Trade Nation's Influencer program and receive a monthly fee for using their TradingView charts in our analysis.

BTCUSD Rejected its Daily Support and Ready For FlyHello Traders
In This Chart BTCUSD HOURLY Forex Forecast By FOREX PLANET
today BTCUSD analysis 👆
🟢This Chart includes_ BTCUSD market update)
🟢What is The Next Opportunity on BTCUSD Market
🟢how to Enter to the Valid Entry With Assurance Profit
This CHART is For Trader's that Want to Improve Their Technical Analysis Skills and Their Trading By Understanding How To Analyze The Market Using Multiple Timeframes and Understanding The Bigger Picture on the Charts

BTCUSD: Wave rhythm on the verge of impulseBased on the current structure, Bitcoin is completing its corrective phase and is preparing to form a new impulse. The chart shows a transition from sideways movement to a more dynamic wave, which could set the direction for the near term.
Primary scenario: after the correction ends, a downward impulse sequence is expected to develop. Alternative scenario: if the market consolidates above recent highs, it could continue to rise, delaying the start of a new downward wave.
Idea for traders: watch for confirmation of the structure on lower timeframes and enter only after clear reversal signals appear.
Friends, more wave analysis is available in our profile.
Subscribe to stay up to date with wave analysis!

Weekly BTCUSD Trend SummaryThis week, BTCUSD launched a strong rebound following a previous sharp decline, but later pulled back after hitting resistance, presenting an overall oscillatory recovery pattern characterized by "rebound – rally – pullback."
1. Early-Week Oversold Rebound with Intense Long-Short Dynamics (November 24)
At the start of the week, BTCUSD extended its oversold rebound after touching a 7-month low of $80,600 the prior week. Prices briefly broke above $88,000 in the morning, with an intraday peak gain of 3.85%; however, the market pulled back in the afternoon, slipping below $86,000 to turn slightly negative.
2. Mid-Week Oscillatory Uptrend as Bearish Momentum Faded (November 25 – 26)
November 25: Prices traded around $88,000, approaching the key resistance level of $90,000, forming a three-day consecutive rebound on the daily chart.
November 26: A bullish rally emerged in the evening, with prices surging approximately 5,000 points to successfully break through the $90,000 mark. However, the rally lacked subsequent volume support, preventing prices from extending further into higher ranges and laying the groundwork for a subsequent pullback.
3. Late-Week Rally Followed by Pullback, Halted at Key Resistance (November 29 – 30)
In the latter half of the week, the market experienced a turning point. On the morning of November 29 (Friday), prices touched a weekly high of $93,092 but immediately pulled back. Subsequently, prices retreated to around $90,000 to seek support, testing the validity of the $90,000 – $91,000 support range. From a market analysis perspective, the area around $93,000 represents the high of a consolidation range following multiple previous pullbacks, featuring strong resistance.
Overall Outlook & Key Drivers
Overall, BTCUSD staged a significant rebound from recent lows this week, but the lack of sufficient volume during the rebound was a prominent issue. Going forward, focus should be on whether prices can hold above the $90,000 support level—if broken, a further pullback may ensue. Conversely, if BTCUSD can regroup and break through the key level of $93,500, it may attempt to challenge the two-month downtrend line around $96,000.

BTCUSD - Wave 5 Decline Still Likely AheadPrevious Analysis:
BTC is approaching a critical reaction zone where the current rise looks more like a corrective push than the start of a new trend. Price is moving toward the highlighted supply region, which aligns with a potential wave 4 completion inside the descending channel. The structure from the recent low shows an internal a–b–c formation, suggesting this bounce could run into exhaustion as it enters the red zone. Unless BTC breaks out of the channel with conviction, the broader momentum still leans bearish. A rejection from this region would likely trigger the final wave 5 leg, driving price toward deeper Fibonacci levels and completing the corrective cycle before any meaningful recovery attempt can begin.
Stay Tuned!
@Money_Dictators

BTCUSD Relief rally before another drop.BTCUSD is currently completing 5 wave bearish structure, I'm expecting a wave 4 retracement before another wave down.
Sell Zone: $92,150 – $96,700
I expect BTC to continue climbing into this zone before distribution begins. Beware that BTC's bullish momentum is exhausted and it might not reach that high. Reaching this sell level might be a complex correction not a simple one.
Buy Zone: $72,100 – $75,990
If this analysis plays out well, and market starts showing bullish signs, I'm expecting it will be the local low for this bearish bitcoin move. Otherwise, price might continue dropping to $62,000 area.
I will update this idea later.
Good Luck!

BTCUSD: Wave Pendulum on the Verge of ReversalBTCUSD: Wave Pendulum on the Verge of Reversal
BTCUSD Wave Overview (H4/D1)
According to its wave structure, Bitcoin is completing its corrective phase and preparing to form a new impulse. Current dynamics indicate a possible end to the sideways movement and a transition to the final wave of a larger cycle.
Primary scenario: A downward impulse sequence is expected to develop after the correction is complete. Alternative scenario: If the market consolidates above recent highs, it could continue to rise, delaying the start of a new downward wave.
Idea for traders: watch for confirmation of the structure on lower timeframes and enter only after clear reversal signals appear.


BTCUSD – Bullish setup 4HBITSTAMP:BTCUSD is showing early signs of a potential bullish reversal after reclaiming the mid-range of the channel and holding above key EMAs. Price is consolidating just under the dynamic resistance band, and repeated higher lows suggest buyers are gradually regaining control.
🔍 Bullish Confluences:
Reclaim of mid-trend band with candles closing above the lower volatility ribbon.
Higher-low structure forming after the recent sweep of liquidity.
Momentum shift indicated by bullish reaction off the 0.382–0.5 retracement zone.
Support confluence at ~86.8k where previous demand and fib structure overlap.
🎯 Fibonacci Targets:
TP1 – 38.2%: 89,242
TP2 – 61.8%: 90,576
TP3 – 100%: 93,500
If price breaks and holds above the current compression zone, continuation toward the fib cluster at 90–91k becomes likely, with the final upside extension pointing toward 93.5k.

BTC: Bullish Trend, 900000 Breakout AheadFollowing Black Friday’s plunge, BTC’s uptrend is now confirmed—holding firmly above 85000 and awaiting a direct breakout above 90000
Buy 86500 - 87500
TP 88500 - 89000
Accurate signals updated daily. They serve as a reliable guide for trading issues – feel free to refer to them. Hope they help!

BTCUSD today BTCUSD is in a narrow-range consolidation phase. While it benefits from the boost to risky assets amid expectations of a Federal Reserve rate cut, persistent pressure from capital outflows in spot markets and ETFs has kept bullish and bearish forces temporarily balanced, with the price oscillating between key support and resistance levels.
On the daily timeframe, the price is trapped in a tight trading range of $86,500 - $88,000, and the Bollinger Bands have contracted to their narrowest level this month. This pattern indicates the market is at a critical juncture for directional selection, with little probability of a sharp one-sided move in the short term.
Support Levels: The primary support zone is $86,000 - $86,500. This range not only served as the stabilization area following the intraday pullback but also acts as a crucial trendline underpinning the long-term structure. Holding this level is expected to sustain the short-term consolidation; if breached, the next core support will be $83,000, with a further breakdown potentially testing $78,500.
Resistance Levels: The key short-term resistance zone is $89,000 - $90,000, where the $90,000 mark forms a strong psychological resistance. Previous attempts to rally above $90,000 have consistently faced selling pressure from capital outflows. A breakout above this zone would target subsequent resistance levels around $90,450 and $92,300.
Buy 86000 - 86200
SL 85800
TP 87500 - 88000 - 88500
Sell 88000 - 88500
SL 89200
TP 87000 - 87500 - 88000
