Coinranger|BTCUSDT. Reversal or continued decline?🔥News
🔹Today, the US votes on the government budget.
🔹US manufacturing PMI at 18:00 UTC+3.
🔥BTC
🔹A mega-drop to 74600. What's next:
1️⃣ Above there is the level at 79500, but it's dynamic. And until there's some kind of movement stop, there's nothing more to say. Keep an eye on your moving averages.
2️⃣ Below, a full set of waves with extensions on the h4 timeframe has already been completed. A reversal attempt could occur around the current level. There are 72900 and 71050 a bit lower on the hourly timeframe – a complete set of three consecutive downward sets.
I wouldn't do anything for now. It's best to wait for one of the above scenarios to play out.
---------------
Share your thoughts in the comments!
Btcusdtforecast

GBTC is hinting a major bottom soon on BTC!AMEX:GBTC
– Elliott Wave Update (1H Chart)
The decline from the Wave B high continues to follow a clean 5-wave impulse. Current price action suggests we are inside Wave (iv) before the final flush.
🧩 Structure so far:
🔻 Wave (i)
• Initial sharp drop
• Set the tone for the entire downtrend
🔻 Wave (ii)
• Reactive bounce into the mid-channel
• Perfect retracement behaviour for an impulse
🔻 Wave (iii)
• Long, persistent decline
• Strongest momentum segment
• Clean subdivisions visible on lower timeframes
🔵 Wave (iv) now forming:
• Grinding upward inside the corrective channel
• Should remain below upper channel resistance
• Likely forming a flat / zigzag corrective before rollover
🔻 Wave (v) expected next:
• Final leg down to complete C
• Target = lower channel + 60–62 region
• Completion of the larger corrective cycle
🟢 After Wave C completes:
• Expect a medium-term trend reversal
• First target = reclaiming broken channel lines
• Bigger target = recovery toward prior structure above 90+
📌 Summary:
Wave (iv) = corrective bounce.
Wave (v) = final drop → then macro reversal likely. ⚡
I am overall bullish on CRYPTOCAP:BTC after this drop. Please check my
BTC update here.

Coinranger|BTCUSDT. Potential reversal to 90930🔹Fed rates at 22:00 UTC+ 3, FOMC press conference at 22:30 UTC+ 3. We can fly on this news.
🔹US earnings season is in full swing.
🔥BTC
🔹Still holding towards 89840:
1️⃣ The main upper level has been clarified at 89840. Above that are 90930 and 92930, but these are just worth keeping in mind for now. This is a complete set of upside waves.
2️⃣ Below, the important 88,500 level is actual and 85,000 and 84,700 lower are still relevant.
Until the rate issue, bitcoin may be trading in a micro-flat of 89,840 - 88,500. There's a chance afterward of a move higher to 90,930.
---------------
Share your thoughts in the comments!

Coinranger| BTCUSDT. Continuing decline to 85,000🔥News
🔹No important news today. Only an old data on american market will be released, which is usually considered preliminary.
🔥BTC
🔹Fell down last night and broke through previous peak. Current levels:
1️⃣ The levels above can only be calculated tentatively. 88,500 is the first level for the end of the pullback.
2️⃣ The levels below - 85,000 and 84,700 - almost coincident potential ends of the downward sets of waves on h1 and h4.
Without news, we could either continue the decline, or make a pullback, and then, for example, fall further.
---------------
Share your opinion in the comments!

Coinranger| BTCUSDT. Flat at 90500 - 87550?🔥News
🔹The WEF continues. Preliminary US manufacturing and services PMI data will issue at 17:45 (UTC+3) - no sharp movements expected.
🔥BTC
🔹Staying within yesterday's levels:
1️⃣ The levels above are the same: 91800 and 92855.
2️⃣ Below, 87550 remains actual.
The situation remains unclear. A pullback is still possible - we're currently seeing a triangle forming in the second wave. Potential flat ranges are 90500 - 87550.
---------------
Share your thoughts in the comments!

Coinranger| BTCUSDT: Uncertainty after the drop🔥News
🔹The International Economic Forum continues. Trump's speech is at 16:30 (UTC+3)
🔥BTC
🔹We've clearly followed the forecast. Now:
1️⃣ It's still hard to say for sure about the levels above. Preliminary figures are 91600 and 92855. But we could fall into a flat for a while.
2️⃣ The price may reach 87550 before continuing the pullback. I haven't marked any lower levels yet, because we're unlikely to go there without a pullback.
The priority is a pullback; reaching the lower level is also possible.

Coinranger| BTCUSDT. Pullback to 93720 and continued decline🔥News
🔹The International Economic Forum in Davos begins today and will continue all week. America is closed for M. Luther King Day. No other significant news.
🔥BTC
🔹Finally fell to the target levels last night. New:
1️⃣ I've only calculated potential pullback levels so far above: 94590 and 93720. These are all pullbacks on the H1 timeframe. They are the most likely in the near future.
2️⃣ Below we have H1 target levels: 91970, 89500, and 87600. Between them, there are intermediate levels on the M15: 90970 and 89500.
For now, the pullback is the priority; the most likely level is 93720.
-------------------
Share your opinion in the comments.

Coinranger| BTCUSDT. Is growing still actual?🔥News
🔹No important news today. Potentially, Trump could start doing something in Iran. And, as we remember, in such cases, crypto can go down very fast.
🔥BTC
🔹However, yesterday it broke through 96,700 and even went a little higher:
1️⃣ Today's levels above: 98,900, and that's a bit too much. There are a couple of lower timeframe levels: 97,860 and 98,300. But today, both Trump and the pending US crypto laws are against crypto growing.
2️⃣ Levels below, a bit updated: 94,770, 93,460, 92,450
The downside move remains the priority. Glassnode data isn't talking about an influx of new capital, but about a short squeeze. This is a dangerous and fragile situation for such powerful growth.

Coinranger| BTCUSDT. Is further growth possible?🔥News
🔹Today at 16:30 (UTC+3) will issue the US PPI data for December, and most likely for October at the same time. Plus retail sales at the same time.
🔥BTC
🔹We soared to 95,000 on Trump's words about aid to Iran and made a good level. Now:
1️⃣ There's still 96,700 above, but we're unlikely to go there.
2️⃣ New levels below: 92,850, 91,450, 90,200 (preliminary estimates)
Theoretically, BTC should decline after such a rise; the number of completed upward waves is enough for a pullback. But PPI and Trump could change reality. For now, the priority is a pullback to 92,850.

The chart suggests a bearish bias: BTC is sitting near the suppoThe chart suggests a bearish bias: BTC is sitting near the support at 93,182 and the analyst expects a breakdown into the red target zone around 90,233.
A small‑scale idea would be to watch the 91,955 level (current price). If it breaks below the support, you could expect the price to chase the target at ~90,200. Conversely, if it bounces off 93,182, the move might stay in the range or test the seller zone again.

BTCUSD Bullish trend 3/1/2026BTCUSD bullish target $150,000, currently the price is starting to look strong with a change from the correction phase to the impulsive phase.
Follow me for more analysis.

ElDoradoFx – BTCUSD WEEKEND ANALYSIS
1️⃣ Market Overview
BTCUSD remains in a medium-term corrective phase after rejecting the major supply zone near the prior highs. Price has stabilized above last week’s lows but continues to trade below key dynamic resistance, keeping the broader bias cautious into the new week.
Market structure suggests distribution → breakdown → consolidation, with liquidity still resting on both sides. Directional conviction is likely to return with the weekly open and increased institutional volume.
⸻
2️⃣ Technical Breakdown
🔹 Daily (D1)
• Market structure is bearish to neutral after a clear rejection from the upper supply zone.
• Price trades below the daily 50 & 200 EMA, confirming loss of bullish momentum.
• Last strong demand sits around 84,400 – 85,200 (weekly demand).
• As long as BTC remains below 90,300 – 92,000, upside is corrective only.
D1 Bias: Corrective bearish / range environment.
⸻
🔹 H1
• Clear bearish BOS sequence followed by range compression.
• Price is capped below descending trendline + EMA confluence.
• H1 structure only turns bullish above 89,900 – 90,300.
• Liquidity resting:
• Above: 89,400 → 90,350
• Below: 86,800 → 84,400
H1 Bias: Range → potential continuation lower.
⸻
🔹 15M – 5M
• Intraday structure is choppy with repeated CHoCHs.
• Momentum indicators show weak bullish divergence, but no BOS confirmation yet.
• Ideal entries require liquidity sweep + structure confirmation.
• Scalps only until higher timeframe break.
⸻
3️⃣ Fibonacci Analysis (Primary Swing)
Swing: 94,468 → 84,445
• 38.2% → 88,300
• 50.0% → 89,450
• 61.8% → 90,600
🟨 Golden Zone: 88,300 – 90,600
This zone aligns with:
• EMA resistance
• Prior breakdown area
• Trendline resistance
⸻
4️⃣ High-Probability Trade Scenarios
📉 SELL Scenario (Primary Bias)
Sell Zone: 88,800 – 90,300
Targets:
• 87,500
• 86,800
• 85,200
Stop: Above 91,200
Confirmation:
• H1 / 15M rejection
• Bearish BOS
• Weak high sweep
⸻
📈 BUY Scenario (Countertrend / Conditional)
Buy Zone: 84,800 – 84,400
Targets:
• 86,800
• 88,300
• 89,400
Stop: Below 83,900
Confirmation:
• Liquidity sweep
• Strong bullish BOS
• Momentum expansion
⸻
📈 BUY Breakout Setup (Trend Shift)
Trigger: Daily close above 90,600
Retest Zone: 89,800 – 90,300
Targets:
• 92,000
• 94,400
Invalidation: Close back below 89,400
⸻
5️⃣ Fundamental Watch
• No major crypto-specific events scheduled.
• Focus on US Dollar strength, equity sentiment, and ETF flows.
• Expect volatility expansion from Monday–Tuesday after weekend compression.
⸻
6️⃣ Key Technical Levels
Resistance:
• 88,300
• 89,450
• 90,300
• 92,000
Support:
• 86,800
• 85,200
• 84,400
• 80,600 (macro)
⸻
7️⃣ Analyst Summary
BTCUSD is in a corrective consolidation within a broader bearish structure. Until price reclaims 90,300+, rallies are considered selling opportunities. The higher-probability play remains sell-the-rallies, with buys only valid from deep weekly demand or on confirmed breakout.
⸻
8️⃣ Final Bias Summary
✅ Primary Bias: Bearish below 90,300
⚠️ Range Risk: High during early week
🚀 Bullish Shift Only If: Acceptance above 90,600
— ElDoradoFx Team 🚀
⸻
🥇 ElDoradoFx FREE / GRATIS – WEEKLY PERFORMANCE 🥇
📅 15/12/2025 – 19/12/2025
━━━━━━━━━━━━━━━
🟢 MONDAY
✅ BUY +60 PIPS
🔵 TUESDAY
❌ SELL −40 PIPS (SL)
✅ SELL +60 PIPS
🟣 WEDNESDAY
✅ BUY +210 PIPS
✅ SELL +40 PIPS
🟡 THURSDAY
⚖️ SELL − BE
✅ BUY +60 PIPS
🔴 FRIDAY
✅ BUY +210 PIPS
━━━━━━━━━━━━━━━
📊 WEEKLY RECAP
💰 GOLD NET PIPS: +600
🎯 7 Counted Trades → 6 Wins | 1 SL
🔥 Win Rate: 86%
━━━━━━━━━━━━━━━
🚀 Solid consistency even on FREE signals.
Join us and trade with structure, discipline, and precision.

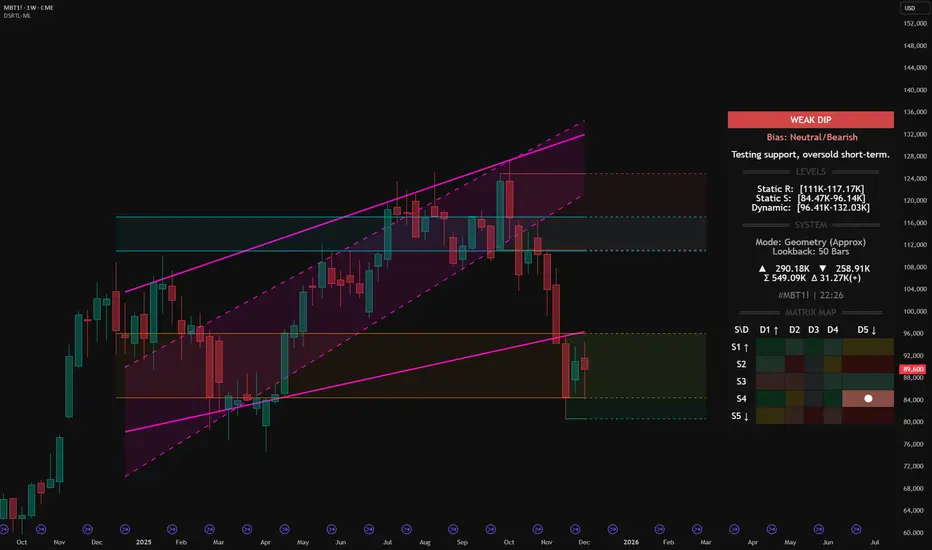
Micro Bitcoin Futures (MBT1!) – DSRTL‑ML Weak Dip at supportMicro Bitcoin Futures (MBT1!) – DSRTL‑ML Weak Dip at S4–D5 Support
We are analyzing the weekly structure of Micro Bitcoin Futures (MBT1!) using the institutional DSRTL‑ML support/resistance engine. On this bar the indicator classifies the state as WEAK DIP with a Neutral/Bearish bias and the system message:
Testing support, oversold short-term.
This reading comes from the current matrix position S4–D5 on the Matrix Map and defines the context for the price action inside this support zone.
1. DSRTL Matrix Diagnosis – State S4–D5
S4 – Static Support in Control
Price is trading inside the DSRTL Static Support band:
Static S: 84.47K – 96.14K
In the logic of DSRTL‑ML, this green support zone marks a historical high‑volume demand node where passive buy liquidity has previously absorbed aggressive selling. It behaves as a structural floor rather than a neutral price area.
D5 – Overshoot Below the Dynamic Channel
At the same time, price is positioned below the 5‑Point Dynamic Channel:
Dynamic Band: 96.41K – 132.03K
State D5 describes a downside extension beneath the lower boundary of the dynamic channel. Within this framework, that move is read as an oversold displacement away from the equilibrium path of the trend geometry, not as a fully confirmed new downtrend on its own.
Combined Reading – WEAK DIP with Neutral/Bearish Bias
The overlap of:
price sitting inside Static Support S4, and
price being oversold relative to the Dynamic Channel (D5)
produces the WEAK DIP classification. The Neutral/Bearish bias tells us that the dominant leg into this area is still downward, but the current candle represents a weaker phase of that dip occurring directly into a pre‑defined demand floor.
2. Key DSRTL Levels on This Chart
From the Levels and System panels on the chart:
Static Resistance (Supply Block): 111K – 117.17K
Upper structural ceiling derived from the DSRTL matrix of historical volume and price interaction.
Static Support (Demand Block): 84.47K – 96.14K
The active S4 floor where the current weekly bar is developing.
Dynamic Channel (Trend Geometry): 96.41K – 132.03K
The 5‑Point trend channel that defines the dynamic path of price; its lower edge around 96.41K is the first mean‑reversion checkpoint above the market.
Volume Metrics on This Bar:
Buying volume (▲): 290.18K
Selling volume (▼): 258.91K
Total volume (Σ): 549.09K
Delta volume (Δ): +31.27K
The positive delta together with the WEAK DIP label supports the idea that, inside S4, aggressive selling is meeting responsive buying rather than progressing as a fresh impulsive breakdown.
3. My Structural View Based on DSRTL‑ML
From a structural perspective, I read this configuration as follows:
Context of the Trend
The Neutral/Bearish bias confirms that the larger move into this zone is still a downward leg. The market is not flagged by DSRTL‑ML as a confirmed bullish reversal; instead, we are in a weak phase of the decline, pressing into defined support while the geometry is stretched.
Support Floor and Invalidation
As long as weekly closes remain above roughly 84.5K – the lower boundary of the S4 block – I consider this area a working demand floor for the current sequence. A decisive weekly close below that level would invalidate the weak‑dip narrative and shift the focus to a more developed breakdown of support.
Primary Path While S4 Holds
If S4 continues to hold, my expectation is that the oversold S4–D5 state will tend to resolve through mean reversion back toward the lower edge of the Dynamic Channel around 96.41K. In DSRTL terms, that is the first structural magnet above price once an overshoot has occurred.
Next Reference Above the Channel
Should price manage to re‑enter and hold inside the Dynamic Channel, the next major reference becomes the Static Resistance block at 111K – 117.17K. In my view, that zone represents the upper boundary of the current weekly structure and the area where I would expect supply and volatility to increase again.
In short, DSRTL‑ML currently maps MBT1! as a weak dip into S4 support with a still‑bearish background trend. My directional view is that, while this support holds, the structure favors a corrective mean‑reversion phase toward the dynamic band rather than an immediate continuation breakdown, with any weekly close below the S4 floor acting as a clear structural invalidation.
Indicator used for this analysis: DSRTL‑ML (Dynamic Support & Resistance Trend Logic).
Disclaimer: This publication expresses my personal opinion on the MBT1! chart based solely on the DSRTL‑ML indicator and standard price/volume analysis. It is not financial or investment advice and does not constitute a recommendation to buy or sell any instrument.
Bitcoin - H1 Breakout Alert – Bulls Taking Control!BTC/USDT - Bitcoin has officially broken its descending trendline and completed a successful retest from the demand zone. This shift signals a potential momentum reversal, with buyers stepping in aggressively after weeks of corrective price action. BINANCE:BTCUSDT
🔍 Technical Overview
✔️ Clean trendline breakout on H1 timeframe
✔️ Strong retest at demand zone → buyers defended perfectly
✔️ Price now trading above the trendline, indicating bullish structure
✔️ First target: $95,000 (psychological level + key resistance)
✔️ Second target: $100,000 (major psychological level)
If bullish pressure continues, liquidity grabs above these zones could fuel an extended move.
📊 Fundamental Insight
Institutional interest rises, especially around accumulation zones
ETF inflows remain positive, boosting overall sentiment
#BTC #Bitcoin #BTCUSDT #Crypto #CryptoTrading #BitcoinAnalysis #TradingSetup #Breakout #TrendlineBreakout #PriceAction #TechnicalAnalysis #Binance #CryptoMarket #Bullish
💬 Support the Idea
If you found this analysis useful,
👉 Please LIKE 👍 and COMMENT 💬
Your support helps me share more setups daily!
⚠️ Disclaimer
This analysis is for educational purposes only.
Not financial advice. Always manage risk (1–2% per trade) and follow your trading plan.

ElDoradoFx – BTCUSD ANALYSIS (22/11/2025, WEEKEND)1. Market Overview
BTCUSD continues in a strong downtrend from the 113k top, now trading around 84,000 after a sharp selloff. Price is sitting near the lower side of the descending channel and just above the key support band 83,500–83,400, with momentum still bearish but short-term showing signs of exhaustion / potential corrective bounce.
⸻
2. Technical Breakdown
🕐 Daily (D1)
• Clear bearish structure: consecutive lower highs and lower lows from ~113k.
• Price trades well below 20/50/100/200 EMAs, confirming dominant downtrend.
• Current D1 candle sitting near the prior “Sweep” zone around 83–81k.
• RSI oversold (~22–25) and MACD deeply red → trend strong but stretched; space for corrective rally before next leg down.
🕐 H1
• Price moving inside a falling channel, last swing low near 81–82k, last swing high around 88–89k.
• EMAs (20/50) below 200 EMA, slightly flattening → trend still down, momentum slowing.
• Small BOS to the upside from the last swing low, but still capped under H1 supply 84.8–85.7k.
• MACD shows bullish divergence vs the recent low → supports idea of pullback toward Fib zone before possible continuation.
🕐 15M–5M
• Intraday price is ranging 83.7–84.3k, forming minor higher lows.
• MACD positive, RSI hovering around 50 → short-term neutral / corrective phase.
• Still trading inside H1 downtrend and below intraday supply 84.8–85.2k.
⸻
3. Fibonacci Analysis
Last clear swing on H1:
• Swing High ≈ 88,700
• Swing Low ≈ 81,300
Fibonacci retracement (bearish pullback):
• 38.2% ≈ 84,120
• 50.0% ≈ 84,990
• 61.8% ≈ 85,870
🎯 Fibonacci Golden Zone: 84,100 – 85,900
This aligns with H1 supply and descending trendline → high-interest sell zone for continuation.
⸻
4. High-Probability Trade Scenarios
📉 A. Trend SELL from Golden Zone (Main Setup)
• Sell Zone: 84,500 – 85,500 (Fib 0.5–0.618 + H1 supply / trendline)
• Initial Targets:
• TP1: 83,500
• TP2: 82,500
• TP3: 81,000
• Extended: 80,600 (prior strong low)
• Stop Loss: Above 86,200
• Confirmation:
• Rejection candle / bearish engulfing in zone
• RSI H1 staying below 55 and MACD crossing back bearish.
• Idea: Primary play is to sell the corrective rally back into the golden zone in line with the dominant downtrend.
⸻
💥 B. Breakout SELL Setup (Continuation)
• Break Sell Trigger (Breaking Price):
• Clean H1 close below 83,450
• Retest Sell Zone: 83,450 – 83,800
• Targets:
• TP1: 82,500
• TP2: 81,000
• TP3: 80,600
• Stop Loss: Above 84,300
• Note: Use if price fails to reach the golden zone and instead breaks the current base directly.
⸻
📈 C. Countertrend BUY from Support (Scalp / Secondary)
• Buy Zone: 83,500 – 83,400 (top of strong support / range low)
• Targets:
• TP1: 84,500
• TP2: 85,500
• TP3: 86,800 (toward top of golden zone / trendline)
• Stop Loss: Below 82,800
• Confirmation:
• Bullish divergence on 15M/5M
• Strong wick rejection from 83.4–83.5k.
• ⚠️ Countertrend only – use reduced risk; objective is to catch corrective leg back into the golden zone.
⸻
🚀 D. Breakout BUY Setup (Structure Shift)
• Break Buy Trigger (Breaking Price):
• H1 close above 85,800 (clear break of Fib 0.618 + channel / supply)
• Retest Buy Zone: 85,800 – 86,000
• Targets:
• TP1: 87,500
• TP2: 89,500
• TP3: 91,300
• Stop Loss: Below 85,000
• Idea: This would be an early trend-change signal; only valid if volume and momentum (RSI > 60 on H1) confirm the break.
⸻
5. Fundamental Watch
• Weekend conditions → thin liquidity & gap risk between Sunday open and Monday session.
• BTC remains highly sensitive to US macro data and risk sentiment (equities, DXY, yields). Any upcoming high-impact USD events next week (CPI, PCE, Fed speakers, etc.) can accelerate either continuation or reversal.
• For swing positions, plan size so you can hold across potential gaps, or close before the weekend if uncomfortable with risk.
⸻
6. Key Technical Levels
• Resistance:
• 84,800
• 85,500–85,900 (Golden Zone upper)
• 87,500
• 90,000
• Support:
• 83,450
• 82,500
• 81,000
• 80,600 (major prior low)
• Golden Zone (Short): 84,100 – 85,900
• Break Buy Trigger: > 85,800 (H1 close)
• Break Sell Trigger: < 83,450 (H1 close)
⸻
7. Analyst Summary
• Structure from D1 to H1 is decisively bearish.
• Current consolidation around 84k looks like a pause within the downtrend, not yet a confirmed bottom.
• The highest-probability play remains selling rallies into the Fib Golden Zone (84.5–85.5k), aiming for new lows towards 82.5–81k → 80.6k.
• Countertrend buys are possible off 83.5–83.4k, but only for quick scalps with tight risk.
⸻
8. Final Bias Summary
• Bearish Bias (Primary):
• Valid while price stays below 85.7–86k.
• Prefer Sell Golden Zone and Breakout Sell < 83,450 setups.
• Bullish Bias (Alternative / Reversal):
• Consider only if H1 closes above 85,800 and retest holds.
• Then target 87.5k → 89.5k → 91.3k with higher-timeframe confirmation.
Manage risk: fixed % per trade, no over-leveraging, and be careful holding full size over the weekend gaps. 🚨
⸻
🥇 ElDoradoFx PREMIUM 3.0 – PERFORMANCE 21/11/2025 🥇
🔥 Precision • Momentum • Profit
━━━━━━━━━━━━━━━
📊 XAU/USD – DAILY RESULTS
🟢 BUY +50 PIPS
🔻 SELL +20 PIPS
🟢 BUY +210 PIPS
🟢 BUY +210 PIPS
🟢 BUY +20 PIPS
❌ SELL -40 PIPS (SL)
🟢 BUY +220 PIPS
🔻 SELL LIMIT +210 PIPS
━━━━━━━━━━━━━━━
🔝 SWING TRADES – STILL RUNNING
📈 BUY → +2,850 PIPS
📈 BUY → +1,320 PIPS
━━━━━━━━━━━━━━━
💰 TOTAL PIPS GAIN: +900 PIPS
🎯 8 Signals → 7 Wins (1 SL)
🔥 Win Accuracy: 88%
━━━━━━━━━━━━━━━
Strong close to the week — perfect blend of scalps, intraday setups, and powerful swing continuation!
Congrats if you profited — PREMIUM 3.0 keeps delivering results! 🚀💰
— ElDoradoFx PREMIUM 3.0 Team 🚀

Long Strategy GuideReconstruction of the macro monetary environment provides support
The US dollar index has dropped below the 100 mark. The US debt/GDP ratio exceeding 130% has weakened the creditworthiness of the US dollar, providing valuation support for risky assets. Although expectations for the Fed's rate cut in December have fluctuated, the trend of implicit liquidity easing has not changed, reducing the opportunity cost of holding Bitcoin. At the same time, the global central bank gold-buying trend highlights the need for hedging, and the high correlation of Bitcoin with the Nasdaq index of 0.8 will benefit from the return of funds from the technology sector simultaneously.
Bitcoin trading strategy
buy:105000-105500
tp:106500-107500
sl:104000

ElDoradoFx – BTCUSD ANALYSIS (09/11/2025, WEEKEND EDITION) (09/11/2025, WEEKEND EDITION)
⸻
1. Market Overview
Bitcoin (BTCUSD) remains under bearish pressure around $101,500, extending its correction from the recent $103,800 recovery peak. Price action confirms a sustained rejection at the $102,600–$103,000 supply zone, with downside continuation now favored as sellers maintain control.
The broader market context shows BTC trapped between the $102,600 ceiling and $99,200 floor, forming a descending channel. Unless bulls reclaim $102,600+, momentum remains bearish heading into next week’s macro calendar (CPI & PPI releases).
⸻
2. Technical Breakdown
🔹 Daily (D1):
• BTC continues trading below the 20EMA, 50EMA, and 100EMA — confirming sustained bearish structure.
• RSI ~38, indicating weak momentum and no signs of trend reversal.
• MACD histogram continues printing red bars, showing continuous sell-side pressure.
• Price remains within a macro range between $99,000–$108,000, with downside favored until structure shifts.
🔹 H1:
• Strong rejection from descending trendline at $102,300–$102,600.
• CHoCH confirmed to the downside below $101,800.
• EMAs aligned bearish (20 < 50 < 200).
• RSI below 45; MACD momentum fading — signals bearish continuation likely.
🔹 15M–5M:
• Structure shows lower highs and weak pullbacks.
• Minor demand zone at $101,000–$100,900; break of this level could trigger a liquidity sweep toward $99,200.
• RSI near 36 with weak MACD cross — short-term bounce possible but unsustainable without strong volume.
⸻
3. Fibonacci Analysis (Last Swing: 103,896 → 99,249)
Level Price (USD) Comment
38.2% 101,037 First retracement / initial resistance
50.0% 101,570 Mid-zone equilibrium
61.8% 102,090 Key reaction level within supply zone
🎯 Golden Zone: 101,000 – 102,090 → Acting as intraday supply zone for high-probability sells.
⸻
4. High-Probability Trade Scenarios
📉 Bearish Continuation Setup (Main Bias)
• Entry Zone: 101,900 – 102,400 (Golden Zone retest)
• TPs: 101,000 → 100,000 → 99,200 → 98,800
• SL: Above 102,600
• Confirmation: Rejection candle + RSI failure to cross 50
• Rationale: Retest of former support turned resistance within descending structure; EMAs and momentum indicators favor continuation.
💥 Breakout SELL Setup
• Trigger: 1H candle close below 100,900
• Retest Zone: 101,100 – 101,300
• TPs: 100,000 → 99,200 → 98,500
• SL: Above 101,600
• Rationale: Structural break of key demand; confirms continuation of broader downtrend.
📈 Countertrend BUY Setup (Low Probability)
• Entry Zone: 99,200 – 98,900 (Liquidity Sweep Zone)
• TPs: 100,800 → 101,600 → 102,400
• SL: Below 98,700
• Confirmation: Bullish divergence on RSI or MACD + absorption wicks
• Rationale: Potential liquidity collection zone where short covering may occur; low conviction long setup.
⸻
5. Fundamental Watch
• Weekend volatility remains thin; potential for stop-hunts before Monday’s open.
• DXY holding above 105 supports bearish sentiment in BTC.
• No major macroeconomic catalysts until early next week — expect range-bound but reactive price behavior.
• CME futures gap near $102,800 could attract a brief fill before resumption lower.
⸻
6. Key Technical Levels
Type Levels (USD)
Resistance 102,400 / 102,600 / 103,000 / 105,800
Support 101,000 / 100,000 / 99,200 / 98,900
Golden Zone 101,000 – 102,090
Break Buy Trigger > 102,600
Break Sell Trigger < 100,900
⸻
7. Analyst Summary
BTC is consolidating under the 102K–103K ceiling, showing clear exhaustion from buyers and renewed strength from sellers. The Golden Zone (101,000–102,090) offers the highest-probability sell opportunities for continuation to 99K.
Momentum, EMAs, and trend alignment all support a bearish outlook unless price cleanly reclaims 102,600+ on H1 structure.
⸻
8. Final Bias Summary
✅ Primary Bias: Bearish below 102K — selling rallies within the 101–102K zone targeting 99K.
⚠️ Secondary Bias: Bullish recovery only if 102,600 breaks with volume and structure shift confirmed.
⸻
— ElDoradoFx PREMIUM 3.0 Team 🚀
ElDoradoFx – BTCUSD ANALYSIS (08/11/2025, ASIA SESSION)1. Market Overview
BTCUSD is trading around $103,800, posting a strong rebound from the $99,200 liquidity sweep earlier in the week. The bullish momentum is driven by the reclaim of short-term structure and EMA crossovers on intraday charts. While the recovery is technically healthy, BTC now approaches critical resistance between $104,800–$105,400, where rejection or liquidity grabs could occur before continuation.
⸻
2. Technical Breakdown
🔹 Daily (D1):
• The daily structure shows a bullish CHoCH from the 99K demand sweep.
• RSI has recovered from oversold (now 41.2), signaling early trend recovery.
• MACD histogram tightening — selling momentum fading.
• Price is still below the 100EMA (~108K), so overall macro bias remains neutral until 105K–108K is cleared.
🔹 H1:
• Clear BOS confirmed with a sequence of higher highs and higher lows.
• EMAs aligned bullish (20 > 50 > 200).
• RSI near 66, showing strong intraday bullish strength.
• MACD positive, confirming momentum favoring the upside.
🔹 15M–5M:
• Strong intraday trend channel formed with consistent BOS toward 103,800.
• RSI approaching 70 — minor exhaustion likely.
• Pullback to 102,200–101,900 expected before next impulsive wave.
⸻
3. Fibonacci Analysis (Last Swing: 99,249 → 103,895)
Level Price (USD) Note
38.2% 102,200 First retracement area
50.0% 101,570 Mid-zone equilibrium
61.8% 100,940 Strong support confluence
🎯 Golden Zone: 102,200 – 100,940 → Potential re-entry area for continuation buys.
⸻
4. High-Probability Trade Scenarios
📈 Bullish Continuation Setup (Main Bias)
• Entry Zone: 102,200 – 100,940 (Fibonacci Golden Zone)
• TPs: 103,800 → 104,800 → 105,400 → 106,000
• SL: Below 100,600
• Confirmation: Bullish engulfing candle or RSI bounce from 50–55
• Rationale: Break of structure + bullish EMA alignment + increasing volume.
💥 Breakout BUY Setup
• Trigger: 1H close above 104,000
• Retest Zone: 103,800–103,600
• TPs: 104,800 → 105,400 → 106,500
• SL: Below 103,200
📉 Bearish Countertrend Setup
• Entry Zone: 104,800 – 105,400 (Major resistance)
• TPs: 103,800 → 103,000 → 102,200
• SL: Above 105,600
• Confirmation: RSI divergence or bearish engulfing candle on H1/H4
• Rationale: Liquidity trap possible at 105K; short-term overextension.
⸻
5. Fundamental Watch
• Weekend sessions = low liquidity → prone to manipulation and stop hunts.
• DXY holding above 105, limiting BTC upside in the medium term.
• No major US macro data releases until early next week (CPI & PPI).
• Expect Asian session volatility spikes between 1 AM–5 AM UTC.
⸻
6. Key Technical Levels
Type Levels (USD)
Resistance 104,000 / 104,800 / 105,400 / 106,000
Support 103,000 / 102,200 / 100,940 / 99,200
Golden Zone 102,200 – 100,940
Break Buy Trigger > 104,000
Break Sell Trigger < 101,000
⸻
7. Analyst Summary
BTC shows a clean short-term bullish reversal from the 99K base, supported by strong momentum and structure recovery. However, traders should watch closely the 104,800–105,400 zone — a key liquidity cluster where potential profit-taking or rejection could occur.
Pullbacks into 102,200–100,940 remain ideal buy-the-dip zones, targeting 105K+ extension. A confirmed H1 close below 101K would invalidate this bullish bias and reintroduce downside risk.
⸻
8. Final Bias Summary
✅ Primary Bias: Bullish above 102K (Buy dips toward 102,200–100,940)
⚠️ Secondary Bias: Bearish only if rejection forms at 105,400 or break below 101K
⸻
🥇 ElDoradoFx PREMIUM 3.0 – PERFORMANCE 07/11/2025 🥇
📅 Precision. Profit. Live Execution.
━━━━━━━━━━━━━━━
🪙 XAU/USD (GOLD)
🔻 SELL +60 PIPS
🟢 BUY +40 PIPS
🟢 BUY +90 PIPS
❌ BUY -40 PIPS (SL)
🟢 BUY +120 PIPS
---
▶ LIVE TRADING SESSION RESULTS
💥 BUY +100 PIPS
💥 BUY +125 PIPS
💥 BUY +150 PIPS
🧠 Our live sessions continue to deliver consistent profits — traders learned in real-time how to identify clean entries, scale in safely, and secure profits like pros.
━━━━━━━━━━━━━━━
💰 TOTAL PIPS GAIN: +645 PIPS
📊 8 Trades → 7 Wins | 1 SL
🎯 Accuracy: 87%
━━━━━━━━━━━━━━━
🔥 Another powerful day for ElDoradoFx Premium 3.0 — combining analysis, education, and execution all in one live environment.
📈 If you’re not joining the live sessions yet, you’re missing real-time profitable setups every day.
👏 Congratulations if you profited! ✅✅✅🚀🚀🚀
— ElDoradoFx PREMIUM 3.0 Team 💼📊
BTCUSD – DAILY PROFESSIONAL ANALYSIS (04 NOV 2025)Prepared by: ElDoradoFx PREMIUM 3.0 Analyst Desk
⸻
🧭 1️⃣ Market Overview
Bitcoin has experienced a strong bearish continuation, breaking decisively below the key structural support at 108,200, confirming a shift in market sentiment. The break of structure (BOS) at 109,600 turned the mid-term bias bearish, with price now testing the psychological level at 100,000.
RSI is at 32 on the daily chart, showing near-oversold conditions, but momentum remains heavy to the downside. Unless bulls reclaim 101,000–102,000, sellers are likely to continue dominating toward 98,600–97,000.
⸻
📊 2️⃣ Technical Breakdown
🔻 Daily (D1)
• Price broke below the long-term ascending trendline from August.
• EMAs aligned for bearish continuation (20 < 50 < 200).
• RSI 32 → weak recovery potential but still room for downside liquidity sweep.
→ Interpretation: Bears fully in control until 102,000 is reclaimed.
🔻 1-Hour (H1)
• Descending channel intact; price rejected from supply zone 101,200–101,600.
• RSI hovering around 30–40; possible minor retracement before further drop.
• MACD still printing red histogram bars → bearish momentum active.
→ Interpretation: Look for short opportunities near resistance retests.
⚠️ 15M–5M (Intraday)
• Price formed a small double bottom near 99,550, showing temporary relief bounce.
• RSI rebounding, but no confirmation of reversal.
• EMA50 (H1) around 101,000 acting as dynamic resistance.
→ Interpretation: Possible short-term correction before continuation down.
⸻
📐 3️⃣ Fibonacci Analysis
Swing Range: 104,839 → 99,559
Level Price Observation
38.2% 101,455 Minor retracement zone
50.0% 102,200 Key confluence with EMA50
61.8% 102,950 Strong resistance zone for potential short re-entry
✅ Golden Zone: 101,455 – 102,950
This is the ideal sell re-entry area if price pulls back.
⸻
🎯 4️⃣ High-Probability Trade Scenarios
🔻 SELL SETUP (PRIMARY BIAS)
Scenario A – Golden Zone Retest
• Entry: 101,455–102,950 (Fibonacci + EMA confluence)
🎯 TP1 → 100,000 TP2 → 99,000 TP3 → 97,000
🛑 SL → Above 103,300
Scenario B – Continuation Breakout
• Trigger: Break & retest below 99,550
🎯 TP1 → 98,600 TP2 → 97,000 TP3 → 95,800
🛑 SL → Above 100,300
⸻
🟢 BUY SETUP (ALTERNATIVE SCENARIO)
Scenario A – Support Reversal Zone
• Entry: 99,550–98,600 (if strong bullish reaction with engulfing candles)
🎯 TP1 → 101,000 TP2 → 102,000 TP3 → 103,000
🛑 SL → Below 98,200
⸻
🕐 5️⃣ Fundamental Watch
• US yields rising and DXY strengthening above 105.2 → bearish pressure on BTC.
• Market sentiment risk-off due to global equity weakness.
• Watch upcoming US Unemployment & CPI data — could trigger volatility reversal.
⸻
⚙️ 6️⃣ Key Technical Levels
Type Levels
Resistance 101,455 / 102,200 / 102,950
Support 99,550 / 98,600 / 97,000
Golden Zone 101,455 – 102,950
Breakout Confirmation Below 99,550 or Above 103,000
⸻
🧾 7️⃣ Analyst Summary
BTC confirmed a bearish structure, with short-term retracements expected toward the Golden Zone (101,455–102,950) before further downside continuation. Momentum indicators still favor sellers, though oversold readings could create minor pullbacks. Until 103,000 is broken to the upside, bias remains bearish.
⸻
📈 8️⃣ Final Bias Summary
🔻 Bearish below 102,000 → Targets 99,000 / 97,000 / 95,800
🟢 Bullish only above 103,000 → Targets 104,800 / 106,000
⸻
— ElDoradoFx PREMIUM 3.0 Team 🚀

Today's Bitcoin Trading StrategyBitcoin triggers bearish warning: Technical pattern breaches + liquidation of long positions, aiming directly at the psychological threshold
The technical indicators are all bearish, and the rebound is weak.
Looking at the chart, it's clearly visible that all the short-term moving averages are above the price, forming a "bearish arrangement" - it's like multiple layers of ceilings pressing down, and the price simply doesn't have the strength to rise any further. Moreover, the 200-day moving average (107,846 USD) has now become a strong resistance level. The previous several rebounds failed to break through it, and now the price is moving further away from this average, making the rebound even more difficult. Additionally, from the historical trend, Bitcoin is currently trapped between the 200-day moving average and the 365-day moving average (100,367 USD). If this lower boundary of the range is broken, it is very likely to accelerate the decline.
The risk of liquidating long positions is emerging, which may trigger a chain reaction of declines.
There are still a large number of long positions bought in the range of 105,000 - 106,000 USD in the market. Now these positions are already in a loss state. If the price continues to fall below 103,000 USD, these long positions will be forcibly closed (that is, the long positions will be wiped out), and the selling pressure from the forced closure will further push down the price, forming a vicious cycle of "decline - liquidation - further decline". There have been precedents before, where after breaking through a key support level, 500 million USD of long positions were liquidated. This time, the risk is also not small.
Today's Bitcoin Trading Strategy
sell:104000-104500
tp:103000-103500
sl:105000
ElDoradoFx – BTCUSD WEEKEND ANALYSIS (02/11/2025, US SESSION)
🧭 1️⃣ Market Overview
Bitcoin retraced after testing the intraday resistance near 111,238, facing rejection at the upper boundary of the descending channel. Price remains supported above 110,000, respecting both the dynamic ascending trendline and 200 EMA on intraday charts. Momentum has cooled but the market still holds a mildly bullish structure unless 109,700 breaks. Volatility is expected to remain moderate heading into early-week sessions.
⸻
📊 2️⃣ Technical Breakdown
✅ Daily (D1)
• Structure: Rangebound between 108,300 and 111,800.
• EMAs: Price hovering between 50 and 200 EMA, equilibrium zone.
• RSI (47): Neutral – no divergence.
• MACD: Histogram flattening; momentum loss after prior bullish impulse.
→ Interpretation: Consolidation phase, waiting for directional breakout.
✅ 1-Hour (H1)
• Clean BOS from 109,600 led to impulsive rise to 111,200.
• Currently retracing toward the 50 EMA and trendline support.
• Key support: 110,100–109,900.
→ Interpretation: Market retesting support after profit-taking; potential bullish re-entry if structure holds.
✅ 15M–5M (Intraday)
• Price rejecting 111,238 and forming short-term lower highs.
• RSI rebounding from 35 – possible micro bullish correction.
• MACD showing first red bars, indicating short-term retracement nearing exhaustion.
→ Interpretation: Possible liquidity sweep around 110,000 before upward continuation.
⸻
📐 3️⃣ Fibonacci Analysis
Swing Range: 109,703 → 111,238
Level Price Observation
38.2% 110,671 Minor support zone
50.0% 110,470 Golden mid-level + EMA confluence
61.8% 110,268 Trendline & structural confluence
✅ Golden Zone: 110,671 – 110,268 (high-probability buy zone)
⸻
🎯 4️⃣ High-Probability Trade Scenarios
🟢 BUY SCENARIOS (Primary Bias)
Scenario A – Golden Zone Reversal (Ideal Setup)
• Entry Zone: 110,671 – 110,268
🎯 TP1 → 111,000 TP2 → 111,238 TP3 → 111,800
🛑 SL → Below 109,900
Scenario B – Breakout Continuation
• Trigger: Break & retest above 111,238
🎯 TP1 → 111,800 TP2 → 112,200 TP3 → 112,800
🛑 SL → Below 110,800
⸻
🔻 SELL SCENARIOS (Alternative)
Scenario A – Breakdown from Structure
• Trigger: Break & retest below 109,700
🎯 TP1 → 109,200 TP2 → 108,600 TP3 → 108,000
🛑 SL → Above 110,200
Scenario B – Rejection from 111,200–111,400 Zone
• Trigger: Bearish engulfing candle rejection.
🎯 TP1 → 110,600 TP2 → 110,000
🛑 SL → Above 111,500
⸻
🕐 5️⃣ Fundamental Watch
• Weekend volatility lower than average; price reactive to liquidity sweeps.
• DXY steady near 104.8 – neutral macro tone.
• ETF accumulation flows remain supportive for mid-term trend.
• Watch US macro data midweek (PMI & NFP) for volatility spikes.
⸻
⚙️ 6️⃣ Key Technical Levels
Type Levels
Resistance 111,238 / 111,800 / 112,200
Support 110,268 / 109,900 / 109,700
Golden Zone 110,671 – 110,268
Breakout Confirmation Above 111,238 or Below 109,700
⸻
🧾 7️⃣ Analyst Summary
BTC continues consolidating within a controlled retracement phase, currently resting in the Golden Zone (110,671–110,268) that aligns with the ascending trendline. Holding above this range favors bullish continuation, while a confirmed break below 109,700 would open downside space. Short-term trades favor long positions within the zone, targeting 111,200–111,800.
⸻
📈 8️⃣ Final Bias Summary
🟢 Bullish bias above 110,200 → Targets 111,200 / 111,800
🔻 Bearish bias below 109,700 → Targets 108,800 / 108,000
⸻

BTC/USD Long Setup: RBR Zone Retest After Channel BreakoutTechnical Structure
Rising Channel (Highlighted in Red):
Price was moving within a bullish channel.
The channel was broken to the upside, indicating strong bullish momentum.
RBR Zone (Rally-Base-Rally):
A demand zone marked in red.
This area acts as a support zone where price is expected to bounce after a pullback.
It's the ideal entry area according to this strategy.
Current Price:
BTC/USD is trading around 117,910.63.
The price has just broken out of the channel and is expected to retest the RBR zone.
🎯 Trade Setup
Label Price Level Description
Entry Point 116,772.43 Ideal buy level after retest of RBR zone.
Stop Loss 116,077.82 Below the RBR zone. Gives room for a fakeout.
Target Point 120,013.92 Profit target based on the projected move.
📊 Risk to Reward Ratio (RRR)
Let's calculate the approximate Risk:Reward:
Risk: 116,772.43 - 116,077.82 = 694.61 points
Reward: 120,013.92 - 116,772.43 = 3,241.49 points
✅ Risk:Reward ≈ 1:4.67, which is excellent.
🔄 Expected Price Action
The chart suggests the following scenario:
Price breaks out of the bullish channel.
It retraces back into the RBR zone.
It finds support near the entry level.
A bounce follows, pushing BTC toward the target level of ~120,000.
📌 Summary
✅ Bullish setup after breakout from a rising channel.
✅ RBR demand zone suggests strong support at the entry.
✅ RRR is favorable (~1:4.67) — a good reward for the risk taken.
⚠️ Risk: If price drops below the stop loss zone, the trade idea is invalid.

Fed rate cut in focus: Bitcoin eyes new ATHFed rate cut in focus: Bitcoin eyes new ATH
Markets are on edge ahead of today’s Fed decision, with a 25 bps cut to 4.1% widely expected. Traders see this as fuel for risk assets, though surprises could trigger sharp moves. Bitcoin leads the pack, backed by $230M ETF inflows and growing dominance over alts. Still, strong sell walls at $117K–119K signal heavy resistance.
Support remains firm at $111K–113K, where fresh demand continues to absorb supply from large holders. Momentum indicators show strength, similar to Q2 when BTC rallied from $105K to $120K.
Altcoins stay in the background: ETH faces outflows and struggles to hold above $4,500, while SEC delays on new ETF applications weigh on sentiment. Other majors like Solana and Ripple could see inflows if BTC stabilizes, but downside risks remain high if expectations disappoint.
