LOOK OUT FOR BITCOIN NEXT HIGH PROBABILITY MOVES SOON!!!🚨BTC HIGH PROBABILITY SETUPS 🚨
* Here We Can See Clearly The Next Potential Moves For BTCUSD Coming Hours/Days.
* Keep Your Eyes Close On Your Trading Positions.
* Happy PIP Hunting Traders.
FXKILLA.
Btcusdtidea

BTCUSD: Is This Consolidation Building the Next Expansion?Bitcoin has transitioned from a strong impulsive selloff into a more compressed and irregular price structure, suggesting the market may be shifting from panic-driven movement into recalibration. Momentum has slowed, but volatility remains present, indicating that participation has not fully exited the market.
This type of price behaviour often appears when short-term direction becomes unclear and liquidity begins to rebalance ahead of a larger decision. Rather than a clean continuation, the structure currently reflects uncertainty, a common precursor to a sharper move once conviction returns.
The coming sessions should provide greater clarity as Bitcoin approaches a point where patience, not prediction, becomes the key advantage.
**Disclosure:** We are part of Trade Nation's Influencer program and receive a monthly fee for using their TradingView charts in our analysis.

$BTC/USDT ANALYSISOn the 2-hour chart, BINANCE:BTCUSD is still trading inside a wide consolidation range, but the overall structure shows a slow upward trend supported by the rising diagonal trendline below the price. Every time BTC has dipped toward that ascending line, buyers have stepped in and pushed it back up, which means the market is still respecting bullish pressure from the bottom. On the upside, the main problem remains the heavy supply zone around 93,500 to 94,500, where price has repeatedly rejected and failed to break through. Each attempt into that zone has triggered selling and pulled the market back down, showing that sellers are still defending this level strongly. At the moment, price is sitting near the mid-range, recovering after a sharp drop, but it has not shown any clean breakout or breakdown yet. As long as the ascending support trendline holds, the market stays in a slow bullish structure, but unless BTC breaks above the 94,500 zone with strength, the chart will continue to move sideways between support and resistance.

BTCUSD: What’s Loading Here?Bitcoin has extended its drop and is now forming an interesting structure around current levels. The recent slowdown suggests a potential corrective phase developing after the sharp decline. While momentum remains weak for now, the broader flow hints that the market may be preparing for its next significant move once this consolidation completes. With volatility compressing, the next impulsive leg could unfold sooner than expected, making this setup worth watching closely.
**Disclosure:** We are part of Trade Nation's Influencer program and receive a monthly fee for using their TradingView charts in our analysis.

#BITCOIN: Still Expecting Price To Touch $60K To $65K! Bitcoin is likely to drop further down before we could see a strong bullish move taking price to all time high. This is our view only and it is not an guaranteed move; once price touch our reversal zone then we could see price going back to all time high. Good luck and trade safe!
Team Setupsfx_
Like And Comment Our Ideas For More Such Educational content! 📊🚀

BTCUSD: Wave rhythm on the verge of impulseBased on the current structure, Bitcoin is completing its corrective phase and is preparing to form a new impulse. The chart shows a transition from sideways movement to a more dynamic wave, which could set the direction for the near term.
Primary scenario: after the correction ends, a downward impulse sequence is expected to develop. Alternative scenario: if the market consolidates above recent highs, it could continue to rise, delaying the start of a new downward wave.
Idea for traders: watch for confirmation of the structure on lower timeframes and enter only after clear reversal signals appear.
Friends, more wave analysis is available in our profile.
Subscribe to stay up to date with wave analysis!

BTCUSD: Wave Pendulum on the Verge of ReversalBTCUSD: Wave Pendulum on the Verge of Reversal
BTCUSD Wave Overview (H4/D1)
According to its wave structure, Bitcoin is completing its corrective phase and preparing to form a new impulse. Current dynamics indicate a possible end to the sideways movement and a transition to the final wave of a larger cycle.
Primary scenario: A downward impulse sequence is expected to develop after the correction is complete. Alternative scenario: If the market consolidates above recent highs, it could continue to rise, delaying the start of a new downward wave.
Idea for traders: watch for confirmation of the structure on lower timeframes and enter only after clear reversal signals appear.

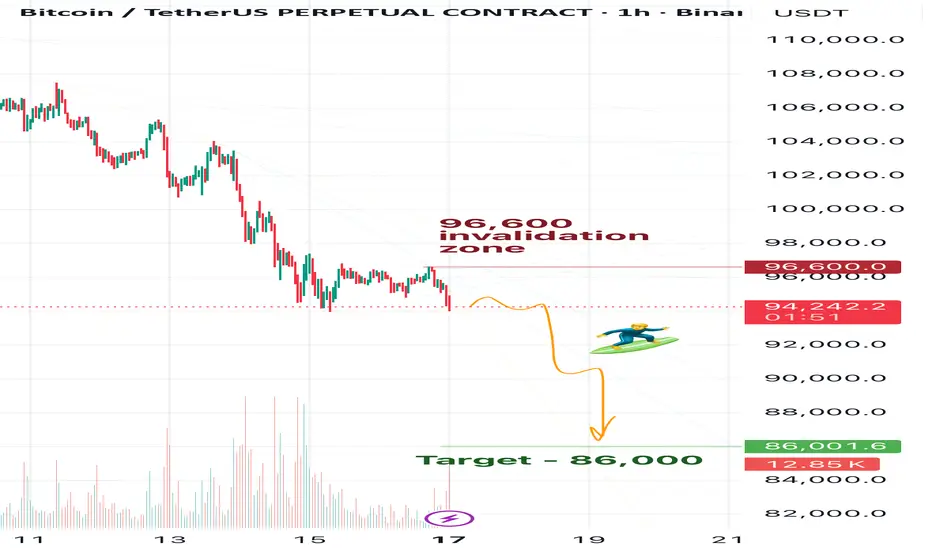
BTC Daily View 17.11Friends, as you may remember from my previous Bitcoin updates, I’m expecting BTC to reach 83k. At the moment, in my view, Bitcoin is already preparing for this move down.
However, for now my main target is 86k — I think BTC currently has enough momentum only to drop to that level. Before we see 83k, it will likely need to build more energy.
So after hitting 86k, I expect a correction — probably a prolonged one. But let’s see what the market gives us.
🎯For now, my target remains 86k.
❌Invalidation zone: 96,600
⚠️Disclaimer:
This is not financial advice. Please make your own decisions according to your own trading rules, and never trade without stop-losses.
🗯️If you find my ideas helpful, please leave a reaction and write a comment — your support really matters to me
ANFIBO | BTCUSD - $94.000 or $70.000? [11.6.2025]Hi traders, Anfibo's here!
BTCUSD – Technical Outlook
Technical Structure:
Price action currently respects a descending channel, with:
- Upper boundary (resistance): around $106,000 – $107,000
- Lower boundary (support): converging with the D1 trendline and the 0.618 Fibonacci retracement zone, located between $94,000 – $95,000
This confluence area at $94,000 – $95,000 will be crucial. It not only represents technical alignment between multiple structures (Trendline + Fibonacci) but also marks the boundary where short-term sentiment could shift from corrective to impulsive.
Trading Strategy:
Our tactical approach remains straightforward and adaptive:
“Trade the trend when touched – reverse the bias if the trend breaks.”
#1 – Rejection at Upper Boundary:
Should BTC retest the 106–107k resistance and fail to break through, short-term sell opportunities may arise targeting the mid-range or lower boundary (95k region).
#2 – Reaction at Lower Boundary:
If price reaches the 94–95k support zone and holds, this area could offer high-probability long entries, particularly if accompanied by bullish divergence or strong volume confirmation.
#3 – Breakdown of Structure:
A clean break below $90,000 would signal structural weakness, exposing BTC to the next major support cluster between $80,000 and $70,000. Such a move would represent a deeper corrective leg in the broader cycle and could reset the market’s medium-term trend.
Trading Plan:
>>> SELL ZONE: (x1000)
ENTRY: 106 - 108
SL: 109
TP: 95
>>> BUY ZONE:(x1000)
ENTRY: 93 - 95
SL: 90
TP: 120
Risk Management:
- Stick to small-to-medium positions within the range; increase size only on confirmed breakouts.
- Keep stops tight, as sideways phases tend to trigger false signals.
- Maintain Risk:Reward ≥ 1:2 and avoid overtrading in choppy conditions.
- Reassess bias once the channel is clearly broken.
Conclusion:
BTC is currently in a compressed, corrective phase, moving within a defined range. The key battleground lies between $95,000 and $107,000. Traders should remain flexible, respecting both boundaries of the channel and reacting based on breakout confirmations rather than anticipation.
As long as BTC holds above the $94,000 – $95,000 confluence, the broader bullish structure on the daily timeframe remains intact. However, a decisive break below $90,000 would open the door for a larger-scale correction toward the $80,000 - $70,000 zone—where long-term accumulation could once again become attractive.
GOODLUCK GUYS!!!

#BTCUSDT: From $74,000 to $88,000 Moving Well! More Growth CominIt’s been on a steady climb from $74,000 to $88,000. We’re expecting even more growth in the coming weeks. The price has finally broken free from its consolidation phase and is now on the rise. We think it’ll reach $94,000, then $100,000, and maybe even go up to $120,000 by the end of the year.
What do you think? Let me know in the comments below!
Thanks!
Team Setupsfx_

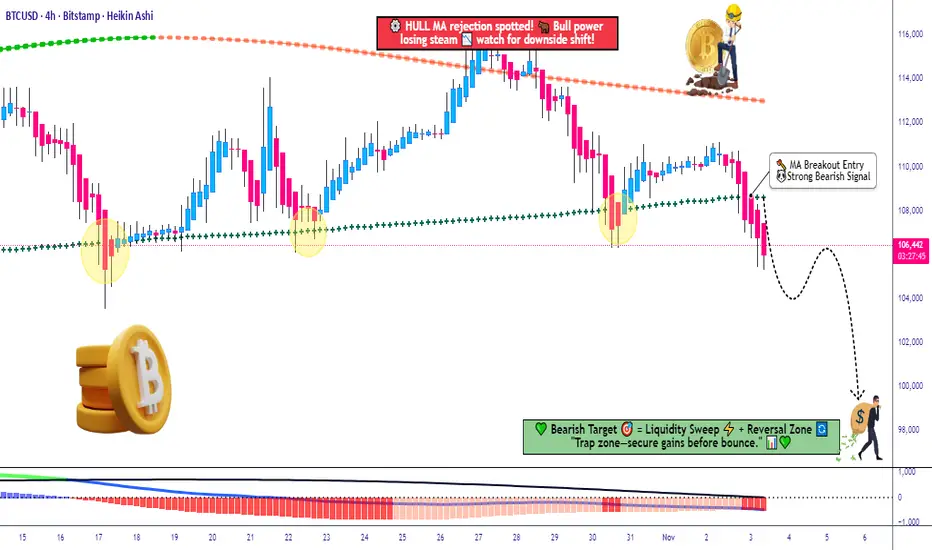
BTC/USD Breakdown Alert — MA Cross & MACD Flash Warning!💰 BTC/USD — “BITCOIN vs U.S. DOLLAR” | Crypto Market Capital Flow Blueprint (Swing Trade)
🧭 Market Overview
The king of crypto 👑, Bitcoin, is showing signs of fatigue at the top. After a solid bull sprint, we’re spotting bearish confirmation on multiple signals — a clean moving average breakout and a MACD divergence to the downside.
Looks like the market’s whispering, “It’s time for a cool-down, mate.” 😏
🎯 Trade Plan (Swing Setup)
Plan: ✅ Bearish plan confirmed — waiting for continuation pressure below structure zones.
Entry Strategy (Thief Layer Method 🕵️♂️):
Using layered limit sell orders — a signature “Thief Strategy” style of scaling in with patience, precision, and a bit of chaos theory.
Sell Limit Layers: 110,000 💸 → 108,000 💸 → 106,000 💸
(You can expand the layer grid as per your risk model.)
Stop Loss: 112,000 — positioned above the previous Higher High (HH) structure.
📝 Note: Dear Ladies & Gentlemen (Thief OG’s), I’m not recommending you to stick to my SL. Manage risk your way — you make money, you take money. 💼
Target: 98,000 — based on strong support, oversold confluence, and a potential liquidity trap zone below.
📝 Note: Same rule — take profits where it makes sense for you. The trap is the escape; don’t overstay the party. 🎭
🔍 Technical Confluence Highlights
📉 MA Breakout: Bears gaining control after crossover rejection.
📊 MACD Divergence: Weak momentum confirmed — watch histogram fade.
Structure Check: Market respecting descending trendline — sellers defending upper zone.
🧩 Momentum Flow: Smart money possibly rotating out of BTC into defensive assets.
🌍 Correlated Pairs to Watch
Keep an eye on these related assets for directional cues and correlation strength:
BITSTAMP:ETHUSD (Ethereum) — often mirrors BTC’s moves with higher beta.
TVC:DXY (U.S. Dollar Index) — rising DXY can pressure BTC.
PEPPERSTONE:NAS100 (NASDAQ 100) — tech sentiment affects BTC risk appetite.
CRYPTOCAP:BTC.D (Bitcoin Dominance) — watch if altcoins start outperforming.
✨ “If you find value in my analysis, a 👍 and 🚀 boost is much appreciated — it helps me share more setups with the community!”
#BTCUSD #Bitcoin #CryptoMarket #SwingTrade #TechnicalAnalysis #ThiefStrategy #BearishSetup #CryptoTrading #MarketFlow #LayeredEntries #SmartMoney #TradingView #EditorPickCandidate #BTCAnalysis
Macro liquidity benefits have taken effectThe US Senate has reached an agreement to end the federal government's "shutdown", extending the funding until January 30th next year. This shutdown had led to a tightening of liquidity in the money market, and with the agreement reached, TGA funds will be gradually released, directly improving the market liquidity environment. As a risk asset sensitive to liquidity, Bitcoin has responded first, breaking through the $106,000 whole number level. The expectation of loose liquidity will continue to provide upward momentum in the future. At the same time, the market expects a higher probability of the Fed cutting interest rates in December, further reducing the opportunity cost of holding Bitcoin.
Bitcoin trading strategy
buy:105000-105500
tp:106000-106500
sl:104000

Educational BTC Analysis: Decoding BTC's Wave (C) DownHello Friends, Welcome to RK_Chaarts.
Today we are going to understand Elliott Wave Teaching Points from the BTCUSD Daily Chart,
This chart sequence perfectly illustrates the difference between motive (impulse) and corrective waves, as well as the important structures and rules of a larger correction.
1. The Structure of a Corrective Pattern (A-B-C)The Big Picture: The overall movement, labeled Intermediate Wave (A), (B), and (C) (Blue), is a three-wave corrective pattern. This type of pattern moves against the trend of one larger degree (which have been an uptrend). The three-wave (A-B-C) structure is the classic way markets move in a counter-trend. Wave (A): The initial counter-trend move.Wave (B): A bounce or retracement that moves back in the direction of the previous trend, but fails to reach the start of Wave (A).Wave (C): The final, and often most powerful, leg of the correction, which is designed to complete the retracement. This wave is always structured as a five-wave impulse.
2. The Rule of Subdivisions: Corrective Waves are Internally Motive, Wave (C) is an Impulse: The report states that Intermediate Wave (C) is expected to unfold as a five-wave impulse sequence of a Minor Degree (Red) (Minor Wave 1, 2, 3, 4, 5).
Learning Point: This highlights a fundamental Elliott Wave rule: the C-wave of an A-B-C correction is a motive wave (it has a five-wave internal structure) because its purpose is to create strong directional progress and complete the larger correction. This is commonly known as a Zigzag correction (which has a 5-3-5 internal count for A-B-C).
3. Identifying the Strongest Move (Wave 3)
The Current Phase: The market is currently in Minor Wave 3 (Red) downwards.
Learning Point: In Elliott Wave theory, Wave 3 is typically the longest and never the shortest of the three motive waves (Waves 1, 3, and 5). This means the analysis anticipates the current move to be the most directional, high-momentum, and volatile part of the entire Intermediate Wave (C) correction. This is the "sweet spot" for trend traders.
4. The Principle of Alternation (Predicting Wave 4)
Upcoming Wave: The analysis projects a shallow Minor Wave 4 (Red) rebound.
Learning Point: While the chart doesn't show Wave 4 yet, this prediction is often guided by the Principle of Alternation. If the preceding corrective wave (Minor Wave 2) was a sharp, deep correction, the next corrective wave of the same degree (Minor Wave 4) is expected to be a sideways, shallow, or complex correction (like a flat or triangle). The prediction of a "shallow" wave 4 suggests Minor Wave 2 was likely a deeper, sharper retracement.
5. The Critical Invalidation Rule
The Invalidation Level: The report sets the critical invalidation price at 74,223, which represents the low or starting point of wave ((1)).
Learning Point: Wave ((2)) can never retrace more than 100% of Wave ((1)). By identifying a specific price level, we can assume that our study says price should not broke below that particular level, it provides traders with clear risk management parameters.
I. Current Wave Count Status
The analysis indicates that the previous upward corrective structure, designated as Intermediate Degree Wave (A) and Wave (B) (Blue), is complete. The market is now engaged in a significant downward movement within the larger Intermediate Degree Wave (C) (Blue).
This Intermediate Wave (C) is expected to unfold as a five-wave impulse sequence of a Minor Degree (Red) to the downside, fulfilling the final leg of the overall corrective cycle.
II. Detailed Downward Projection
The Minor Degree five-wave structure within Intermediate Wave (C) is currently positioned as follows:
Minor Wave 1 and Minor Wave 2 (Red): These waves are identified as complete.
Current Phase: The market is now unfolding Minor Wave 3 (Red) downwards, indicating the strongest portion of the bearish move is in progress.
Anticipated Completion: Following the completion of Minor Wave 3, the analysis projects a shallow Minor Wave 4 (Red) rebound, followed by the final impulse move, Minor Wave 5 (Red), to complete the entire Intermediate Wave (C) correction.
The ultimate completion of Intermediate Wave (C) will signal the end of the larger-degree correction (labeled as a corrective wave (2)).
III. Critical Invalidation Level
The integrity of this bearish wave count is contingent upon the price action respecting a critical support level.
Invalidation Price: 74,223
Significance: This price point represents the extreme low or starting point of wave ((1)), so Wave ((2)) correction Should not breach this level as per wave principles, if it makes lower low below 74,223 on the lower side, the current Elliott Wave analysis would be invalidated, requiring a revision of the entire wave structure and market outlook.
I am not Sebi registered analyst.
My studies are for educational purpose only.
Please Consult your financial advisor before trading or investing.
I am not responsible for any kinds of your profits and your losses.
Most investors treat trading as a hobby because they have a full-time job doing something else.
However, If you treat trading like a business, it will pay you like a business.
If you treat like a hobby, hobbies don't pay, they cost you...!
Hope this post is helpful to community
Thanks
RK💕
Disclaimer and Risk Warning.
The analysis and discussion provided on in.tradingview.com is intended for educational purposes only and should not be relied upon for trading decisions. RK_Chaarts is not an investment adviser and the information provided here should not be taken as professional investment advice. Before buying or selling any investments, securities, or precious metals, it is recommended that you conduct your own due diligence. RK_Chaarts does not share in your profits and will not take responsibility for any losses you may incur. So Please Consult your financial advisor before trading or investing.

Today's Bitcoin Trading StrategyThe three core contradictions of "rebound momentum exhaustion + leveraged structure fragility + reversal of capital flow" provide clear anchors for the bearish logic.
1.The rebound momentum is nearing its end: This round of rebound, which started at $110,800, has reached the key resistance level of $114,200 at the lower edge of the previous oscillation range. From the trend rhythm, the rebound has three times attempted to break through $114,000 but failed to form an effective breakthrough, and each time after the peak, the rebound speed has accelerated, indicating that the upward momentum of the bulls is continuously weakening, and the short-term correction pressure has accumulated to a certain extent.
2.Leverage positions carry hidden risks: According to Coinglass data, the unliquidated position of perpetual contracts increased by 18% to $62 billion during the rebound period, but the trading volume only increased by 7% in tandem, forming an imbalance of "volume contraction and position increase". Currently, the leverage ratio of retail investors has risen to 7.5 times, approaching the recent liquidation threshold, and although the ratio of long and short positions has dropped to 1.4:1, it is still higher than the average of the past three months at 25%. The fragility of leveraged funds has laid a hidden danger for the correction.
3.Clear signal of capital flight: Chain data shows that short-term profitable addresses holding BTC for 1-3 months sold a net of 18,000 BTC on the same day. The net inflow of Bitcoin in exchanges increased by 60% month-on-month, indicating that the profit positions are accelerating their departure. At the same time, the net outflow of funds from Bitcoin ETF reached $230 million in a single day, turning negative for the first time in the past week, and the short-term allocation demand of institutions has cooled down, further weakening the price support.
Today's Bitcoin Trading Strategy
sell:114000-114500
tp:113000-113500
sl:115000

The buying opportunity is clearerThe current price of $111,286 is in a stage of oscillation and accumulation. On the surface, it seems to be fluctuating without direction, but in reality, there is a solid support below. The bulls have sufficient confidence. The main reasons are two:
The "supporting force" below is very stable: After Bitcoin dropped from $12.6 million to over $10.4 million recently, it quickly rebounded. This indicates that there is a strong support at around $10.5 million. Around $110,000 is the "transitional station" of the recent correction, and when it drops to this level multiple times, there will be funds entering to take over, and the selling pressure has been released to a large extent. In addition, 80% of Bitcoin is held for more than one year, and holders are reluctant to sell easily, further strengthening the bottom.
Institutions are still continuously "purchasing": The Bitcoin ETFs of giants like BlackRock have been accumulating shares. The highest weekly inflow can reach $324 million. Currently, the Bitcoin held by these ETFs already accounts for 6.74% of the total supply. More importantly, the amount of Bitcoin purchased by institutions each day is far more than the new Bitcoin mined by miners. There are fewer and fewer Bitcoin available for trading in the market. As long as the buying pressure slightly increases, the price is likely to rise.
Today's Bitcoin Trading Strategy
BTC @ BUY109000-111000
tp:112000-113000
sl:107000

BTCUSD 4H Bullish setup BITSTAMP:BTCUSD is holding above the ascending trendline (white) and trading within the mid-range of a multi-band channel, showing early bullish continuation potential.
🟢 Bullish Confluences
Trendline Support: The ascending white trendline acts as dynamic support — price recently bounced cleanly from it, suggesting buyers are defending higher lows.
EMA/Band Crossover: The green EMA ribbon has turned upward and crossed above the brown mid-band zone, showing strengthening momentum.
Higher Low Formation: Recent candles confirm a higher low around $110,400, indicating accumulation before a potential breakout.
Mid-Band Retest Successful: Price is consolidating above the mid Bollinger zone — often a signal that volatility compression could precede an upside expansion.
Momentum Shift: The 4H candle bodies are closing above short-term moving averages, reinforcing short-term bullish control.
🎯 Fibonacci Extension Targets (from the recent swing low ≈ $110,400 to swing high ≈ $111,900):
1.272 $113,060 Minor resistance / first take-profit level.
1.618 $113,660 – $114,000 Mid-extension target; aligns with upper channel resistance.
2.0 $115,760 – $116,000 Full bullish extension

Today's Bitcoin trading strategyWhere is the confidence to go long?
There is no need to worry about "whether it will fall". Now there are three clear signals supporting the long position, and the risks are controllable:
Large funds are "holding the bottom", and the price won't fall: Several major global institutions are buying, an American pension fund increased its position by 800 million US dollars in a single week, the largest Bitcoin ETF has invested 500 million US dollars in three days - these funds will not cause a sharp price drop. When it fell to 106,000, it was pulled back because large funds stepped in to take over. Below 108,000 is basically a "safe zone".
Regulation "doesn't cause chaos", but gives confidence: The EU just set rules for Bitcoin transactions, platforms need to register and the flow of funds should be transparent. Many investors feel that "it's formalized and they can enter now"; although some countries in Asia have inspected illegal platforms, it did not trigger a sharp drop, indicating that the market is not afraid of such minor negative events, and the sentiment is improving.
Ordinary investors are "waiting to buy bottom", and there are buyers: Many people think that from 102,000 to 109,700 is not the peak yet, they are waiting for a correction to around 108,000 to enter, so every time it drops to 108,500, there is buying coming in, it won't keep falling - this is equivalent to adding a "buffer" for the long position, not worrying that after buying, there will be no one to take it over.
Today's Bitcoin Trading Strategy
BTC @ buy :108000-109000
tp:110000-111000
sl:106000
Today's Bitcoin trading strategy, I hope it will be helpful to yGlobal Regulatory Developments
The G20 has recently released the Cross-Border Regulatory Framework for Crypto-Assets, which explicitly requires the implementation of full-process filing for Bitcoin transactions by 2026. The U.S. Securities and Exchange Commission (SEC) has initiated 3 additional lawsuits against non-compliant cryptocurrency exchanges. The European Union's MiCA 2.0 Regulation classifies Bitcoin as a "high-risk crypto-asset" and lowers the leverage limit for individual investors to 3x. This tightening regulatory environment has directly dampened bullish sentiment in the market.
Liquidity Environment
The U.S. Federal Reserve has maintained the federal funds rate at a high range of 5.25%-5.5%. The 10-year U.S. Treasury yield has exceeded 4.8%, prompting capital outflows from global risk assets back to U.S. dollar-denominated assets. According to data from CoinGecko, Bitcoin ETFs recorded a net outflow of $1.2 billion in October, marking the largest monthly outflow since March 2024. This tightening liquidity has further intensified downward pressure on Bitcoin's price.
Today's Bitcoin Trading Strategy
BTC@sell:109000-109500
pt:107000-106500
sl:112000

ElDoradoFx PREMIUM – BTCUSD ANALYSIS (18/10/2025)Prepared by: ElDoradoFx Premium 2.0 Analyst Team
⸻
🧭 Market Overview
Bitcoin is trading around 107,000, attempting to stabilize after a sharp drop from 115,800 earlier in the week.
The daily structure has shifted bearish, following consecutive rejections from the descending trendline and a clean break below the 200 EMA.
However, price is now sitting near a major weekly demand zone (106,300–106,000), aligned with the 1D Golden Zone retracement.
This weekend, the market is expected to consolidate before deciding whether to extend the bearish trend or attempt a technical rebound.
⸻
📊 Technical Breakdown
1️⃣ Daily Chart (D1)
• Structure: Short-term bearish — lower highs and lower lows formed after 115,800 rejection.
• MACD: Strong red histogram; momentum favors sellers.
• RSI: 36.5 → Oversold area, early signs of exhaustion.
• 200 EMA: Recently broken at 107,900 → now acting as dynamic resistance.
• Key Support: 106,300–106,000 (last swing + Golden Zone).
Bias: Bearish to neutral; possible retracement toward 108k before continuation lower.
⸻
2️⃣ 1-Hour Chart (H1)
• Structure: Price is consolidating below descending trendline from 110,000.
• EMA50 < EMA200 → bearish alignment, but short-term rebound visible.
• MACD: Positive momentum beginning to build after strong histogram recovery.
• RSI: 50.1, showing neutral mid-range — space for a minor bullish correction.
Bias: Intraday corrective bullish move likely toward 107,800–108,000 resistance.
⸻
3️⃣ 15M–5M Chart (Intraday Momentum)
• Structure: Higher lows forming from 106,400 → 106,900 → 107,000.
• RSI rising above 55; MACD histogram bullish → short-term recovery pattern.
• Resistance: 107,450–107,800 (FVG + trendline intersection).
• Support: 106,500–106,300 (EQL + demand zone).
Bias: Short-term buy pressure into resistance, watch for rejection near 108k.
⸻
📐 Fibonacci Analysis
Last Swing: 115,800 → 106,300
• 38.2% → 109,820
• 50.0% → 111,050
• 61.8% → 112,280
📊 Golden Zone: 111,050–112,280
→ Expect major sell reaction if price retraces into this area next week.
⸻
🎯 High-Probability Trade Scenarios
✅ BUY SCENARIO (Short-Term Correction)
• Break & Retest: Above 107,450 confirms short-term bullish continuation.
• Retest Zone: 107,300–107,450
• Targets:
TP1 → 107,800
TP2 → 108,500
TP3 → 109,200
• Stop-Loss: Below 106,700
⚠️ SELL SCENARIO (Main Bias)
• Break & Retest: Below 106,300 confirms continuation to the downside.
• Retest Zone: 106,300–106,500
• Targets:
TP1 → 105,800
TP2 → 104,600
TP3 → 103,200
• Stop-Loss: Above 107,000
🚀 SWING SELL (High Probability)
• Ideal Entry: 111,000–112,200 (Fibonacci Golden Zone)
• Targets: 108,000 → 106,000 → 103,500
• Stop-Loss: Above 113,000
⸻
🕐 Fundamental Watch
• Weekend = low volume, potential for range-bound moves.
• Next week: Focus on U.S. CPI follow-through & Fed speakers, which may add volatility.
• CME futures gap remains open near 108,800, likely to be filled early next week.
⸻
⚙️ Key Technical Levels
Type Levels
Resistance 107,450 / 108,000 / 109,800 / 111,000
Support 106,500 / 106,300 / 105,800 / 103,200
Trendline Resistance 107,800 (H1 descending structure)
⸻
🧾 Analyst Summary
BTCUSD is in a corrective phase, showing short-term rebound signs from the 106k support zone, yet still locked under heavy resistance at 107.8k–108k.
A break below 106.3k resumes the bearish trend, targeting 104–103k, while a bounce above 107.4k may trigger a limited retracement to 108.8k–111k before sellers re-enter near the Golden Zone.
Overall market remains bearish but approaching exhaustion levels — watch for short-term buy opportunities within 106.3k–107k range before the next leg down.
⸻
📈 Primary Bias: Bearish below 107,800 – next downside targets 106,000 → 103,200
📉 Alternative Bias: Bullish retracement above 107,450 → 108,800 → 111,000
— ElDoradoFx PREMIUM 2.0 Team 🚀
⸻
🥇 ElDoradoFx PREMIUM 2.0 – PERFORMANCE 17/10/2025 🥇
📊 GOLD TRADE RESULTS:
🔻 SELL +20 pips
🟢 BUY +20 pips
🟢 BUY +210 pips
🟢 BUY LIMIT +20 pips
🔻 SELL LIMIT +110 pips
🟢 BUY +50 pips
❌ BUY –30 pips (SL)
🟢 BUY +200 pips
🟢 BUY +100 pips
🟢 BUY +400 pips
---
💰 TOTAL GOLD PIPS WON: +1,100 pips
📈 RESULT: 10 Signals → 9 Wins | 1 SL
🎯 ACCURACY: 90 %
---
⚡️ SWING SETUPS RUNNING:
🟢 BUY from 4,081 → +2,970 pips
🟢 BUY from 4,181 → +1,970 pips
💎 TOTAL SWING GAIN SO FAR: +4,940 pips
---
🔥 Precision. Patience. Profits.
Ending the week with momentum and clean executions 📈💪
👏 Congratulations if you profited! ✅✅✅🚀🚀🚀

ElDoradoFx PREMIUM 2.0 - (14/10/2025, ASIA SESSION)BTC is trading around 115,700, consolidating after a strong recovery from 110,000.
Price has broken above intraday structure and is now approaching a key confluence resistance zone near 116,000–116,250.
⸻
🔍 Technical Outlook
Daily Structure (1D):
• The pair continues to recover from the previous sweep at 107,700, forming a clear higher low on the daily.
• Momentum indicators (MACD and RSI) show bullish continuation, though still below the main descending trendline from 126,000.
• The Fibonacci retracement (126,000 → 102,200) highlights the Golden Zone at 116,700–118,800, where sellers could return.
1H Structure:
• Market structure flipped bullish after BOS at 114,400.
• EMA50 and EMA200 are showing early bullish crossover, confirming momentum shift.
• The 1H MACD is widening positively, and RSI near 67 suggests BTC is building strength but nearing intraday overbought conditions.
15M + 5M (Intraday Setup):
• Price is forming a rising channel with higher highs and higher lows.
• MACD histogram shows bullish momentum continuation; RSI is consolidating near the 70 zone.
• Current resistance: 115,950–116,250 (FVG + weak high)
• Strong support: 114,400–114,800 (EQL + 200 EMA + trendline support)
This zone is ideal for a break and retest setup confirmation.
⸻
📌 Breakout Levels to Continue Trend
Bullish continuation:
• Break above 116,250, retest 115,900–116,000 → targets 116,900 / 117,800 / 118,800 (Golden Zone)
Bearish correction:
• Break below 114,400, retest 114,600–114,800 → targets 113,600 / 112,900 / 111,800
⸻
📅 Fundamental Watch
• Asia session expected low volatility, but volume could build ahead of London open.
• Focus remains on U.S. CPI (Wednesday) — volatility likely to increase midweek.
• No major Asian economic events today.
⸻
⚠ Key Levels to Monitor
Resistance zones:
116,250 / 116,900 / 117,800 / 118,800
Support zones:
115,000 / 114,400 / 113,600 / 111,800
⸻
✅ Summary
BTC remains bullish short-term after reclaiming 115k support, but momentum is slowing near 116,200 — a key supply area.
A break and retest above 116,250 opens continuation toward 117.8k–118.8k (Fibonacci Golden Zone), while a rejection at 116,000 could send price back toward 114.4k support for re-entry.
Bias: Bullish with caution near 116k–118k resistance.

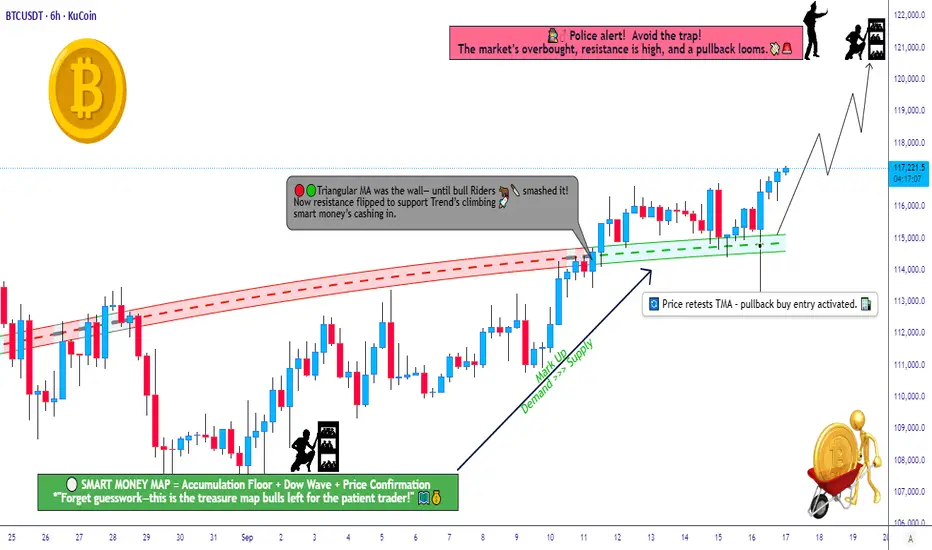
BTC/USDT Wealth Map – Trend Confirmed, Targets in Sight!🚀 BTC/USDT: The Great Crypto Heist! 🤑 Swing/Day Trade Wealth Map
Asset: BTC/USDT (Bitcoin vs. Tether) Vibe: Bullish breakout with a cheeky "thief" twist! 😎Strategy: Swing/Day Trade with a layered limit order approach to steal profits from the market! 💰
📊 Market Analysis: The Heist Setup
🐂 Bullish Trend Alert: Bitcoin’s charging out of the accumulation zone like a runaway train! 🚂
📈 Triangular Moving Average (TMA) Breakout: Price smashed through the TMA, confirming a reaccumulation phase. Candles retested the TMA dynamic line, screaming TREND CONFIRMED — bulls are in control! 💪
🕵️♂️ Thief Strategy: We’re using a layered limit order approach (aka the "Thief Layering Tactic") to sneak into the market at multiple price levels. This maximizes entries while keeping it slick and stylish!
🗺️ The Heist Plan
🎯 Entry: Pick your spots like a master thief!
🔹 Use layered buy limit orders at:
💸 $115,000
💸 $115,500
💸 $116,000
💸 $116,500
💸 $117,000
🔍 Pro Tip: Feel free to add more layers based on your risk appetite and market conditions! Stack those entries like a pro. 😎
🌟 Alternative: If you’re feeling bold, enter at any price level post-breakout — just keep an eye on momentum!
🛡️ Stop Loss (SL): Set your Thief SL at $114,000 after the breakout for protection.
🔹 Dear Ladies & Gentlemen (Thief OGs), this SL is a suggestion! Adjust it based on your strategy and risk tolerance. Don’t let the market cops catch you off-guard! 🚨
🎯 Take Profit (TP): Watch out for the police barricade (aka strong resistance) at $121,000. This zone may act as an overbought trap, so grab your profits and escape before the market locks you in! 🏃♂️
🔹 Note: Thief OGs, this TP is a guideline. Set your own targets based on your risk-reward preference. Steal the profits and vanish! 💸
🧠 Key Notes for Thief OGs
⚠️ Risk Management: I’m not your financial advisor, so don’t just follow my SL or TP blindly. Tailor your plan to your own risk tolerance and make those profits yours!
🕵️♂️ Thief Mindset: The market’s a game of cat and mouse. Stay sharp, adapt, and don’t get greedy — escape with your loot before the traps spring!
🔗 Related Pairs to Watch
Keep an eye on these correlated assets for extra context:
🔹 BINANCE:ETHUSDT : Ethereum often moves in tandem with Bitcoin. A bullish BTC breakout could spark ETH’s own rally. Watch for similar TMA breakouts or retests!
🔹 BINANCE:BNBUSDT : Binance Coin tends to follow BTC’s lead in bullish markets. Check for momentum alignment.
🔹 BINANCE:XRPUSDT : Ripple can show correlated strength, especially if BTC pushes past resistance. Look for breakouts above key levels.
🌟 Correlation Tip: These pairs often mirror BTC’s price action in bullish trends, but always confirm with your own analysis to avoid market traps! 🕸️
✨ Final Words
This is your chance to pull off the ultimate crypto heist with BTC/USDT! Stay disciplined, manage your risk, and let’s make those profits disappear into your wallet! 😜
✨ If you find value in my analysis, a 👍 and 🚀 boost is much appreciated — it helps me share more setups with the community!
#BTCUSDT #CryptoTrading #SwingTrading #DayTrading #ThiefStrategy #BullishBreakout #TradingView
ElDoradoFx PREMIUM 2.0 – WEEKEND BTCUSD ANALYSISBTC is trading around 111,600, recovering after last week’s sharp correction from 126,000.
Price is forming higher lows from 109,500, suggesting a short-term bullish correction while overall structure remains bearish.
⸻
🔍 Technical Outlook
Daily Structure (1D):
BTC is holding above the 200 EMA / major demand zone (107,700–108,800).
Momentum indicators (MACD + RSI) show early recovery — buyers stepping in after the deep retracement.
Trend is still bearish, but a clean push above 112,500–113,000 would confirm a short-term CHoCH bullish shift.
The Fibonacci retracement (126,000 → 107,200) marks the Golden Zone at 116,600–118,400, still the ideal swing-sell region.
Intraday (1H + 15M + 5M):
Charts show a clear bullish order block (OB) around 110,200–111,000 and a bearish OB above 112,800–113,200.
Fair Value Gaps (FVGs) remain unfilled near 112,400–113,000, likely short-term targets.
Market structure: forming Higher Lows (HLs) with momentum building on the MACD and RSI across lower timeframes.
Short-term bias: bullish correction until resistance confirms rejection.
⸻
📌 Breakout Levels to Continue Trend
Bullish continuation:
• Break above 111,800, retest 111,400–111,600 → upside path 112,400 → 113,200 → 114,000
• If price continues, next resistance aligns at 116,600–118,400 (Golden Zone)
Bearish continuation:
• Break below 110,200, retest 110,400–110,600 → downside path 109,200 → 108,000 → 106,800
• Clean close below 108,800 confirms daily bearish trend resumption
⸻
📅 Fundamental Watch
No major weekend data.
Sunday CME gap (109k–111k) could attract liquidity before Monday’s open.
Upcoming U.S. CPI next week will define the next strong directional move in BTC and risk assets.
⸻
⚠ Key Levels to Monitor
Resistance zones:
111,800 / 112,400 / 113,200 / 116,600 / 118,400
Support zones:
110,200 / 109,200 / 108,000 / 107,700 / 106,800
⸻
✅ Summary
BTC is consolidating inside a bullish order block, with momentum building toward 112.8k–113.2k, where a major bearish OB + FVG confluence exists.
A break and retest above 111,800 could extend the recovery to 113k–114k, while failure below 110,200 would reopen the path to 108k–106.8k.
Main trend remains bearish, but short-term correction likely continues before sellers regain control near the Golden Zone (116.6k–118.4k).
— ElDoradoFx PREMIUM 2.0 Team

ElDoradoFx PREMIUM 2.0 – Weekend BTCUSD AnalysisBTC is trading around 110,200, after a sharp 12,000-pip correction from the recent 126,000 high.
This week’s movement confirms a bearish structure shift, driven by heavy liquidation and macro profit-taking after the extended bull leg.
⸻
🔍 Technical Outlook
📅 Daily Structure (1D):
• BTC broke below the 115,000 key support and is now testing the ascending trendline support near 108,800–107,700 (the previous swing-low region).
• The daily candle shows a long lower wick, signaling potential demand re-entry, but momentum remains weak.
• The 200-EMA (yellow) around 107,700 is critical — a close below would confirm a mid-term bearish reversal.
• MACD shows a strong bearish crossover with fading histogram strength, indicating decelerating bearish pressure.
• RSI has cooled to the 35–38 zone, approaching oversold — supporting a possible short-term rebound.
🎯 Fibonacci Golden Zone:
The retracement from the swing low (107,200) to the previous swing high (126,000) places the Fibonacci Golden Zone (61.8%–50%) between 112,000–114,500.
This zone will likely act as the first major resistance on any pullback.
If price retests this area and rejects, it offers a high-probability short continuation opportunity.
⸻
📈 Intraday Structure (1H + 15M + 5M):
• 1H structure remains bearish, with continuous Breaks of Structure (BOS) toward new lower lows.
• Short-term consolidation is forming around 110,000–110,500, right above the daily support zone.
• 15M and 5M charts show small bullish divergences on RSI and MACD, suggesting a possible technical bounce before continuation.
• 50EMA and 100EMA on intraday remain above price — still confirming short-term downtrend dominance.
• The current compression could lead to a small retracement toward 111,800–112,400, which aligns with the Fib retracement zone and intraday supply.
⸻
📌 High-Probability Entry Zones (≤600-pip SL)
🔴 SELL (Trend Continuation)
• Entry: 111,800 – 112,400 (Fib 50–61.8% zone)
• SL: 113,000
• TP1: 110,000
• TP2: 108,800
• TP3: 107,300 (200-EMA / Daily demand)
Bias: Short from retracement back into structure resistance & EMAs alignment.
🟢 BUY (Short-Term Reversal Play)
• Entry: 108,800 – 109,200 (demand & trendline)
• SL: 108,200
• TP1: 111,200
• TP2: 112,000 (Fib zone)
Bias: Only valid if RSI stays above 35 and MACD histogram flips green — scalp reversal before trend resumes.
⸻
📅 Fundamental Watch
• Weekend liquidity remains low — avoid chasing false breakouts.
• No major macro events until Monday, but watch CME Futures Gap risk between 109k–111k.
• U.S. CPI data from earlier in the week reinforced stronger USD; risk appetite still fragile — BTC sensitive to Dollar Index movements.
⸻
⚠ Key Levels to Monitor
Resistance: 111,800 / 112,400 / 114,500 / 116,500
Support: 109,200 / 108,800 / 107,700 / 106,800
⸻
✅ Summary
BTC remains in a bearish correction phase below 114,000 after failing to hold structure.
A pullback to 111,800–112,400 could offer the best short opportunity (sell-the-rally setup).
If bulls defend 108,800, expect a technical bounce back to 112k before another drop.
Below 107,700 = full bearish continuation toward 105,000,
while reclaiming above 114,500 = short-term bullish recovery.
— ElDoradoFx PREMIUM 2.0 Team
⸻
🥇 ElDoradoFx PREMIUM 2.0 – PERFORMANCE 10/10/2025 🥇
📊 MARKET RECAP:
🔻 SELL 🔴 +50 pips
🔻 SELL LIMIT 🔴 +20 pips
❌ SELL 🔻 –95 pips (SL)
🔻 SELL 🔴 +210 pips
🟢 BUY 🟩 +110 pips
🟢 BUY 🟩 +200 pips
🔻 SELL 🔴 +40 pips
---
🏆 GOLD TOTAL PIPS WON: +535 pips
📊 RESULT: 7 Signals → 6 Wins | 1 SL
🎯 ACCURACY: 86 %
---
🔥 Another strong trading day!
Controlled risk, solid entries, and consistent results 💪📈
👏 Congratulations if you profited ✅✅✅🚀🚀🚀
