BTCUSDT 341% profits potential with 10X leverage —LONG tradeGood afternoon my fellow Cryptocurrency trader, I hope you are having a wonderful afternoon.
I found another chart setup that looks great for a 10X LONG. It is Bitcoin, the top, the biggest, the #1 crypto.
Let's look at this chart setup from a different perspective, let's go with the classic saying; buy when the market is red.
Bitcoin has been in a retrace for nine days and trading volume is really low. The action continues to happen as a higher low... Below the full trade-numbers:
___
LONG BTCUSDT
Leverage: 10X
Potential: 341%
Allocation: 10%
Entry zone: $83,000 - $88,000
Targets:
1) $98,000
2) $104,400
3) $108,780
4) $116,441
Stop: $82,800
_____
Thanks a lot for your continued support.
This trade can start moving the next day. It is a high probability chart setup. It has a good potential for reward. All targets can be reached "short-term," within 30 days.
Thank you for reading.
Namaste.
Btcusdtlong
BTCUSD (30-min) chart📊 Chart Structure
BTC is in a short-term pullback within a broader recovery. Price is holding above a key demand zone after rejecting lower levels, suggesting buyers are still active near support.
🟢 Support Zone (Buy Area)
Main Support:
87,200 – 87,350
Why this zone matters:
Previous consolidation base
Multiple candle reactions
Near EMA support cluster (EMA 21 & 50)
📌 This is the preferred dip-buy zone as long as price holds above it.
🔴 Resistance Zone
Key Resistance:
88,700 – 88,900
This area:
Acts as recent supply
Rejected price previously
Needs strong bullish candles to break
📈 Buy Setup Idea (Educational)
Wait for price to hold above 87,200
Look for bullish confirmation (strong close / rejection wicks)
Upside targets:
First: 88,500
Extension: 88,900+ if breakout confirms
⚠️ Risk Note
A clean break below 87,200 may weaken the setup
In that case, price could revisit lower support before continuation
🧠 Short Summary
BTC is consolidating above support. Holding above 87,200 keeps the buy-the-dip idea valid, while a breakout above 88,900 opens room for further upside.

#BTC/USDT Let Bitcoin make a new ATH#BTC
The price is moving within a descending channel on the hourly timeframe. It has reached the lower boundary and is heading towards a breakout, with a retest of the upper boundary expected.
The Relative Strength Index (RSI) is showing a downward trend, approaching the lower boundary, and an upward bounce is anticipated.
There is a key support zone in green at 92445. The price has bounced from this level several times and is expected to bounce again.
The indicator is showing a trend towards consolidation above the 100-period moving average, which we are approaching, supporting the upward move.
Entry Price: 89286
First Target: 90011
Second Target: 91141
Third Target: 92445
Stop Loss: Below the green support zone.
Don't forget one simple thing: Money Management.
For any questions, please leave a comment.
Thank you.

BTCUSD: Narrow range at highsBTCUSD is trading in an extremely narrow range at highs today, with clearly tiered core support and resistance levels. The trading strategy centers on waiting for a breakout with volume and following the trend, with strict position control enforced.
Core Support Levels:
Short-term (Intraday Core)88,500 USD (Strong Support): The lower boundary of the consolidation range, a critical bull-bear demarcation level for the short term. A break below this level requires volume confirmation to validate a weakening trend.
Medium-term (Daily Chart, Swing Reference)87,000 USD (Strong Support): The level of the previous consolidation platform, a key defensive position for swing bullish positions. A break below this level will open up further downside correction space.
Core Resistance Levels:
Short-term (Intraday Core)90,500 USD (Intraday Resistance): Today’s high, where pullbacks are likely to occur on rebounds and tests of this level.
Medium-term (Daily Chart, Swing Reference)93,000 USD (Strong Resistance): The upper boundary of the previous consolidation range, a key target for short-term rebounds. A breakout above this level will leave no significant technical resistance to the upside.

BTCUSDT: Bullish Push to 91900?BINANCE:BTCUSDT is eyeing a bullish rebound on the 1-hour chart , with price bouncing from a support zone near cumulative long liquidation, converging with a potential entry area that could trigger upside momentum if buyers defend against further dips. This setup suggests a recovery opportunity after recent pullback, targeting higher resistance levels with more than 1:2.5 risk-reward .🔥
Entry between 88300–88500 for a long position (entry from current price with proper risk management is recommended). Target at 91900 . Set a stop loss at a 4-hour close below 87200 , yielding a risk-reward ratio of more than 1:2.5 . Monitor for confirmation via a bullish candle close above entry with rising volume, leveraging Bitcoin's resilience post-correction.🌟
📝 Trade Setup
🎯 Entry (Long):
88,300 – 88,500
(Entry from current price is valid with strict risk & position sizing.)
🎯 Target:
• 91,900
❌ Stop Loss:
• 4H close below 87,200
⚖️ Risk-to-Reward:
• > 1:2.5
💡 Your take?
Is this a clean liquidity-sweep rebound toward 91,900, or does BTC need deeper consolidation before any meaningful upside? 👇

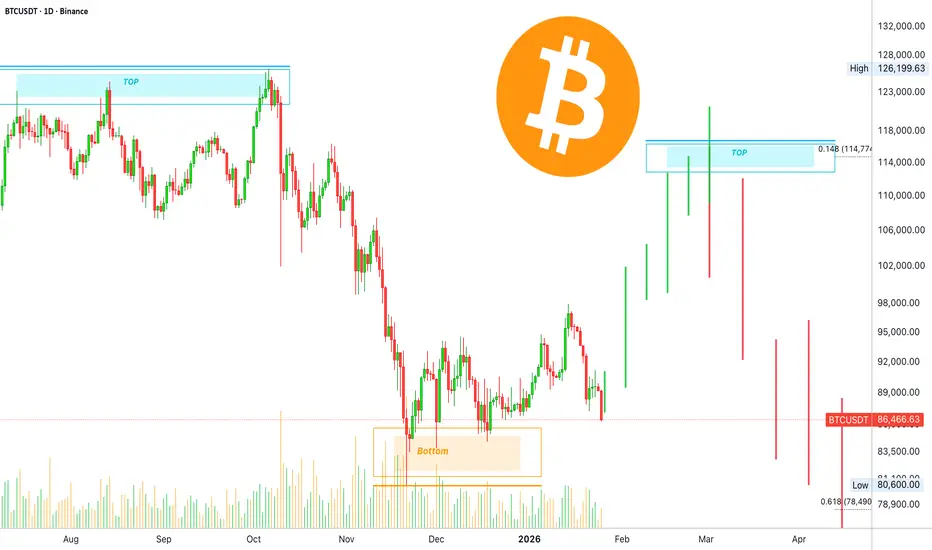
Is Bitcoin about to crash? Read in full...Bitcoin is very slow lately and the same price range has been holding for months, no change truly. Normally, even while we recognize all of the signals and keep a bullish bias, it is still normal to wonder if Bitcoin will continue growing.
The active price range is the same since late November. Bitcoin has been moving between $84,000 to $92,000.
Now, think of this. Do you remember after the higher low 18-December how sellers couldn't produce a price below $86,000?
Regardless of all the fluctuations and the sideways range, the lowest possible was $86,400, never below, and this development is still true today.
The lowest Bitcoin has gone was $87,277, yesterday, and you can see how easily this is the final low. Last month it was $86,400, 24-Dec, this month it is ~$87,000.
We have a trading range but still, there is a clear and undeniable bullish bias. The most recent move is a higher high that peaked at a perfect level based on Fibonacci retracement; all the action is composed of higher highs and higher lows.
So, we have a bullish consolidation period, we can even say an uptrend if we consider only the short-term. This will lead to a higher high next.
The last target at $98,000 matches the 0.382 Fib. retracement level (inverted correction) on this chart. The next target is 0.618 which sits around $108,800... And that's all I have to say.
While the doubt is in the air, it is not in the chart. Trust the chart and all will be good.
The truth is that the next move has already being revealed. Bitcoin is going higher, at this point you can open LONG with any amount of leverage below 20X.
Any trading below $90,000 is a very strong buy opportunity right now. Do whatever you have to do to make the most out of this situation. It will soon be gone.
As soon as the relief rally is over Bitcoin will start to crash for months.
I've been mentioning Ethereum decoupling from Bitcoin but I don't really think so. I do believe Ether will produce massive growth before a major correction shows up, but when Bitcoin crashes everything crashes. Don't wait for the hype, greed and euphoria to take action. Now it is the time to go LONG.
Bitcoin is perfect right now, all the altcoins as well. The market is going up, but we have some reckoning to do after this bullish wave.
It is always the same; up and down, up and down, up and down... We can profit from both the bearish and bullish cycles.
Thank you for reading.
Namaste.

Bitcoin enters bullish reversal zone —RSI Oversold, 6 red days &There are two signals supporting a bullish reversal around current price levels. Any trading below $90,000 should be instantly bought.
This chart shows Bitcoin on the 4H timeframe including the RSI.
Bitcoin's 4H RSI hit the lowest since 21-November 2025 and also entered "oversold" territory, extremely weak. This reading of oversold on the 4H timeframe has been present only twice since the end of the correction.
The first time was 21-November and Bitcoin started to grow. The second instance happened 1-December and right after Bitcoin started to grow. Then never again the 4H RSI reads oversold.
When Bitcoin becomes oversold on the 4H RSI, this signals that a reversal is coming next. There is more.
The highest bearish volume on the current drop happened 15-January. Yesterday and today, 19 and 20 January, Bitcoin produced a lower low yet volume is lower. Signaling weakening bearish momentum.
The final signal is based on the daily timeframe. Bitcoin produced five consecutive days red only once in several years and this happened only recently as part of a consolidation. After the fifth red day, the action tends to turn bullish.
Here is the thing, Bitcoin is now trading on its 6th consecutive red day. This event only happened once back in May 2023. Needless to say, Bitcoin turned bullish the ensuing day.
Retraces should be an opportunity to buy-in, rebuy and reload. The relief rally is not over. Bitcoin is trading within a very strong higher low compared to 21-November, and the action is happening above $90,000. Any trading below $90,000 is a strong buy opportunity in anticipation of a bullish resumption.
Thanks a lot for your continued support.
Namaste.

BTCUSD: Retracement from elevated levelsBTCUSD trended in a pattern of pulling back from highs and extending weak consolidation during the intraday session. Hit by the escalation of U.S.-EU tariff frictions, rising geopolitical risks and a sell-off in risk assets, the price plummeted sharply from the high of $95,500 and now hovers within the range of $87,000–$91,000. Market panic sentiment is mounting, bears hold the upper hand technically, and rebound momentum remains constrained.
Support Levels:
Short-term Strong Support: 87,000 (lower boundary of the intraday consolidation range, key support zone for rebounds)
Secondary Support: 86,000 (weekly moving average support, previous congestion zone)
Medium-term Support: 85,000 (defensive line for the medium-term trend)
Resistance Levels:
Short-term Strong Resistance: 91,000 (intraday rebound resistance level, bears’ defensive line)
Secondary Resistance: 92,000 (4-hour moving average resistance, key resistance for rebounds)
Medium-term Resistance: 95,000–96,000 (previous all-time high, a strong resistance zone dominated by bears)
Trading Strategy:
Buy 88000 - 88500
SL 87500
TP 90500 - 91000 - 92000
Sell 91000 - 91500
SL 92000
TP 89500 - 88000 - 87200

BITCOIN: As Expected Price Is Dropping, Waiting To Come at 60K?Dear Traders,
As anticipated, the price is reversing from $98,000 and may experience a significant drop towards $60,000. The $60,000 area remains strong and attracts swing buyers. Our recommendation is to wait for the price to break through this trading range pattern. A strong breakthrough would indicate a clear price pattern.
If you like our idea, please like and comment for more.
Team SetupsFX_

BTCUSD: Pressure-driven pullback then low consolidationBTCUSD traded in a pattern of correcting under pressure followed by low-range consolidation and recovery today. During the Asian session, it came under selling pressure alongside other risk assets amid escalating U.S.-EU trade frictions, with bears dictating the near-term price action. The core trading range has shifted lower to 90,000–93,000.
Support Levels:
90,000–90,500 (Strong Support): Confluence of the intraday low and the EMA30 trend support level, which has attracted buying interest on multiple retests and serves as the core short-term defense zone for bulls. A breakdown below this level could trigger a further decline toward the 89,000–89,800 range.89,000–89,800 (Medium Support): Boasts robust support strength; a test of this range is likely to trigger a technical rebound.
Resistance Levels:
92,800–93,000 (Strong Resistance): Confluence of the upper boundary of the intraday consolidation range and short-term moving average resistance. Bulls have made multiple unsuccessful attempts to breach this level, which stands as the key defensive line for short-term bears. A decisive breakout could open up upside momentum toward the 93,500–94,000 range.93,500–94,000 (Medium Resistance): Confluence of the 0.618 Fibonacci retracement level and previous swing highs, exerting marked downward pressure and acting as a key target for the bulls’ medium-term rebound.
Trading Strategy:
Buy 90500 - 90800
SL 91000
TP 92000 - 92500 - 93000
Sell 92800 - 93000
SL 93500
TP 92000 - 92500 - 93000

BTCUSD Intraday AnalysisBTCUSD traded in a pattern of retesting support followed by consolidation intraday, maintaining a high-range oscillation overall with the bullish structure remaining intact. The core intraday tussle focused on the 94,000–96,000 range, where profit-taking flows and support buying coexisted in balance.
Intraday Short-term Levels:
Support Levels:
94,200–94,300 (Strong Support): Confluence of intraday lows, short-term neckline and the 0.618 Fibonacci retracement level, with effective buying interest confirmed by multiple retests.
94,800–95,000 (Medium Support): Lower boundary of the consolidation range, acting as a secondary key defense zone for short-term bulls.
Resistance Levels:
95,700–95,800 (Strong Resistance): Confluence of intraday highs and previous swing highs; a decisive breakout requires significant volume confirmation.
96,000–96,500 (Medium Resistance): Psychological level plus previous congestion zone, exerting marked downward pressure on price action.
Trading Strategy:
Buy 94800 - 95000
SL 94000
TP 95500 - 96000
Sell 95800 - 95600
SL 96000
TP 95000 - 94500

#BTC/USD Weekly Update Rally to $106k but still Scary!!BTC Weekly:— sharing an honest view, and I’m open to being wrong unless proven otherwise.
There could be another move toward $100k–$106k, but the structure suggests it may turn into a trap.
Given the current conditions, focusing on scalping high-volume coins with clear invalidation levels, tight stop losses, and modest targets seems more prudent.
Holding positions for the long term doesn’t appear optimal in this kind of market.
Still, always do your own research, NFA!
Thank you
#PEACE

“Bitcoin 4H Bullish Continuation Setup — Liquidity Target at 98KMarket Structure
Bullish overall structure: Strong impulsive move up from the low ~90k area.
CHoCH (Change of Character) on the left confirms a shift from bearish to bullish.
Current price action is consolidating after impulse, which is typical before continuation.
Key Concepts on the Chart
1. Fair Value Gaps (FVG)
Lower FVG (~94k area)
This has already been respected → good sign of bullish strength.
Mid FVG inside the range
Price is currently reacting within this imbalance, suggesting accumulation.
👉 As long as FVGs are respected, bias remains bullish.
2. Fibonacci Levels (Internal Retracement)
From the impulsive leg:
0.618 ≈ 96,691
0.5 ≈ 96,290
0.0 ≈ 94,941
Price is consolidating between 0.5–0.618, which is a classic bullish continuation zone.
3. Support Levels
Primary support: 94,353
Major invalidation / deeper support: 93,073
📌 If price holds above 94,353, bullish continuation is favored.
📌 A clean break and close below 93,073 would weaken this setup significantly.
4. Resistance & Target
Range high / Liquidity: ~97,900 – 98,100
Marked TARGET POINT ≈ 98,117
This aligns with:
Previous highs
Liquidity resting above the range
Measured move from consolidation
Projected Scenario (Blue Path)
Short-term chop / minor pullback within the range
Hold above FVG + support
Expansion move targeting 98k+
This is a textbook continuation model.
Bias Summary
Bias: Bullish 📈
Invalidation: 4H close below ~93k
Target: 97.9k → 98.1k
Key Area to Watch: 94.3k–95k reaction zone

BTC (Bitcoin) towards $101kHi,
These patterns formed:
1- triangle
2- inverse head and shoulders
3- ascending channel.
The neckline is broken, and the price could reach to $101k level, that is the target of the IH&S!
There are two enty levels, the neckline and a major correction!

$BTC update based on the liquidation heatmap !!CRYPTOCAP:BTC update based on the liquidation heatmap 👇
Right now, there’s still a decent amount of liquidity sitting below price, especially around 89.1K. That doesn’t mean price has to go there nothing is guaranteed but historically, price tends to move toward heavy liquidity zones to clear them out.
So don’t be surprised if, sometime in the short term, we see a dip that takes out just above 89K. If that happens, it would reduce the importance of that downside liquidity and let the market refocus higher.
What I really want to see is a clean break and confirmation above ~94K. That’s a major resistance area.
If BTC can break above it and hold, that would be a strong signal and at that point, a push toward 100K becomes much more realistic, while downside liquidity loses relevance.
Until then, patience. Let the levels do the talking.

BTCUSD Spikes Post-NFP, Then Pulls BackThe core trend of BTCUSD is high-level consolidation with weak upward momentum and supported pullbacks. It has been consolidating narrowly around the $90,500 mark intraday, and is overall trapped in a tug-of-war range between the key resistance at $91,000 and the psychological support at $90,000. The probability of sideways trading over the weekend remains high.
After the release of the U.S. nonfarm payrolls data on Friday, BTCUSD surged to around $91,960, then retreated under the pressure of profit-taking and a stronger U.S. Dollar. A long upper shadow formed on the daily chart, indicating strong resistance around the $92,000 level. During the pullback, the $90,000 threshold platform provided solid support, with no breakdown accompanied by heavy trading volume.
Support Levels:
$90,000 (psychological level, short-term bullish defense line)
$89,600–$89,800 (recent low platform, key support)
$89,000 (secondary strong support)
Resistance Levels:
$91,500–$92,000 (intraday high and recent key resistance zone)
$93,600 (upper band of the daily Bollinger Bands, medium-term resistance)
Trading Strategy:
Buy 90000 - 90500
SL 89500
TP 91000 - 91500
Sell 91500 - 92000
SL 92500
TP 90500 - 90000

BTCUSD PROFIT - BLUES Btcusd - has been behaving properly since the signal was sent, it has never hit our (SL) but instead maintained a good pattern and price structure, stay tuned for more and stick to the Mandatory rules required to trade successfully

$BTC/USDT ANALYSISOn the 8-hour MEXC:BTCUSDT chart, price shows a clear rejection from the higher-timeframe supply zone around the mid-94k area, confirming that strong sell orders are still active there, and the subsequent decline has brought price back into the prior breakout region near 89–90k, which is now acting as a critical decision zone; structurally, the market is trading within a rising base but momentum has weakened, indicating distribution rather than aggressive accumulation, and the current consolidation below resistance reflects compression after rejection rather than strength, meaning as long as price remains below the major supply and fails to reclaim it, downside risk remains elevated, while only sustained acceptance and holding above the 89–90k support would shift the bias back toward continuation higher.

#BTC/USDT - Where the 2026 Bottom Might Actually Form ( Short) #BTC
The price is moving in a descending channel on the 1-hour timeframe. It has reached the upper limit and is heading towards breaking it. A retest of the upper limit is expected.
We have an upward trend on the RSI indicator, which has reached near the upper limit. A downward reversal is expected.
There is a key support zone in green at 944650. The price has bounced from this zone multiple times and is expected to bounce again.
We have a trend of consolidation above the 100-period moving average, as we are moving close to it. This supports a downward move towards touching this level.
Entry price: 93500
First target: 93006
Second target: 92509
Third target: 91866
Stop loss: Above the support zone in green.
Don't forget a simple thing: capital management.
For inquiries, please leave a comment.
Thank you.

BTC/USDT Structure Holds as Buyers Defend MA Pullbacks🚀 BTC/USDT — Smart Money Bullish Accumulation Play | Swing Trade Setup
📌 Asset
BTC/USDT — Bitcoin vs Tether
Market: Crypto
Trade Type: Swing Trade
🧠 MARKET PLAN — BULLISH STRUCTURE CONFIRMED ✅
Price action shows repeated bearish rejections failing near the 786-period Triangular Moving Average, followed by successful retests and bullish pullbacks.
This behavior signals seller exhaustion and controlled absorption by bulls, a classic smart-money accumulation phase.
Momentum remains constructive as buyers defend pullbacks rather than chasing highs — a healthy bullish condition.
Bullish Limit Layers (Example):
86,000
87,000
88,000
89,000
90,000
Increase or adjust layers based on your own capital allocation and volatility tolerance.
⚡ Execution Rule: Set all limit orders simultaneously across your broker. Let market come to you rather than chasing momentum.
🛑 STOP LOSS - PRESERVATION PROTOCOL
Primary Stop Loss: $85,000 (Below consolidation structure)
Risk Management Notes:
⚠️ Adjust SL based on your account risk tolerance - This is YOUR capital
Suggested ATR(14)-based stop for traders using volatility: Current ATR ≈ $2,400
Dynamic SL: Move stop to break-even at 2R profit (Risk/Reward ratio)
Emergency exit: Close 50% position if price breaks below $84,500 decisively
Important: Your stop loss is YOUR responsibility. Modify based on your risk appetite and account size.
🎯 PROFIT TARGETS - ICHIMOKU RESISTANCE ZONES
Primary Target: $100,000
Rationale: Ichimoku Kijun-sen resistance + Overbought zone confluence
Structure: Former resistance now support - institutional trap zone
Probability: 65% success rate based on 2026 technical consolidation patterns
Secondary Targets:
Target 2: $96,500 (Channel top + Major trendline resistance)
Target 3: $103,000-$105,000 (Pre-ATH distribution zone)
Target 4: $108,000-$112,000 (If institutional flow sustains)
🔴 Overbought Warning: At $98,000+, Ichimoku shows extreme overbought compression. Be prepared for sharp 3-5% retracements before continuation.
Important: Your profit targets are directional guidance ONLY. Take profits at YOUR chosen levels based on your risk-reward strategy. NOT financial advice.
📈 CORRELATED PAIRS TO MONITOR 📈
Primary Correlation Pairs (Move with BTC ~80-95%):
1. ETH/USDT (Ethereum) - $3,010 | 24h Change: +1.01%
Correlation: 0.87 (Very High)
Key Level: Watch $3,100-$3,200 for strength confirmation
Status: Following BTC structure; if ETH breaks $2,800, BTC weakness likely
2. XRP/USDT (Ripple) - $2.08 | 24h Change: +2.67%
Correlation: 0.72 (Strong)
Critical Support: $2.00 (Make-or-break level)
Insight: XRP showing relative strength - suggests institutional rotation into altcoins beginning
Risk Level: If XRP closes below $1.61, full crypto correction possible
3. SOL/USDT (Solana) - $135.92 | 24h Change: +3.17%
Correlation: 0.79 (High)
Range-bound play: $120-$145 consolidation
Breakout signal: SOL break above $145 suggests BTC momentum building
Altseason indicator: First to move before broader altcoin rally
4. BNB/USDT (Binance Coin) - $899.26 | 24h Change: +1.31%
Correlation: 0.75 (Strong)
Support: $850 | Resistance: $950
Institutional ladder: BNB accumulation often precedes macro rallies
5. SPL (Solana Network Token) - Watch for RWA ecosystem expansion
2026 Prediction: RWA market reaching $1B+ (currently $873M)
Status: Emerging institutional infrastructure play
Divergence Signals to Watch:
If BTC rallies but ETH/XRP fall: Institutional profit-taking coming
If SOL outperforms BTC: Altseason phase likely beginning (not yet confirmed)
If XRP breaks $2.30 decisively: Macro shift toward risk-on environment
📰 FUNDAMENTAL & ECONOMIC DRIVERS - JANUARY 2026
BULLISH FACTORS FOR BTC:
✅ Institutional Demand Acceleration
Spot ETFs purchased 710,777 BTC (network produced 363,047) → Net supply deficit
Major firms: Morgan Stanley, Merrill Lynch, Vanguard approved crypto access for retail
Prediction: ETF AUM could exceed $400B by end-2026 (currently $200B+)
✅ Favorable Macro Environment (Q1-Q2 2026)
Fed leadership change potential: Kevin Hassett (favors lower rates) frontrunner for Fed Chair
Quantitative easing likely: QT ending, Fed pivot expected mid-year
Yield curve normalization: Long rates may fall while short rates stabilize (bullish for BTC)
✅ Regulatory Tailwinds
CLARITY Act discussions gaining momentum (Ethereum/Solana ATH scenario)
SEC generic listing standards enabling "ETF-palooza" (100+ crypto ETFs expected in 2026)
Trump administration: Pro-crypto stance signaling (appointees more favorable than prior regime)
✅ Business Cycle Synchronization
Purchasing Managers' Index improving (PMI expansion phase)
Liquidity normalizing as Treasury account balances stabilize
Accelerating business cycle = Risk-on environment = Capital flows to growth/inflation hedges
✅ Long-Term Holder Conviction
LTH distribution pressure declining: Holders not dumping
Whale accumulation: $2.5B+ purchased in 24-hour window
On-chain data: 68.85% supply in profit (transition zone between cycles)
⚠️ HEADWIND FACTORS TO MONITOR:
❌ Near-Term Technical Pressure
Death cross warning: Moving average bearish crossover potential
Price 28% below all-time high ($126,199 Oct 2025)
January FOMC meeting: Potential volatility trigger (historical weakness pattern)
❌ Real Yield Dynamics
Analyst thesis: BTC trending toward $30k IF real yields spike
Risk: If inflation remains sticky + Fed stays hawkish, risk-off rotation possible
Fiscal uncertainty: Q3 2026 likely more volatile (mid-term elections, debt ceiling debates)
❌ Seasonal/Historical Patterns
2025 ended RED (-6% yearly performance) - rare for 4-year cycle
January seasonality: Portfolio rebalancing can trigger 3-5% pullbacks
Previous ATH cycles: Final 30% of rally often compressed into final weeks (distribution risk)
❌ Correlation with Gold/Silver
Precious metals outperforming BTC recently (macro flight-to-safety)
Government debt crisis concerns (US 120%+ debt-to-GDP, Japan 220%+)
If DXY (Dollar Index) rallies past 100, BTC faces headwinds
📅 2026 QUARTERLY OUTLOOK:
Q1 2026 - Mixed/Cautious Sentiment
Analyst Consensus: Mixed outlook with portfolio rebalancing pressures. Key Events: FOMC meetings, January-March volatility. BTC Directional Bias: Range-bound consolidation between $85K-$95K. Institutional accumulation continues but macro headwinds remain.
Q2 2026 - Bullish Breakout Phase
Analyst Consensus: Strong bullish conviction building. Key Events: Fed pivot confirmation expected, ETF inflows resume, regulatory clarity materializes. BTC Directional Bias: Break above $96.5K target zone likely. Momentum shifts toward risk-on environment.
Q3 2026 - Mixed/Corrective Period
Analyst Consensus: Cautious, seasonal weakness patterns emerge. Key Events: Mid-term elections uncertainty, summer doldrums, profit-taking cycles. BTC Directional Bias: Correction period likely, pullback toward $80-85K support zones. Consolidation phase before final Q4 rally.
Q4 2026 - Bullish Year-End Rally
Analyst Consensus: Strong bullish momentum returns. Key Events: Year-end reallocation, institutional bonus period spending, holiday season liquidity surge. BTC Directional Bias: Drive toward $125K+ resistance, potential breakout above ATH into 2027. Final leg of macro bull cycle.
🎲 POSITION MANAGEMENT RULES
Entry Execution: Use limit orders ONLY - don't chase market entries
Scaling: Enter 5% position per layer, never all-in
Take Profits: Sell 20-30% at each target level (pyramid profit-taking)
Trail Stop: Move stop-loss to entry after hitting +2R profit
Time Management: Hold swing trade 5-14 days minimum for layer rebalance
⚡ CRITICAL DISCLAIMERS
🔴 THIS IS NOT FINANCIAL ADVICE
Your stop-loss, position size, and profit targets are YOUR responsibility
Only risk capital you can afford to lose completely
Past performance ≠ future results
Cryptocurrency volatility can exceed 20% in 24-hour periods
Institutional accumulation data doesn't guarantee price appreciation
Do Your Own Research (DYOR): Verify all technical levels on your own charts. Cross-reference fundamentals with latest news sources.
🎯 ENGAGEMENT BOOSTERS FOR TRADINGVIEW VIEWERS
✨ Why This Setup Stands Out:
Rare Institutional Setup: Multi-month consolidation with whale accumulation = Low-risk entry
Clear Risk/Reward: $5K risk → $10K+ profit potential (2:1+ ratio)
Layered Entry Method: Professional execution without guesswork
Macro-Aware: Incorporates Fed policy, ETF flows, regulatory catalysts
📊 Share If You:
Believe BTC breaks $100K in Q1-Q2 2026
Are using limit orders to build positions
Want to escape the "HODL only" mentality with active swing trading
🔔 Follow for: Daily technical updates, real-time layer entry alerts, profit target callouts
Bias: Swing Trade Bullish (Medium Probability 65%) | Risk Profile: Intermediate-Advanced Traders Only
Remember: Trading is 90% psychology, 10% execution. Master yourself before mastering the markets. 🧠💪

BTC/USDT - Demand Holding Strong (18.12.2025)📝 Description🔹 Market Structure WHITEBIT:BTCUSDT
BTC has formed a clear Double Bottom pattern inside a strong demand / support zone, signaling potential trend exhaustion on the downside. Price respected the support zone multiple times
Momentum is attempting to shift from sellers to buyers. This structure favors a bullish reversal if confirmation holds.
📌 Trade Plan 🟢 Bullish above the support zone
Entry Idea: Buy on pullback / breakout confirmation above trendline
🟢 1st Resistance: 91,900 – 92,000
🟢 2nd Resistance / Target: 94,100 – 94,200
#Bitcoin #BTCUSDT #CryptoTrading #DoubleBottom #PriceAction #SupportResistance #CryptoAnalysis #TradingView #Kabhi_TA_Trading
⚠️ Disclaimer
This analysis is for educational purposes only.
Crypto markets are volatile — always use proper risk management and a stop-loss.
❤️ Support the Work👍 Like if you see the reversal💬 Comment: Bullish or Fakeout? 🔁 Share with your crypto friends

Today - Bitcoin Genesis Day Today, January 3, 2026, marks Bitcoin’s birthday (Bitcoin Genesis Day), as it was on January 3, 2009 that the unknown creator Satoshi Nakamoto mined the Genesis Block (Block 0) of the blockchain network. This is the symbolic launch date of the first decentralized cryptocurrency, which became the foundation of the entire system.
Key points:
Date: January 3, 2009
Event: Mining of the first block (Genesis Block)
Significance: The official start of the Bitcoin network and the foundation of the cryptocurrency revolution
Reward: In this first block, Satoshi Nakamoto received 50 BTC, and the block’s hash contains a headline from The Times newspaper, confirming the time of its creation.

BTCUSDT: Bullish Push to 90750?BINANCE:BTCUSDT is eyeing a bullish rebound on the 4-hour chart , with price bouncing from an upward trendline near support, converging with a potential entry zone that could spark upside momentum if buyers hold against short-term dips. This setup suggests a recovery opportunity after recent pullback, targeting higher resistance levels with 1:2 risk-reward .🔥
Entry between 87870–87100 for a long position. Target at 90750 . Set a stop loss at 86420 , yielding a risk-reward ratio of 1:2 . Monitor for confirmation via a bullish candle close above entry with rising volume, leveraging Bitcoin's resilience near the trendline.🌟
📝 Trade Setup
🎯 Entry (Long):
87,100 – 87,870
(Entry within this zone is valid with strict risk & capital management due to elevated volatility.)
🎯 Target:
• 90,750
❌ Stop Loss:
• 86,420
⚖️ Risk-to-Reward:
• ~ 1:2
⚠️ High-Risk Setup
💡 Your view?
Does BTC hold the ascending trendline and push toward 90,750, or does volatility drag price into a deeper correction first? 👇
