BTCUSD: Stabilize above 105,000BTC rose to break through and stabilizing above 105,000 today, surpassing last week's short-term resistance level. Next, we will focus on whether the key resistance level at 108,000 can be broken.
We predict that Bitcoin's movement today will fluctuate within the range of 104,000-108,000. If it can sustain a breakthrough above 108,000, we expect an upward trend to emerge this week.
Buy 103,000 - 103,500
SL 102,500
TP 104,500 - 105,000 - 105,500
Sell 105,500 - 106,000
SL 106,500
TP 104,500 - 104,000 - 103,500
Btcusdtlong

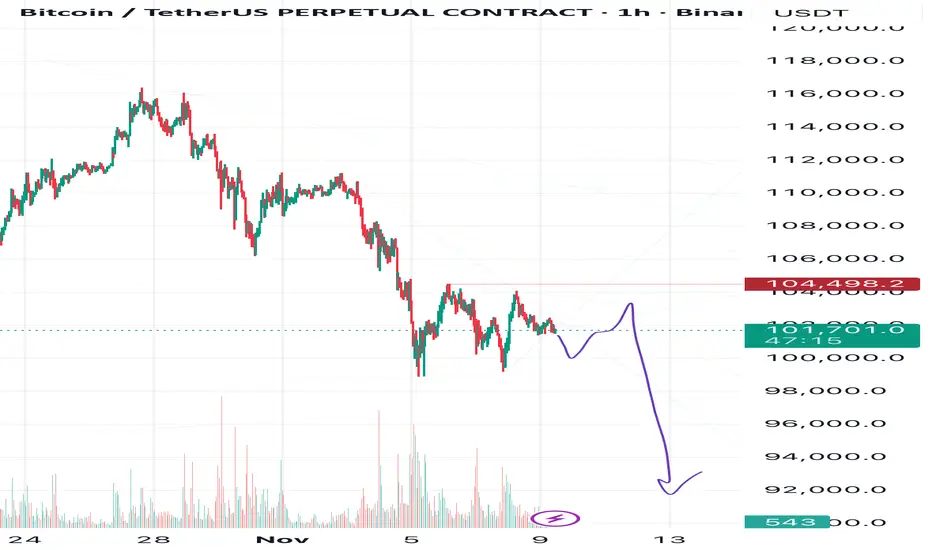
Bitcoin Daily View — Triangle in Play, Bears May StayIn my view, Bitcoin is currently forming a corrective triangle (ABCDE), and the breakout seems more likely to occur to the downside.
🎯 Targets:
• 1️⃣ 98,000
• 2️⃣ 94,000
• 3️⃣ 92,000
❌ Invalidation Level: 104,500
In my previous posts, I mentioned that I expect Bitcoin to eventually reach 83,000, but for now, I’m setting my target at 92,000, as I don’t think it will drop that far immediately.
⚠️Disclaimer: This is just my personal market view, not financial advice. Always trade with stop-losses!
💬 Share your thoughts in the comments and follow for upcoming Bitcoin updates!
BTCUSD: The resistance level at 105,000 remains firmBTC rebounded above 104,000 on Friday but then came under pressure and pulled back. It traded in a narrow range between 101,400 and 104,000 throughout Saturday, which also confirms the accuracy of our prediction about the resistance level at 105,000. Bitcoin can only see sustained gains if it breaks through 105,000 and stands firmly above 108,000.

BTCUSD: Overall trend is moving downwardLooking at the candlestick chart, Bitcoin has formed a potential M-top or double top pattern, which is a typical top reversal signal. Currently, the price has broken below all short-term moving averages, indicating obvious weakness.
Yesterday, it is consistent with my analysis. BTC broke below the short-term support at 102,000, fell to around 100,000 where it found support and rebounded. However, this also showed an overall downward shift in the trend, with yesterday’s short-term support at 102,000 having turned into today’s resistance.
Overall, I predict that Bitcoin will continue its overall downward trend today. The short-term support is at 100,000, and a break below this level would target 98,000.
For resistance above, we still focus on 105,000 in the short term, with key attention on 108,000. Only a breakthrough and a firm hold above 108,000 could lead to sustained gains.
Buy 100,000 - 100,500
SL 99,000
TP 102,000 - 102,500 - 103,000
Sell 103,500 - 104,000
SL 104,500
TP 102,000 - 101,500 - 101,000

BTCUSD: Consolidation is the main theme todayYesterday, BTC saw intense battles around the psychological threshold of 100,000. During the session, it once broke below the key support at 99,500, then rebounded to around 104,000.
Today, it pulled back to around 102,000 at the opening of the Asian session and began to consolidate again.
On the upside, the 105,000-105,500 zone forms a crucial resistance range. Only a daily close firmly above this level can confirm the reversal of the short-term downtrend. For today's short-term support, we still focus on 100,000. If it breaks below 100,000, we need to pay key attention to the supporting role of 98,000.
Buy 100,500 - 101,000
SL 100,000
TP 102,000 - 102,500 - 103,000
Sell 103,000 - 103,500
SL 104,000
TP 101,500 - 101,000 - 100,500

BTC is pulling back to test support levelsToday, BTC has shown an overall volatile trend. A death cross signal has appeared on the daily chart, with short-term moving averages forming a bearish alignment, indicating a short-term bearish trend.
Overall, BTC has clearly entered a correction phase in the short term, and the price may continue to test lower support levels. We will pay short-term attention to the support at 102,000, with key focus on the critical support at 100,000.
For resistance above, the short-term level is at 105,000, and the key level to watch is 108,000. If it can stand firmly above 108,000, a rebound into an upward trend may occur.
Buy 102,000 - 102,500
SL 101,000
TP 103,500 - 104,000
Sell 104,500 - 104,000
SL 105,000
TP 103,000 - 102,500

#BTCUSDT:Last Drop at 98K Before Hitting 140K?Bitcoin dropped significantly after reaching a record high of 125k. This comes after we announced a 100% tariff on China, creating fear in the global market, especially among crypto investors. We can now see a clear pattern forming, the AB=CD pattern, which is likely what others are also seeing.
Good luck and trade safely!
Team Setupsfx_

Bitcoin at Make-or-Break Zone. History Says Bounce Incoming!IG:BITCOIN is currently trading above the 50 EMA on the 1W chart, a level that has historically acted as a strong dynamic support during previous bullish cycles.
Each time CRYPTOCAP:BTC has touched the 50 EMA in the past (as highlighted on the chart), it has triggered a strong rebound leading to significant upside moves. Currently, the price is consolidating near both the support zone and the 50 EMA, suggesting that the market is once again at a critical juncture.
If IG:BITCOIN manages to hold this zone and bounce, we could see the next bullish leg pushing towards $150K. However, a clean break below the 50 EMA and support area could indicate a short-term downtrend or deeper correction before resuming the uptrend.
Traders should stay patient and prepared for all possible scenarios. Risk management remains key at these levels.Plan your entries and stops accordingly.

Bitcoin BullishThis crypto has been bearish for the past few days, and has reached a POI, 1 H our demand Zone.
I anticipate a slight bullish pullback towards the 109 - 110k supply Zone.

BTC/USD POTENTIAL BULLISH REVERSAL SETUPAnalysis:
Bitcoin (BTC/USD) is currently consolidating near the $106,800 area after a strong bearish move that broke multiple structures. The chart shows clear Smart Money Concepts (SMC) signals such as Change of Character (CHoCH) and Break of Structure (BOS), indicating the end of the recent downtrend and the potential start of accumulation before a bullish correction.
After liquidity was collected below the Equal Lows (EQL) near $106,000, buyers have begun to show interest, forming a potential reversal pattern. Price is now reacting to a demand zone and showing early bullish signs.
Key Technical Highlights:
Market Structure: After a strong bearish break, BTC is forming a base with BOS confirmation — signaling possible trend reversal.
Equal Lows (EQL): Liquidity has been swept below $106,000, suggesting institutional accumulation.
Entry Zone: Around $106,600 – $106,800 (after minor pullback and confirmation).
Target Zone: $108,500 – $109,700, aligning with the next supply area and previous structural highs.
Stop-Loss Area: Below $105,500, under the liquidity sweep zone for safety.
Bias:
Bullish (short-term) — as long as price holds above $106,000, BTC is likely to continue toward $109,000+.
BTC/USD is showing early signs of reversal after liquidity collection below key lows. A pullback toward $106,500 could offer an ideal long entry opportunity, with upside targets around $109,700. Traders should watch for bullish confirmation before entering to validate momentum continuation.

Ready for BTC/USDT's Next Big Move?🎉 BTC/USDT: "Bitcoin vs. Tether" Crypto Wealth Heist Map (Swing/Day Trade) 🤑
🚨 Thieves of the Crypto Market, Assemble! 🚨
Ready to pull off a stylish swing/day trade heist on BTC/USDT? This is your Crypto Wealth Strategy Map with a bullish setup that’s screaming opportunity!
📈 Let’s dive into this cheeky yet professional plan with a sprinkle of thief swagger to snatch those profits! 💰
📊 The Setup: Why This Trade is a Steal! 🕵️♂️
Bullish Confirmation: We’ve got a double bottom pattern signaling a potential reversal. ✅
Accumulation Zone: Price action shows buyers stacking up, ready to push BTC higher. 🛒
Heikin Ashi Reversal: Smooth, green Heikin Ashi candles confirm the bullish vibes. 🟢
Market Sentiment: The crypto streets are buzzing with optimism — time to capitalize! 😎
The Thief’s Entry Plan: Layered Limit Orders 💸
This is where our thief strategy shines! We’re using a layering strategy with multiple buy limit orders to sneak into the market like the slick bandits we are. 🕴️
Entry Levels:
🎯 $112,000
🎯 $113,000
🎯 $114,000
🎯 $115,000
🎯 $116,000
Pro Tip: Feel free to add more layers based on your risk appetite! Stack those orders like a master thief planning the perfect heist. 😏
Why Layering?: This approach lets you average into the position, reducing risk if the market pulls a fast one. 🃏
🛑 Stop Loss: Protect Your Loot! 🔒
Thief’s Stop Loss: Set at $110,000. This is our escape hatch if the market turns into a trap. 🕳️
Note: Dear Thief OGs (Ladies & Gentlemen), this SL is just a suggestion. You’re the boss of your own vault — adjust it to your risk tolerance! 💪
🎯 Target: Cash Out Like a Pro! 🏦
Profit Target: Aim for $127,000, where we expect strong resistance and potential overbought conditions. Watch out for a possible trap — don’t get greedy! 😈
Note: Dear Thief OGs, this TP is my take. You decide when to grab your profits and vanish into the crypto night. 🌙 Take the money and run at your own discretion!
🔗 Related Pairs to Watch 👀
Keep an eye on these correlated pairs (all in USD) to confirm the broader market trend:
BITSTAMP:ETHUSD : Ethereum often moves in tandem with Bitcoin. A bullish ETH could reinforce BTC’s upward momentum. 📈
BITSTAMP:XRPUSD : Ripple’s price action can signal broader crypto market strength. Watch for similar bullish patterns. 🌊
COINBASE:LTCUSD : Litecoin tends to follow BTC’s lead. A breakout in LTC could confirm our bullish bias. ⚡
Key Correlation Insight: These pairs often move together due to shared market sentiment in the crypto space. If BTC/USDT pumps, expect ETH, XRP, and LTC to potentially follow suit. Cross-check their charts for confluence! 🧠
🛠️ Technicals Recap: The Thief’s Toolkit 🧰
Double Bottom: A classic reversal pattern signaling bulls are ready to charge. 🐂
Accumulation Zone: Buyers are quietly stacking positions — a sign of strength. 📦
Heikin Ashi: Smooth candles filter out noise, confirming bullish momentum. 🕯️
Resistance Watch: $127,000 is a key level where sellers might step in. Stay sharp! ⚠️
⚠️ Disclaimer: Thief Style, Just for Fun! 😜
This Thief Strategy is for entertainment and educational purposes only. Trading is risky, and the crypto market can be a wild ride. Always do your own research (DYOR) and manage your risk like a seasoned bandit. I’m not a financial advisor, just a cheeky chart enthusiast sharing the vibe! 😎
✨ If you find value in my analysis, a 👍 and 🚀 boost is much appreciated — it helps me share more setups with the community!
#BTCUSDT #CryptoTrading #SwingTrading #DayTrading #ThiefStrategy #Bullish #TechnicalAnalysis #HeikinAshi #DoubleBottom #MakeMoney

#BTC Long toward $12100BTC is moving sideways as @unknown highlights current price near $109,942 aiming for a bullish breakout 📈 with targets around $123,313 noted on the chart.

From 107K to 104K — Bitcoin’s Next Stop Before the Big Drop?An update to my previous Bitcoin outlook — we’ve almost reached my 107K target.
Now, I’m setting a new short-term goal at 104K, though I believe we might even dip toward 100K.
Let’s see how the chart reacts as we approach the 104K zone.
On a larger scale, as I mentioned in one of my earlier posts, my global target remains around 83K.
The invalidation zone for this scenario is marked directly on the chart.
Let’s summarize 👇
📉 Nearest target: 107K (almost reached)
📉 Next target: 104K
📉 Possible drop to: 100K
🌋 Global target: 83K
👁️Follow me so you don’t miss future updates to my forecasts!

BTC/USDT Setup Confirmed – Capital Flow Points to Upside!🚀 BITCOIN (BTC/USDT) Capital Flow Blueprint: Smart Pullback + Liquidity Grab Strategy
📊 Setup Overview
Asset: BTC/USDT | Strategy: Swing Trade | Bias: Bullish with Pullback Confirmation
🎯 Trading Plan Thesis
Bullish structure confirmed with Volume-Weighted Moving Average (VWMA) Pullback + Liquidity Zone Grab. Bitcoin continues to accumulate at demand zones while respecting higher timeframe resistance. This layered entry strategy captures value during temporary pullbacks before the next impulse.
Current Market Context: BTC trading near $109,768 (as of November 1, 2025)
📍 Entry Strategy: Multi-Tier Limit Orders (Layering Method)
Think of this as smart accumulation zones rather than one aggressive entry:
Layer 1: $106,000-107,000 (Deep pullback target)
Layer 2: $107,500-108,000 (Mid-level support)
Layer 3: $108,500-109,000 (Current support zone)
Ratio: Scale position size across layers (30%-40%-30% allocation suggested). This approach reduces timing risk and averages your entry price during volatility.
🛑 Stop Loss: Risk Management First
SL Level: $105,000
Rationale: Sits below the 4-hour swing low, providing buffer for wick rejection while maintaining favorable risk-reward ratio
⚠️ Risk Disclaimer: Stop loss placement is YOUR decision based on your account size and risk tolerance. Never risk more than 2% of your trading capital per trade.
📈 Take Profit: Multi-Exit Strategy
Target: $119,000
Confirmation: ATR (Average True Range) acting as resistance + Overbought RSI confluence + Previous resistance break
Exit Plan:
Partial 1 (50%): $115,000 (Take some profits early)
Partial 2 (30%): $117,000 (Lock in most gains)
Final (20%): $119,000 (Let runners chase the moon 🌙)
⚠️ Risk Disclaimer: Profit targets are based on technical analysis. Market conditions change. Take profits at levels that suit YOUR strategy and risk profile.
🔗 Correlated Pairs to Monitor (Market Ecosystem Check)
Direct Correlation Pairs:
ETH/USD ($3,865): Major altcoin bellwether. Watch 1-4 hour RSI divergence
BNB/USD (~615): Binance ecosystem health indicator
SOL/USD (~245): Alt season strength confirmation
Inverse Watch:
USDT Dominance: If BTC dominance drops >59%, profit-taking likely incoming
VIX Index: Higher volatility = more chop (avoid during spikes)
💡 Key Technical Points
✅ Volume Profile: Sellers exhausted at $105K-106K zone
✅ Order Flow: Institutional absorption at weekly support
✅ Micro Resistance: $112,000-113,500 (breakout confirmation needed)
✅ Macroeconomic: Fed sentiment + Bitcoin ETF flows = liquidity tailwind
⚡ Pro Tips for Better Execution
Timeframe: Confirm entry on 4-hour chart before scaling on 1-hour bounces
Volume Filter: Only take Layer 1/2 if volume > 20-day average
News Calendar: Avoid entries 2 hours before major economic data
Trail Stop: Move stop to breakeven once price hits Layer 3 + $1,000
🎁 Community Love
✨ "If you find value in my analysis, a 👍 and 🚀 boost is much appreciated — it helps me share more setups with the community!"
#Bitcoin #BTC #CryptoTrading #SwingTrade #TechnicalAnalysis #LiquidityGrab #VWMA #CryptoChart #TradingStrategy #CryptoSignals #LayeringStrategy #BTCUSD #CryptoAnalysis #TraderLife #AlgoTrading

BTC/USD BULLISH REVERSAL SETUP TARGET 111K, 113K, 115.Key Levels:
Entry Zone: Around 109,800 – 110,000
Price is consolidating just above this level, indicating possible re-accumulation.
Stop Loss: Below 108,300 – 108,400
This sits under the recent swing low (a strong liquidity area).
Targets:
Target 1: 111,637 → Reclaim of structure high.
Target 2: 113,656 → Previous supply zone / liquidity pool.
Target 3: 115,249 → Full bullish objective and previous major high.
Structure & Smart Money Flow:
The chart shows BOS (Break of Structure) and CHoCH (Change of Character) signals, implying the bearish trend may be reversing.
Price likely tapped into a demand zone below liquidity (Stop Hunt) before showing bullish intent.
The marked consolidation suggests Smart Money accumulation, preparing for a possible upside expansion.
Strategy Outlook:
✅ Bullish Confirmation: A clear break and retest above 110,000–111,000 zone would confirm buyers in control.
⚠️ Invalidation: A break below 108,300 would invalidate the bullish scenario and could resume the bearish trend toward 107,000–106,000 support.
🎯 Risk-to-Reward: Approx. 1:3 to 1:5, favoring long positions if executed near entry.
Summary:
Market Structure: Bullish Reversal Forming
Entry Zone: 109,800 – 110,000
Stop Loss: 108,300
Targets: 111,637 → 113,656 → 115,249

#BTCUSDT(BITCOIN): Swing Buy, Price Heading Towards Previous HH!Bitcoin is nearing a previous high of 126K. As of the latest data, it trades around 112K, with a 24-hour volume of $38 billion and a market capitalisation of $2.1 trillion. However, before reaching that level, it’s likely to correct towards our entry zone between 108K and 110K. This level is significant because we anticipate a substantial increase in market volume. Historical data shows that similar corrections have led to a 15–20% increase in trading activity.
On-chain metrics indicate a 7% rise in active wallets over the past week, and institutional inflows totalled approximately $1.3 billion in the last seven days. The Bitcoin dominance index currently sits at 54%, suggesting continued interest despite broader market fluctuations.
This short-term view allows us to observe the price accumulating and on the verge of distribution. Based on your trading style, you can select one of three targets:
- Target 1: 118K (conservative)
- Target 2: 122K (moderate)
- Target 3: 126K (aggressive)
We wish you the best of luck and trade safely. If you find our work helpful, please like and comment on our ideas.
Team Setupsfx_

No Rise in Sight — 107K Might Be RightAt the moment, I don’t see any technical reasons for Bitcoin to continue its rally.
For now, I’d like to see Bitcoin move down toward the 107K area or even lower.
The invalidation level of this scenario is marked in red on the chart

BTC $115,200 TARGET BREAKOUT: The Ultimate Long SignalThe Logic Behind $115,200: This analysis pinpoints the critical multi-year resistance/supply zone at $115,200. A confirmed close above this level is the ultimate trigger for the next parabolic leg up in the Bitcoin cycle. Our proprietary provides a filtered, no-noise signal specifically for this major breakout level. Key Features: * Precision Entry: Alerts only on the confirmed breach of the 115,200 supply * Risk Management: Includes projected Take Profit 1 & 2 targets * Filtered Noise: Uses to validate the move Action: Set your alerts and prepare for liftoff! The market structure dictates that this level is make-or-break for a new All-Time High pursuit.

BITCOIN BREAKOUT CONFIRMATION AND BULLISH CONTINUAION SETUPTechnical Analysis (3H Chart)
1. Market Structure:
The chart shows a clear uptrend phase earlier, followed by a corrective pullback.
Recently, Bitcoin has formed a Change of Character (CHoCH), indicating a potential shift back to bullish momentum after the correction.
Price has broken key resistance around $114,500–$115,800, confirming short-term bullish strength.
2. Key Zones:
Support Zone: $110,000–$112,000 (previous consolidation area; strong liquidity zone).
Resistance / Target Zone: $120,000–$121,000 (major supply area & top of descending channel).
3. Current Price Action:
BTC is currently testing the CHoCH breakout area (~$115,000–$116,000).
A minor pullback (retest) toward the breakout level is expected before another bullish leg begins.
The “eye” symbol suggests monitoring this retest for a long entry confirmation.
4. Target Projection:
If the breakout retest holds, the next target lies near $120,500, aligning with previous highs and upper trendline resistance.
5. Technical Outlook:
✅ Bias: Bullish (short to medium term)
📈 Entry Zone: $114,800–$115,500 (retest zone)
🎯 Target: $120,000–$121,000
🛑 Invalidation: Below $113,000 (structure break)

BTC: The overall trend remains oscillating upwardThe BTC is staying in the middle of the "support-resistance" range, with intense long-short competition, the overall trend remains oscillating upward
From a technical pattern perspective, the short-term support lies between 109,000 and 108,000. There have been multiple rebounds after stabilizing in this support range, indicating relatively strong buying support below. The resistance level at 113,000, as a previous pressure level, could open a new upward space toward 115,000 if it is broken with volume.
Considering the macroeconomic factors, if market risk appetite rises, Bitcoin is expected to test the resistance level upward based on the support range. If risk aversion heats up, we need to be vigilant about the risk of a pullback to test the support.
💎Trading Strategy:
Buy 110,000 - 110,500
SL 109,500
TP 111,000 - 111,500 - 112,000
Sell 112,000 - 111,500
SL 111,000
TP 110,500 - 110,000 - 109,500
Daily-updated accurate signals are at your disposal. If you run into any problems while trading, these signals serve as a reliable reference—don’t hesitate to use them! I truly hope they bring you significant assistance

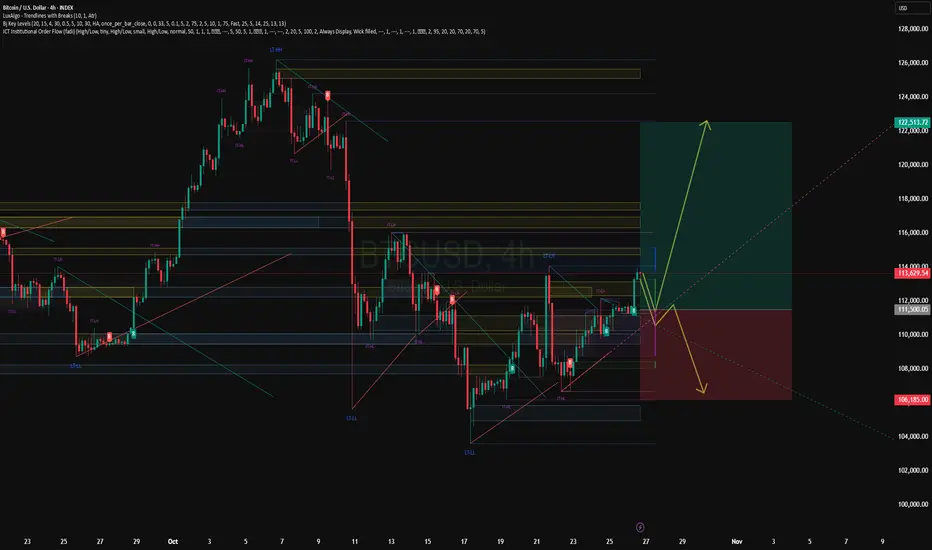
BTC/USD: Final wave before breakout or correction signal?BTC/USD: Final wave before breakout or correction signal?
📊 Monthly Technical Analysis — Bitcoin (BTC/USD)
Using support/resistance levels and wave analysis
🌀 Wave Context
According to the Elliott Wave Principle model, Bitcoin may be either in the final impulse wave (5) or at the start of an A-B-C corrective structure.
Wave (4) is expected to have ended near the $100,000-$110,000 zone. If wave (5) starts, it could signal a significant upward move. Otherwise, a breakout of support could signal a correction.
📈 Monthly Scenarios
Bullish scenario: BTC holds above $110,000 → breakout to $120,000 → start of wave (5) → move to $135,000+.
Consolidation: The price moves sideways between ~$110,000 and ~$120,000, accumulating strength before a new move.
Bearish scenario: Breakout of support at ~$110,000 with volume → correction to ~$100,000 or lower.
✅Conclusion
On the monthly timeframe, BTC/USD is at a crossroads: it is either entering a powerful uptrend or a significant correction is beginning.
The ~$110,000 level is a key marker for the continuation of the bullish structure.
A breakout above $120,000 is a signal for growth.
A breakout below $110,000 is a signal for caution.
Monitor price movement relative to these levels and confirmation of the wave structure before making trading decisions.
BTCUSD: Final Wave Before the Breakout or Stuck Five-Wing?BTCUSD: Final Wave Before the Breakout or Stuck Five-Wing?
Weekly Scenarios
Bullish scenario: BTC holds above ~$110,000, breaks through ~$120,000 → wave (5) activates → target ~$135,000–$140,000.
Consolidation: Trading between ~$110,000 and ~$120,000; the market is building strength for the next round.
Bearish scenario: Break of support at ~$110,000 with volume confirmation → correction begins to ~$100,000–$105,000.
Conclusion
The weekly analysis shows that the BTC/USD market is at a crossroads: either the final wave of growth begins, or a correction begins.
Holding the ~$110,000 zone is critical for maintaining bullish sentiment.
A breakout above ~$120,000 is a signal for growth.
A breakout below ~$110,000 is a signal for caution.

BTC: Correct prediction today👏Our prediction for Bitcoin's short-term fluctuation characteristics has also been accurately validated today.
✔We indicated that it would fluctuate around the key range in the short term, and in reality, Bitcoin has shown obvious wide-ranging fluctuations today, which is in complete alignment with the preset oscillation pattern.
✔Meanwhile, the market's competition for key levels has also confirmed our judgment:after testing the high level, the price gradually pulled back and then rebounded, highlighting the suppressing effect of the upper resistance. Moreover, the "V-shaped" rebound trend during the session has further verified the effectiveness of the short-term support range, which is highly consistent with our core prediction logic that Bitcoin is in a "shock adjustment phase, with price movements dominated by key levels".
