BTC: Shows an obvious volatile trendToday, BTC’s situation is relatively complex, with intertwined bullish and bearish factors, showing a volatile trend.
Price Movement: There has been sharp volatility, with rapid rises and falls. From the hourly chart, the price surged to around 114,000 last night, followed by a significant pullback from the highs, retesting the key support level around 107,500.
Influencing Factors:
News: The Federal Reserve held a meeting with payment companies to facilitate better institutional access to the stablecoin sector. This news triggered a short-term surge in Bitcoin prices. However, subsequent remarks by Trump proposing a 155% tariff led to a price decline. The uncertainty in news has had a significant impact on the market.
Market Sentiment: The fear index stands at 25, indicating a tendency toward panic in market sentiment. Additionally, the large traders’ long-short ratio shows a slight dominance of bears at 52.34%, reflecting relatively stronger short-term bearish momentum in the market.
Capital Flow: U.S. Bitcoin ETFs have seen net inflows exceeding $3.6 billion this month, the highest since January. Institutions like BlackRock continue to increase their holdings, forming bottom buying support for prices. However, the total open interest across the network has reached $48 billion, highlighting high leverage risks. A sharp price fluctuation could trigger massive contract liquidations, exacerbating market volatility.
Technical Analysis: On the hourly timeframe, the MACD has re-formed a death cross pointing downward. Although the blue bars have shortened and started to turn red, indicating a partial shift in short-term momentum, bears still hold the overall advantage. The upper resistance level is around $111,000, and the lower support level is around $107,500. A break below this key support could lead to further downside.
Trading Strategy:
Focus on range-bound trading. Avoid taking positions at mid-range levels, exercise caution in chasing trends, and patiently wait for key levels to enter trades.
Buy 107,500 - 108,500
SL 106,500
TP 109,500 - 110,500 - 111,500
Sell 111,000 - 110,500
SL 112,000
TP 109,500 - 108,500 - 107,500
Daily-updated accurate signals are at your disposal. If you run into any problems while trading, these signals serve as a reliable reference—don’t hesitate to use them! I truly hope they bring you significant assistance
Btcusdtlong

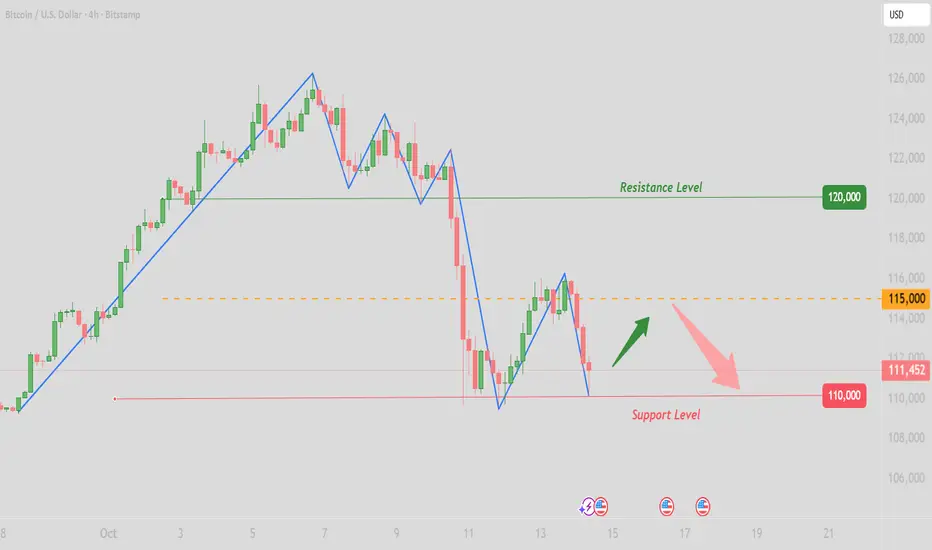
BTCUSDT — at Edge of the Trend: Bullish or the Next Bear Trap?Main Narrative
Bitcoin is standing at a critical crossroads. After a deep correction from the 126K peak, the price is now forming a Symmetrical Triangle Pattern — a classic setup that appears when the market holds its breath before a major move.
Pressure from both sides — a descending resistance from sellers above and an ascending support from buyers below — is squeezing the price closer to the apex, the point where a decisive breakout becomes inevitable.
The next movement will decide whether the bulls regain control or the bears reclaim dominance.
---
Pattern & Structure Analysis
This triangle has formed after a strong downtrend, signaling a phase of consolidation and uncertainty.
There was one false breakout to the upside (yellow ×) — a typical liquidity trap where market makers lure buyers before pulling the price back inside the pattern.
Currently, Bitcoin remains trapped between:
Descending resistance (upper yellow line): around 110K–112K
Ascending support (lower yellow line): around 106.7K
This is a pressure zone — the longer the price stays inside, the more explosive the breakout will be once it happens.
---
Key Levels
Main Resistance: 110K – 112K (breakout zone)
Primary Support: 106.7K (bulls’ last stand)
Secondary Support: 103.6K and 102.1K (critical continuation zone)
Bullish Targets: 116K–118K (retest of previous resistance), and up to 126K if momentum expands
Bearish Targets: 103K → 102K → potential breakdown continuation below 100K if selling pressure dominates
---
Bullish Scenario — “Real Breakout or Just Another Trap?”
If the 4H candle closes above 112K with strong volume confirmation:
Buyers regain short-term control.
First target lies around 116K–118K (prior supply zone).
Sustained momentum could lift the price back toward 126K — the previous major high.
However, without volume confirmation, any breakout could turn into a second fake rally, often followed by a sharper decline.
---
Bearish Scenario — “Support Break = Bearish Continuation”
If the price breaks below 106.7K, confirmed by a strong 4H close and rising sell volume:
The breakdown could drive the price toward 103.6K, then 102.1K.
A confirmed close below 102K may trigger panic selling and open a path toward the next psychological zone below 100K.
In this case, the triangle would represent a continuation pattern, not a reversal — signaling further downside.
---
Market Psychology
This chart perfectly reflects a battle of patience between buyers and sellers.
The longer the consolidation lasts, the more energy builds up behind the next move.
Experienced traders know: long consolidations often end with violent breakouts.
---
Strategy & Key Notes
Wait for a confirmed 4H candle close beyond the triangle with strong volume.
Breakouts without volume = traps.
Keep position size small until direction is confirmed.
Enter only after a successful breakout retest to reduce risk exposure.
---
Conclusion
Bitcoin is entering a decisive phase.
A confirmed breakout above 112K could ignite a bullish run toward 116K–126K,
while a breakdown below 106K would confirm that the market is leaning back into a bearish phase.
This isn’t just another triangle — it’s a critical point that will define the medium-term trend for Bitcoin.
---
#Bitcoin #BTCUSDT #CryptoAnalysis #Breakout #TechnicalAnalysis #TrianglePattern #BTC #CryptoTrading #CryptoMarket

BTC:Continuing to pull back📈Looking at the 4-hour candlestick chart, Bitcoin continued to pull back and decline today. The short-term support level remains in the 107,000-107,500 range, which has provided support multiple times during previous downward movements. If the price breaks below this range, it may further drop to around 105,000. The resistance level is in the 112,000-113,000 range; a breakthrough here is expected to open up more upward space.
📝In the long term, after Bitcoin's fourth halving in April 2024, its daily production dropped from 900 to 450 coins, with the inflation rate falling below 1% for the first time. This has further strengthened its scarcity. Combined with the surge in institutional demand, the supply-demand gap is expected to widen, supporting a long-term upward price trend.
💡However, in the short term, the contradiction between continuous institutional inflows and profit-taking by short-term holders may lead to certain price fluctuations.
💎Trading Strategy:
Buy 107,000 - 107,500
SL 106,500
TP 108,000 - 109,000 - 110,000
Sell 111,500 - 111,000
SL 112,000
TP 110,000 - 109,000 - 108,000
Daily-updated accurate signals are at your disposal. If you run into any problems while trading, these signals serve as a reliable reference—don’t hesitate to use them! I truly hope they bring you significant assistance

Correct projection for BTCThe core conclusions of my analysis on Bitcoin today have all been verified by market trends, which can be summarized in three aspects: trend prediction, key level control, and trend logic:
1-Consistency with short-term trends: It was pointed out that "the 4-hour chart continues to pull back, with short-term support in the 107,000-107,500 range". Intraday BTC has continued to fluctuate around this support zone without breaking below the key level, and it was also noted that the resistance level is around 113,000,a breakthrough here is expected to open up more upward space. Today's fluctuations are completely in line with expectations.
2-Support from long-term logic: The long-term upward logic of "strengthened scarcity and expanded institutional demand after the 2024 halving" was reaffirmed. Although short-term fluctuations were affected by profit-taking, it has not deviated from the long-term positive framework.
3-We accurately captured "the restrictive effect of support and resistance levels on prices", with no deviations in judgments on "short-term fluctuation rhythm and long-term trend direction", effectively providing clear range and direction references for trading operations.

BTCUSDT — Decision Zone: Continuation or Major Correction Ahead?Bitcoin’s 2-Day chart (Bitstamp) is now approaching a critical macro zone — the $106,000–$101,000 support block, which acts as the last stronghold for bulls in this current uptrend.
This area represents a confluence of horizontal support and the main ascending trendline that has guided price since late 2024.
If buyers can defend this zone, Bitcoin could still experience one final leg up toward the cycle top.
However, a decisive breakdown below it would confirm the start of a major structural correction.
---
Structure and Pattern
Primary Pattern: Rising Wedge / Ascending Channel
The pattern indicates weakening bullish momentum — each higher high forms with less strength.
Such formations often end with a sharp breakdown once the support line fails.
Key Levels:
Support zone (yellow block): $106K – $101K
→ Confluence of trendline and horizontal support.
Immediate resistance: $116,500
Upper liquidity zone / cycle top target: $126K – $128.5K
---
Bullish Scenario — “The Final Push”
If Bitcoin successfully rebounds from the $106K–$101K zone, it could trigger the last upward wave toward $126K–$128.5K, potentially marking the final phase of this bull cycle.
Bullish Confirmation:
2D candle closes above $110K–$112K
Formation of a reversal pattern (hammer/pin bar) with increasing volume
Momentum indicators (RSI/MACD) start to turn upward
Upside Targets:
Target 1 → $116,500
Target 2 → $126K – $128.5K
Macro Narrative:
A bounce from this zone would likely lead to the final euphoric rally before distribution begins.
---
Bearish Scenario — “Breakdown of the Cycle”
If Bitcoin closes a 2D candle below $101K, the bullish structure will officially break down, confirming the start of a major correction phase.
This would validate the rising wedge pattern and shift momentum entirely to the bears.
Bearish Confirmation:
2D close below $101K
Failed retest around $104K–$106K
Rising selling volume
Downside Targets:
Target 1 → $92,500
Target 2 → $75,500
Macro Narrative:
A breakdown below $101K would mark the end of the bull market and the beginning of the re-accumulation phase below $90K.
---
Conclusion
Bitcoin is standing at its macro decision zone: $106K–$101K.
This range will determine whether we get one final bullish push — or the start of a major correction.
Holding above → potential rally toward $126K–$128K
Losing support → possible drop toward $92K–$75K
The next 2D candle will decide the macro direction of Bitcoin — continuation or collapse.
---
#Bitcoin #BTCUSD #BTCAnalysis #CryptoMarket #TechnicalAnalysis #PriceAction #SupportAndResistance #RisingWedge #BTCUpdate #BitcoinOutlook #CryptoTrend #MarketStructure #BitcoinChart #BTCOutlook

BTC holds firmly above 110,000Today, BTC exhibited a trend of first declining and then rising.
At the opening, Bitcoin once dipped to 107,466, but subsequently, bulls began to gain momentum, driving the price to recover gradually. It successfully broke through the 110,000 mark and continued to rise.
From the perspective of market sentiment, the Fear & Greed Index is in the "Greed" zone, with the current index standing at 70. This indicates that despite short-term price fluctuations, the market remains optimistic about the overall trend. Such sentiment helps sustain the current consolidation and may provide momentum for a subsequent rally.
In terms of capital flows, on-chain data shows that although the overall capital flow is relatively complex, whales have recorded a significant net inflow in the latest cycle. Their inflow volume reached 207 million BTC, far exceeding the outflow volume of 160 million BTC. This strong buying power is the core driving force behind Bitcoin's ability to gain support at high levels and continue its upward trajectory.
Short-term trend forecast:
In the short term, BTC is likely to consolidate around 110,000. Attention should be paid to the resistance level near 112,000–113,000 on the upside and the support level near 107,500-107,000 on the downside. If it can break through the upper resistance, the price may surge toward the 115,000–118,000 range; if it falls below the lower support, it may drop to 105,000 or even lower.
Trading Strategy:
Buy 108000 - 109000
SL 107000
TP 110000 - 111000 - 112000
Sell 112000 - 111000
SL 113000
TP 110000 - 109000 - 108000
Daily-updated accurate signals are at your disposal. If you run into any problems while trading, these signals serve as a reliable reference—don’t hesitate to use them! I truly hope they bring you significant assistance

Correct projection for BTCBTC's movement today is fully consistent with our analysis, fluctuating upward within the range of 107,000 to 112,000. In terms of operation, it is necessary to closely follow this fluctuation range, adopt the "high short, low long" strategy, accurately seize the entry timing, and timely take profits when reaching the target level to ensure gains are locked in.

BTC:Targets set at 109,800 - 111,000 after break above 107,500As we mentioned earlier, if Bitcoin breaks above 107,500 and remains stable, a minor rebound will occur, with targets set at 109,800 and 111,000. Let’s wait and see if it can reach this target range tomorrow.

BTC: Continuing to fluctuate between 106,000 and 107,500Today, BTC continues to trade within a narrow range and has repeatedly encountered resistance at the key level of 107,500. This level can be regarded as the bull-bear divide.
If the price can break above this level and stabilize, a small rebound is expected, with subsequent target levels around 109,800 and 111,000.
On the downside, we will focus on the support level around 106,000. If the price is suppressed from above and falls below this support level, it may continue to decline.
Buy 106000 - 106500
SL 105500
TP 107000- 107500
Sell 107500 - 108000
TP 109000
TP 106500 - 106000
Daily-updated accurate signals are at your disposal. If you run into any problems while trading, these signals serve as a reliable reference—don’t hesitate to use them! I truly hope they bring you significant assistance

BTC: Sharp VolatilityBTC exhibited a trend of rising first and then falling, with overall intense volatility,reflecting the uncertainty and complexity of the market.
From the perspective of short-term technical indicators, after Bitcoin’s price broke below the key range of 109,000–110,000, this area has now transformed into a resistance level. Currently, the price is fluctuating within the 106,000–107,000 range: it faces resistance near 107,500 on the upside, while receiving support from the 103,000–104,000 range on the downside. If the price fails to break through the 107,500 resistance level effectively, it may continue to face downward correction pressure.
Buy 106000 - 106500
SL 105500
TP 107000- 107000
Sell 107500 - 108000
TP 109000
TP 106500 - 106000
Daily-updated accurate signals are at your disposal. If you run into any problems while trading, these signals serve as a reliable reference—don’t hesitate to use them! I truly hope they bring you significant assistance

BTC Performance Recap for the week🎉This week, BTC generally exhibited intense volatility, following a trajectory of "continuing the previous uptrend first, then oscillating downward, and finally rebounding after touching support".
📝Monday: Continuing the Uptrend and Breaking Key Levels
Building on the upward momentum from the previous weekend, Bitcoin’s price smoothly broke through the key psychological level of 115,000 and did not stop there—it continued to climb to around 116,000, setting a stage of interim highs for the week’s trend.
📝Tuesday to Thursday: Oscillating Downward and Losing Key Support
The uptrend failed to sustain. Starting from Tuesday, Bitcoin entered a phase of oscillating decline; its price gradually pulled back and broke below the short-term key support level of 110,000 in the process. Downward pressure continued to release, and the weak sentiment persisted all the way to Friday.
📝Friday: Bottoming Out, Rebounding on Support, and Consolidating in a Narrow Range
On Friday, when the price further dipped to just above 103,000, it received strong support at this level and staged a rebound, easing the previous downward momentum. However, the rebound lacked strength and failed to retake the 110,000 level.
📝As of now, it remains fluctuating in a narrow range between 106,000 and 107,600.
💡It was mainly influenced by a combination of factors including macroeconomic policies, market sentiment, and technical indicators. The details are as follows:
💎Reasons for the Early Rally
1-Impact of Expectations for Fed Interest Rate Cuts
The Federal Reserve (Fed) launched an interest rate cut cycle in September 2025. The market expects two consecutive rate cuts in October and December, and the anticipated decline in both nominal and real interest rates has increased the appeal of Bitcoin as a non-interest-bearing asset. This attracted inflows of some funds, driving up its price.
2-Support from Sovereign Nations’ Strategic Reserves
The Trump administration established the U.S. Strategic Bitcoin Reserve, incorporating Bitcoin into the national economic asset framework—a move that triggered emulation by many countries. The number of listed companies holding Bitcoin globally has increased significantly, with a total of large Bitcoin holdings. This "digital gold" positioning has significantly boosted Bitcoin’s weight in global asset allocation, pushing its price higher.
3-Impact of Historical Cyclical Patterns
Over the past decade, Bitcoin has achieved an average return rate of over 22% in the month of October. In October this year, the balance of the U.S. Treasury General Account is approaching the $850 billion target, and expectations of funds flowing back into the market have also provided support for Bitcoin’s price.
💎Reasons for the Late Decline
1-Panic Triggered by Trade Policies
On October 10, U.S. President Trump threatened to impose a 100% tariff on Chinese goods, sparking market concerns about an escalation of the global trade war. Investors’ risk appetite declined, and funds flowed out of risky assets such as Bitcoin, leading to a price drop.
2-Substitution Effect of Gold
Gold prices have recently climbed to a record high above $4,300, with a cumulative increase of 18% in the past month. Due to gold’s strong momentum and lower volatility, funds have clearly favored gold more. Some investors shifted from Bitcoin to gold, suppressing Bitcoin’s price.
3-Sell-Off Triggered by Technical Breakdown
Bitcoin fell below the 2025 "realized price" level—a key technical indicator that tracks the average withdrawal price of all wallets. Sustained trading below this level triggered further sell-offs by holders seeking to limit losses. Additionally, after Bitcoin broke below the key support level of $111,000, automated trading systems and stop-loss orders were triggered, intensifying selling pressure.
4-Cascading Margin Calls Driven by High Leverage
Bitcoin’s price decline led to nearly 300,000 margin calls in the cryptocurrency market, with a total liquidation value of $1.221 billion. A large number of leveraged long positions accumulated earlier were forced to close out amid the price drop, forming a vicious cycle of "decline → margin call → further decline" and amplifying downward pressure on the price.

BTC: Today's predictions and operations have been verified👏Today, our predictions for BTC have been verified by the market.
✔1-Judgment on Short-Term Market Nature: After Bitcoin experienced a sudden sharp surge at the opening, we accurately judged that "this surge was a short-term fluctuation lacking sustained support". Subsequently, the price fluctuated downward rapidly and fell back to the oscillating range, which fully validated the judgment that "it was not a trend reversal".
✔2-Trend Direction Prediction: We clearly proposed the downward target level of 103,000. After Bitcoin dropped to just above 103,000 and then rebounded, this fully confirmed our judgment.
🎉Today, we have successfully concluded this week’s trading and work. Next week, we will continue to provide you with more accurate market interpretations and operation references from a professional analytical perspective. Finally, we wish you all a relaxing and pleasant weekend in advance!

BTC: The next downside target looking at 103,000The price of BTC continued to decline today. The previous key support level of 109,500 was broken, and the moving average system was also in a bearish arrangement, exerting pressure on the price.
In terms of technical indicators, according to relevant analysis, Bitcoin's MACD indicator showed a bearish signal. Although the RSI indicator was in a neutral area, the price was lower than both the short - term and long - term moving averages, and the trading volume significantly shrank, indicating insufficient market momentum, an unhealthy price - volume relationship, and weak reversal signs. In addition, from the perspective of the 4 - hour K - line, the MACD histogram remained negative but gradually became shorter, indicating that the strength of the bulls was increasing, but the KDJ indicator had no golden cross or death cross, remaining neutral overall.
In terms of market sentiment, the continuous weakness of Bitcoin made the market sentiment more cautious, and the confidence of the bulls was somewhat damaged.
If Bitcoin cannot regain 110,000 in the short term, the price may continue to fall, and the next target may be around 103,000.
Sell 107000 - 106000
SL 108000
TP 105000 - 104000
Daily-updated accurate signals are at your disposal. If you run into any problems while trading, these signals serve as a reliable reference—don’t hesitate to use them! I truly hope they bring you significant assistance

BTC/USDT: Bullish Bounce to 115,400?BINANCE:BTCUSDT is showing signs of a bullish bounce on the 1-hour chart , where price is approaching a downward trendline with potential support confluence, suggesting a reversal opportunity if buyers defend the key levels. The entry zone aligns near this support area , setting up for an upside move toward higher resistances amid recent volatility.
Entry between 109,500-110,200 for a buy position. Target at 115,400 near the take profit zone, offering a risk-reward ratio greater than 1:4 . Set a stop loss on a close below 109,000 to manage downside risk effectively.
Watch for confirmation with a strong bullish candle and rising volume breaking above the entry, capitalizing on Bitcoin's resilience in the crypto market.
Fundamentally, today we have several speeches from Federal Reserve members, along with the Philadelphia Fed Manufacturing Index and Philly Fed Employment report, which could spark volatility in USD pairs and indirectly impact BTC sentiment. 💡
📝 Trade Plan:
✅ Entry Zone: 109,500 – 110,200 (buy zone near support confluence)
❌ Stop Loss: Close below 109,000
🎯 Target: 115,400 (major resistance zone / take-profit area)
💎 Risk-to-Reward: Greater than 1:4, offering an attractive trade setup.
What's your view on this setup? Drop your thoughts below! 👇

BTC: Full verification of today's trend prediction👏Our prediction for today's BTC trend has been validated by the market, with the core logic highly aligned with the actual price movement. We targeted the risk of support level breakdown, and the downside target was accurately hit:
1 Trend Reversal Judgment
We clearly indicated in our signal that the 110,000 level is a key short-term support for BTC, if this level is breached, the price would fall further. Today, Bitcoin broke below the 110,000 support as expected, verifying our trend judgment that "support levels are prone to breaking under bearish dominance".
2 Downside Target Verification
Regarding the trend after the breakdown, we predicted in advance that the target level would be around 108,000. The actual market movement was in complete consistency with our prediction: after breaking below 110,000, Bitcoin continued to decline and accurately reached the area around 108,000, demonstrating our precise grasp of bearish momentum and key price levels.
💎Our today’s prediction for Bitcoin was based on the core framework of "technical key level breakthrough + trend continuity": it focused on the "bearish inertia following the breach of key support" for Bitcoin, and incorporated the deduction of market sentiment and volume logic. Ultimately, this achieved a high degree of alignment between the prediction and the actual market trend.

BTC: The key lies in the 110,000 supportFrom the 4-hour candlestick chart, since Bitcoin’s periodic high of approximately 126,000, a complete descending trend structure has been formed. Moving averages across all timeframes have created heavy dynamic resistance above the candlesticks, indicating that the market is currently in a phase dominated by bears.
This decline has triggered the spread of panic sentiment in the market, with a large number of investors choosing to take profits at high levels, further increasing selling pressure.
Today, the key focus is on whether the 110,000 support level holds. If this 110,000 support is broken, Bitcoin prices may fall further to 108,000 or even lower, as the market needs more time to digest the current negative sentiment and macroeconomic pressures.
💎
Buy 109000 - 109800 TP 110800 - 111800 SL 108000
Sell 112000 - 111800 TP 111000 - 109000 SL 112500
Daily-updated accurate signals are at your disposal. If you run into any problems while trading, these signals serve as a reliable reference—don’t hesitate to use them! I truly hope they bring you significant assistance

Bitcoin Eyeing $108K ZoneCRYPTOCAP:BTC Daily Chart Analysis
Bitcoin is currently trading around $110,300, showing weakness after failing to hold higher levels. The market structure still looks corrective, and we can see price slowly drifting toward the nearest support zone around $108,000–$109,000.
If this zone holds, we might see a short-term bounce or relief rally. But if the market breaks below $108,000, the next major demand area lies near $104,000–$100,000, where buyers are likely waiting.
For now, the key is to watch how price reacts at this support. A strong bounce could confirm accumulation, while a breakdown might trigger deeper correction before any new bullish leg.
DYOR, NFA

BTC: Waiting for a trading opportunity📝Federal Reserve Chairman Jerome Powell has sent a dovish signal, indicating that the balance sheet reduction may end in the next few months. This has, to a certain extent, alleviated market concerns about the escalation of the China-U.S. trade war and provided a positive boost to the cryptocurrency market.
📝However, U.S. President Trump stated that Washington is considering terminating some of its trade ties with China. Persistent trade tensions have brought a certain degree of uncertainty to the market.
📈Bitcoin has fluctuated within a narrow range today, with no clear trend. We need to wait for a suitable trading opportunity and avoid losses caused by blind trading.

BTC aligns with my forecast📝BTC continued to decline today but encountered support above the $110,000 level and staged a slight rebound. We reminded traders to take profits in a timely manner around the $110,200 mark and urged them not to blindly chase the downward move. We also advised that if the price continued to drop to around $110,000, traders could consider entering small-position long trades, but they must set stop-losses properly.
💎Subsequently, Bitcoin’s trend fully aligned with our forecast—it rebounded and rose from around $110,200. For those traders who just established long positions following our advice, they can now also choose to take profits and avoid blindly chasing the upside to prevent losses.
BTC: The downward momentum is strongBTC has seen significant price volatility today. After hitting a high, it encountered heavy selling pressure, leading to a sharp pullback. From the candlestick chart, Bitcoin’s price and the previous high have together formed a potential "M-top"pattern—a classic bearish reversal signal. The market’s short-term trend has shifted from bullish to bearish, with strong downward momentum. Additionally, the price is trading below all short-term moving averages, further indicating a weak market structure.
In the short term, BTC’s downward trend is clear and market sentiment remains cautious. Short-term investors are advised to stay on the sidelines for now and avoid blindly bottom-fishing. If the price continues to drop to around the 110,000 level, a small-position long entry could be considered, but a stop-loss must be set properly—for example, if the price breaks below 109,000, investors should exit promptly to limit losses.
Despite the significant short-term price fluctuations, Bitcoin’s long-term fundamentals have not undergone any fundamental changes. Weekly and monthly capital flows still show net inflows. Long-term investors can continue to hold their existing positions and do not need to trade frequently due to short-term volatility.
Sell 113000 - 113500 TP 112500 - 112000 SL 113800
Daily-updated accurate signals are at your disposal. If you run into any problems while trading, these signals serve as a reliable reference—don’t hesitate to use them! I truly hope they bring you significant assistance

WHO WRE EXPECTING THAT BITCOIN WILL MOVE UP 118K...?Chart Overview
The chart shows Bitcoin trading between a strong support zone near $108,000–$112,000 and a resistance zone around $122,000–$123,000. After a sharp decline (“Falling Down”), BTC rebounded with a clear “Bullish Back” movement before facing resistance again.
Key Observations
1. Support Zone (108K–112K USD):
BTC has tested this zone multiple times, confirming strong buyer interest.
The recent bounce suggests accumulation pressure is building.
2. Resistance Zone (122K–123K USD):
Price faced rejection from this level previously.
A break and close above this resistance would confirm a bullish continuation pattern.
3. Pattern Formation:
A potential rounded bottom / cup shape appears to be forming, indicating bullish reversal potential.
The “eye” and “arrow” symbol in the chart highlight market observation before a possible breakout attempt.
4. Short-Term Outlook:
Expect sideways consolidation between 112K–118K USD before a possible bullish leg higher.
The next target levels on breakout: 120K, then 122.5K.
Support retest below 112K could delay recovery.
Bullish Scenario
Price holds above 115K and pushes past 118K, signaling momentum for a breakout.
Confirmation above 122.5K could open room toward 125K–128K.

BITCOIN COME BACK TO 125.000 Lets Gooo Hey ,
After A Big Crash In Crypto We Follow Now Our Technical Analysis And Market Structure And We Have A Find A Bullish Bitcoin Setup For Longterm Holding
Buy Reason : QM
Buy Zone : 112.937 to 112.091
Target Old High : BSL
Hope You Gpt The Trade And Understand It

BTCUSDT Forming Bullish MomentumBTCUSDT is currently showing strong signs of accumulation after a healthy market correction. The price action is consolidating above a key demand zone, indicating that buyers are actively defending this level. This structure often suggests the potential formation of a bullish reversal pattern, setting the stage for an upward continuation in the coming sessions. With Bitcoin maintaining solid support around this range, the market looks primed for a rebound that could extend into a 60% to 70%+ gain as sentiment strengthens.
Volume activity remains steady, reflecting consistent interest from both retail and institutional traders. Historically, these accumulation phases often precede powerful bullish rallies, especially when combined with high liquidity and growing demand. If Bitcoin successfully breaks above near-term resistance, the next impulsive wave could drive prices toward key psychological levels, further reinforcing its long-term uptrend.
Investors are closely monitoring BTCUSDT as it continues to build momentum within this crucial zone. A confirmed bullish breakout could trigger renewed buying activity and attract fresh capital inflows, making it one of the most watched setups in the current crypto market.
✅ Show your support by hitting the like button and
✅ Leaving a comment below! (What is You opinion about this Coin)
Your feedback and engagement keep me inspired to share more insightful market analysis with you!
