BTCUSD: Triple Tap at 123K - The Line Between Bulls and BearsPrice has now tested the 123K resistance zone three times. On the third attempt, we saw a shallow breakout, hinting at absorption rather than rejection - a sign that sellers might be running thin((among them, I used to be lol).
Now, all eyes are on the 123K retest - the potential make-or-break pivot. If this level flips to support, bulls could drive toward the next Fib extension at 129,700. But if the level gives way, we’re likely headed back into the 117K–118.5K base zone.
Key Levels
🔴 Resistance Zone: 122,500 – 124,500
🟢 Target: 129,700 (Fib Ext 1.272)
⛔️ Invalidation: Below 122,000
🔵 Base Support: 117,000 – 118,500
📝 Thesis:
Triple tests tend to weaken supply zones. The shallow breakout suggests accumulation rather than exhaustion. Confirmation comes if buyers defend the 123K handle - failure to hold flips momentum back to the downside.
TL;DR:
Triple resistance test → shallow breakout → retest in play.
123K is the pivot. Hold = 129,700. Fail = back to base.
⚠️Risk Note:
Stay alert for fakeouts around macro events. Volume and close structure will tell the real story.
Btcusdtlong

Want to Trade Like a Pro? This BTC Layer Strategy is Your Answer🚀 Become a Pro Trader: The "Thief" Layer Strategy for BTC/USDT (Bullish Swing Plan) 🚀
Unlock a professional money-making operation! This detailed plan combines a unique entry technique with deep fundamental & sentimental analysis to give you an edge.
📈 Trade Idea: BTC/USDT (Swing / Day Trade)
Bias: Bullish | Timeframe: 4H - 1D
🎯 The "Thief" Layer Entry Strategy
This strategy "steals" good entries at various levels instead of chasing the market.
Entry Method: Multiple Buy Limit Orders (Layering)
Proposed Entry Zones: $111,000 | $111,500 | $112,000 | $112,500
You can add more layers based on your capital and risk appetite.
⛔ Stop Loss (Risk Management)
Hard Stop Loss: $110,000 (Below key support)
⚠️ IMPORTANT NOTE (Thief OG's): This is MY stop loss. You MUST adjust your SL based on your personal risk management strategy. Protect your capital first.
🎯 Take Profit (Exit Strategy)
Primary Target: $116,000 (Strong Resistance + Overbought Zone)
The Plan: Escape with "stolen" profits before any potential trap snaps shut!
⚠️ IMPORTANT NOTE (Thief OG's): This is MY target. You are free to take profit earlier or adjust based on your own analysis. Secure your bags!
🔍 Why This Plan? The "Thief's" Analysis
This trade setup is backed by a confluence of technical, fundamental, and sentimental factors.
📊 Technical & Sentimental Backdrop (As of Sept 9, 2025)
Price Action: BTC showed strength with a +1.52% gain, bouncing from the $111,184 support.
Market Sentiment (Fear & Greed Index): 48/100 (Neutral) 😐. This indicates a balanced market with no extreme fear or greed—often a good base for a move.
Retail vs. Institutional:
Retail Traders: 55% Long (Slightly Bullish) 🤔. Fueled by Fed rate cut expectations.
Institutional Traders: 60% Short (Cautiously Bearish) 🏢. Their selling pressure appears to be exhausting, as shown by declining volume on dips. This creates a contrarian opportunity.
🌍 Fundamental & Macro Tailwinds
The $7.26T Cash Pile: Money market funds are holding a massive $7.26 Trillion. A Fed rate cut could unleash this capital into risk assets like Bitcoin. 🏦
Fed Rate Decision: An expected 25-50 bps cut is highly bullish for crypto, potentially triggering a major rotation.
Strong Bitcoin Fundamentals:
Low Inflation Rate: Only 1.17% (low new supply pressure). ✅
Network Health: Active addresses and settlement volume remain stable (~$12.9B/24h).
Dominance: BTC is outperforming traditional safe havens like gold (+102% YoY vs. gold's +42%).
✅ Overall Outlook Score
Bull (Long) Score: 55/100 → Neutral-Bullish 🐂
Bear (Short) Score: 45/100 → Weak Bearish Pressure 📉
🎯 Final Thief's Outlook: Cautiously optimistic. The layered entry strategy allows us to capitalize on potential upside driven by macro factors while strategically managing risk.
👀 Related Pairs to Watch
BINANCE:ETHUSDT | BINANCE:SOLUSDT | BINANCE:BNBUSDT (Altcoins follow BTC's lead)
TVC:DXY (U.S. Dollar Index) | CBOE:SPX (S&P 500)
✨ “If you find value in my analysis, a 👍 and 🚀 boost is much appreciated — it helps me share more setups with the community!”
#BTC #Bitcoin #Trading #Strategy #LayerStrategy #SwingTrading #Cryptocurrency #TechnicalAnalysis #FundamentalAnalysis #ThiefStrategy

BTC/USD – Flag Formation Near Trendline Support Breakout SeemsBitcoin is respecting its bullish market structure, continuing to form higher highs and higher lows. After the impulsive rally toward 125,600, price has entered a short consolidation phase and is currently testing a rising trendline acting as dynamic support.
This structure resembles a bullish flag / ascending triangle, suggesting that buyers may soon regain control if price holds above the trendline.
🔹 Market Outlook
• Structure: Bullish continuation
• Pattern: Bullish flag / triangle formation
• Bias: Buy on confirmation above resistance or from trendline support
💎 Trade Plan
Option 1 – Immediate Buy (Aggressive)
🟢 Buy Now: 122,900 – 123,000
🎯 Target 1: 123,800
🎯 Target 2: 125,500 (resistance high)
🛑 Stop-Loss: below 122,400
Option 2 – Pending Buy (Conservative)
🟢 Buy Stop: 123,600 (breakout above flag)
🎯 Target 1: 124,600
🎯 Target 2: 125,500 – 126,000
🛑 Stop-Loss: below 122,800
⚠️ Alternative Scenario
If the trendline breaks and price closes below 122,400, expect a short-term shift toward 121,800–121,200, where fresh demand could appear for the next leg higher.
📈 Summary
• Trendline support still intact ✅
• Bullish flag structure forming ✅
• Confirmation needed above 123,600 for momentum continuation 🚀
• Maintain bullish bias while price holds above 122,400

#BTC/USDT Analysis: Key Level to Watch#BTC
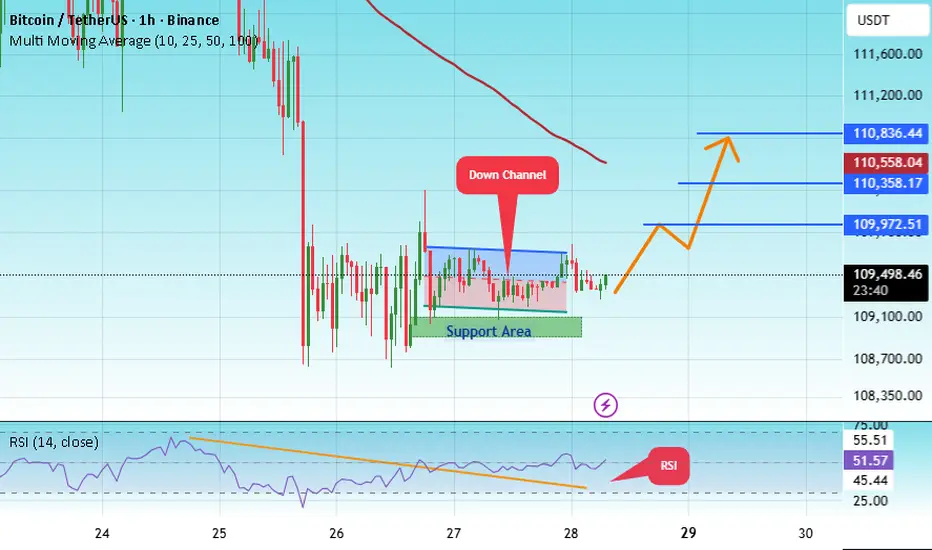
The price is moving within a descending channel on the 1-hour frame, adhering well to it, and is heading for a strong breakout and retest.
We have a bearish trend on the RSI indicator that is about to be broken and retested, which supports the upward breakout.
There is a major support area in green at 109100, representing a strong support point.
We are heading for consolidation above the 100 moving average.
Entry price: 109470.
First target: 109900.
Second target: 110360.
Third target: 110836.
Don't forget a simple matter: capital management.
When you reach the first target, save some money and then change your stop-loss order to an entry order.
For inquiries, please leave a comment.
Thank you.
BTC/USDT: Bullish Surge to 136K?BINANCE:BTCUSDT is gearing up for a bullish move on the daily chart , with an entry either from the current level or a pullback to the specified trendline .
The target at 136000 aligns with the next major resistance, signaling strong upside potential. Set a stop loss on a daily close below 108500 to manage risk effectively.
A break above 118000 with solid volume could trigger this surge, driven by market sentiment and BTC dominance. Watch key news! 💡
📝 Trade Plan:
✅ Entry: From current price or on a pullback to the trendline
❌ Stop Loss: Daily close below 108,500 to manage risk
🎯 Target: 136,000 (next major resistance)
Ready for this lift-off? Drop your take below! 👇

$BTCUSDT Long Limit SetupCRYPTOCAP:BTC is taking short term pull back here.
Confluences:
Broke out from the current lower-lower structure.
Shifted 4hr+1D Structure to Bullish
Getting a pull back to 1D-4H OB.
Keep limits open or stay updated with me.
Follow for more <3

BTC/USDT — Bull Flag Formation: Continuation Rally or Breakdown?📝 Full Analysis
Bitcoin is currently forming a classic Bull Flag pattern. This setup appears after a strong impulsive rally (flagpole), followed by a corrective consolidation within a descending channel (the flag). Technically, a bull flag often indicates a bullish continuation, suggesting the market is taking a breather before resuming its upward trend.
🔍 Bull Flag Characteristics on the Chart
Flagpole: The sharp rally that pushed BTC up to 124,474.
Flag: A descending parallel channel where price consolidates with lower volatility and reduced volume.
Key Support (~109k): This level acts as the foundation of the flag. As long as BTC holds above it, the bull flag remains valid.
---
📈 Bullish Scenario (Bull Flag Confirmation)
Price holds above 109k and bounces higher.
A valid breakout above the upper flag trendline with a strong 2D candle close and higher volume would confirm the bull flag.
Upside targets:
Immediate Resistance: 117k → 120k.
Retest of Previous High: 124.4k.
Theoretical Bull Flag Target: potentially extending toward 130k+ in the mid-term.
---
📉 Bearish Scenario (Invalidation of Bull Flag)
If BTC fails to sustain above 109k, the bull flag risks invalidation.
A breakdown of this key level could drag price back to 103k, with extended downside risk toward 74.5k if selling pressure intensifies.
In this case, the flag turns into a failed continuation setup, shifting market sentiment bearish.
---
⚖️ Conclusion
The chart currently reflects a textbook Bull Flag: impulsive rally → corrective descending channel.
As long as 109k holds, the bullish continuation bias remains intact.
A breakdown below 109k, however, opens the door to a deeper correction.
---
📌 Trading Outlook (Not Financial Advice)
Bullish Plan: Enter on a confirmed breakout above the flag with strong volume. Targets: 117k → 120k → 124k+.
Bearish Plan: If breakdown occurs below 109k, short-term target ~103k, extended target ~74.5k.
---
#Bitcoin #BTC #BTCUSDT #BullFlag #Crypto #TechnicalAnalysis #ChartPattern #BullishContinuation #Breakout

BTCUSDT H4 OUTLOOK Lets Goo
We Are Considering Buy Btcusdt Setup On Demand Zone
Liquidity Sweep
Demand Zone
High Probability Setup
Good Luck Guys

With support at 110,000-111,000, we remain bullishAnother successful long entry 🚀! As we have repeatedly stated before, as long as BTC does not break below the 110000–111000 support range 🛡️, we will still maintain a bullish outlook 🐂
Buy @111000 - 111500
TP 113000 - 113500 -114000
Accurate signals are updated every day 📈 If you encounter any problems during trading, these signals can serve as your reliable guide 🧭 Feel free to refer to them! I sincerely hope they'll be of great help to you 🌟 👇

BTC/USDT: Bullish Leap to 122K? As the previous analysis worked exactly as predicted, BINANCE:BTCUSDT is gearing up for a bullish move on the 4-hour chart , with an entry zone between 111750-113000 near a key support and rising trendline. 🎯
The target range at 122000 aligns with the next major resistance, signaling strong upside potential. Set a stop loss on a daily close below 110000 to manage risk effectively.
Attention: The price may not hit the red box and could move upward with momentum after touching the ascending trendline. Exercise caution in managing your capital.
📝 Trade Plan:
✅ Entry Zone: 111,750 – 113,000 (support + trendline area)
❌ Stop Loss: Daily close below 110,000 to manage risk
🎯 Target: 122,000 (next major resistance)
💡 Ready for this surge? Drop your take below! 👇

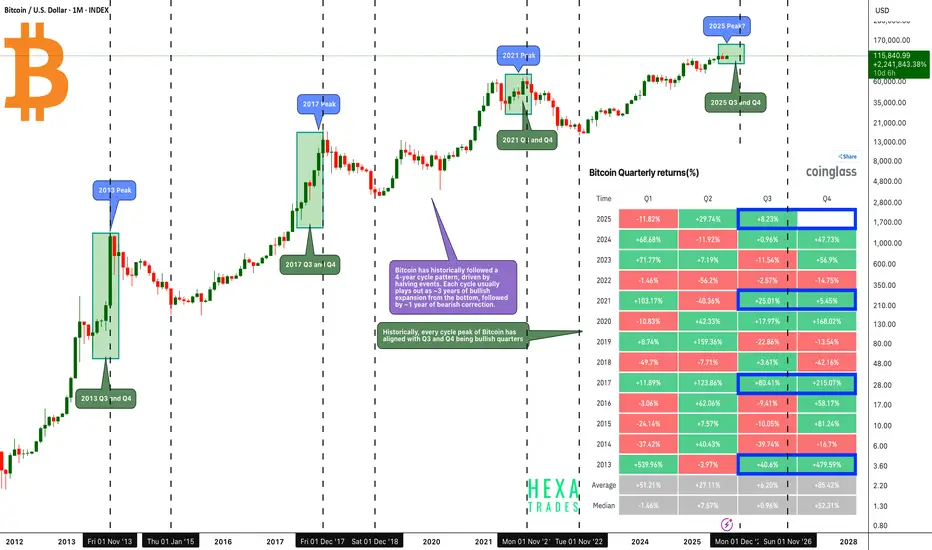
Bitcoin - Final Pump Before the Crash?Bitcoin has historically followed a 4-year cycle pattern, driven by halving events. Each cycle usually plays out as ~3 years of bullish expansion from the bottom, followed by ~1 year of bearish correction.
Historically, every cycle peak of Bitcoin has aligned with Q3 and Q4 being bullish quarters, making the second half of the year the most critical period for cycle tops.
Key Observations from Previous Cycle Peaks:
🔶 2013 Peak:
- Q3: +40.6%
- Q4: +479.59%
Strong acceleration into year-end marked the cycle top.
🔶 2017 Peak:
- Q3: +80.41%
- Q4: +215.07%
A similar explosive move as Bitcoin entered the mania phase.
🔶 2021 Peak:
- Q3: +25.01%
- Q4: +5.45% .
🔶 Current Cycle (2025 Peak?):
- Q3 2025 is already up +8.23% with 15 days remaining until the quarter ends.
- If history repeats, Q4 could be the blow-off phase where Bitcoin accelerates sharply to its peak.
🔶 Potential 2025 Target:
Bitcoin’s Q4 2025 peak could realistically reach the $140K–$160K range before entering the next corrective phase.
Conclusion: If Bitcoin follows its established 4-year cycle structure, we could be entering the final bullish leg of this cycle. History suggests Q3 and Q4 have the highest probability of producing outsized gains, with Q4 especially aligning with cycle peaks.
Cheers
Hexa
BINANCE:BTCUSDT CRYPTOCAP:BTC BITSTAMP:BTCUSD BINANCE:BTCUSDC
BTC: $115K Support Zone Under PressureBitcoin is currently testing the $115K support zone, and it's showing signs of breaking through. If this level doesn't hold, we could see a drop toward the next support around $110K-$112K. On the flip side, if CRYPTOCAP:BTC bounces back, it might target the $120K resistance zone.
Set a market alert for a break below $115K to track any major moves.
DYOR, NFA

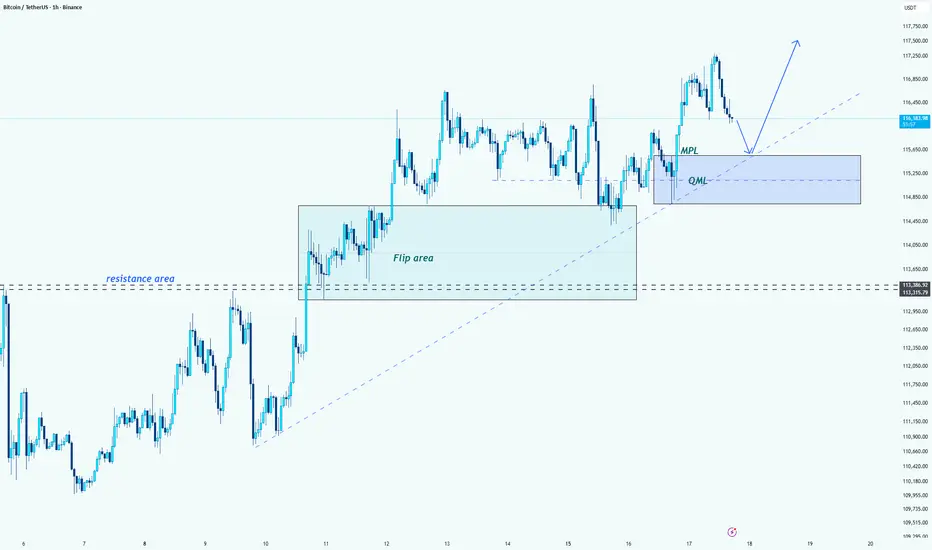
Bitcoin (BTC/USDT) -> MPL and QML AnalysisHello guys!
Let's analyze btc!
⚡ Trading Strategy
MPL Level: 115,000 should be tested before the price rises, so wait for confirmation here before entering long positions.
Target: The next major target for the uptrend is around 117,500.
--------------------
📈 Outlook
Bullish: If price holds above the QML, the bullish trend could continue towards 117,500.
Watch for Retest: Keep an eye on 115,000 for a possible retest before further upside.
#BTC/USDT Breaks Resistance: Eyes on 117436 K#BTC
The price is moving within a descending channel on the 1-hour frame, adhering well to it, and is heading for a strong breakout and retest.
We have a bearish trend on the RSI indicator that is about to be broken and retested, which supports the upward move.
There is a major support area in green at 114400, which represents a strong support point.
For inquiries, please leave a comment.
We are in a consolidation trend above the 100 Moving Average.
Entry price: 114715
First target: 115650
Second target: 116518
Third target: 117436
Don't forget a simple matter: capital management.
When you reach the first target, save some money and then change your stop-loss order to an entry order.
For inquiries, please leave a comment.
Thank you.

BTC Eyes 120K but 115K Support is the Last LineCRYPTOCAP:BTC is currently trading around 116K after a strong run-up. The chart shows a rising wedge pattern forming, with immediate support sitting near 115K. If this level holds, BTC could make another push toward the upper resistance zone around 120K.
On the flip side, a breakdown below 115K may trigger a short-term correction, sending price lower before bulls step back in.
Overall, BTC is in a critical zone, holding support keeps the bullish momentum alive, but a rejection at resistance could slow things down.
DYOR, NFA
Stay tuned for more update

#BTC/USDT options market is bullish.#BTC
The price is moving within a descending channel on the 1-hour frame and is expected to break and continue upward.
We have a trend to stabilize above the 100 moving average once again.
We have a downtrend on the RSI indicator that supports the upward break.
We have a support area at the lower boundary of the channel at 114650, acting as strong support from which the price can rebound.
We have a major support area in green that pushed the price upward at 114400.
Entry price: 115152.
First target: 115476.
Second target: 115990.
Third target: 116633.
To manage risk, don't forget stop loss and capital management.
When you reach the first target, save some profits and then change your stop order to an entry order.
For inquiries, please comment.
Thank you.

BTC/USDT: Bitcoin Surge to 118K?🚀 BINANCE:BTCUSDT is shaping up for a bullish move on the 4-hour chart , with an entry zone between 109000-110000 near a key support and rising trendline.
🎯 First target at 113500 marks initial resistance, second at 114500 , and a third at 118000 could signal a major breakout! 📈 Set a stop loss on a 4hours close below 107240 to manage risk.
🌟 A break above 110500 with strong volume could trigger this rally, driven by market sentiment and whale activity. Watch BTC dominance! 💡 Ready for this lift-off? Drop your take below! 👇
📝 Trade Plan:
✅ Entry Zone: 109,000 – 110,000 (support)
❌ Stop Loss: close below 107,240 to manage risk
🎯 Target 1: 113,500 (first resistance)
🎯 Target 2: 114,500 (secondary resistance)
🎯 Target 3: 118,000 (final target)

BTC – Bullish Head & Shoulders Pattern!Bitcoin is currently showing signs of a bullish inverse head & shoulders pattern on the 4H chart. This setup is typically a reversal signal, suggesting potential upside if the neckline resistance is broken.
Key Highlights:
- Left Shoulder, Head, Right Shoulder formation is clearly visible.
- Neckline Resistance: Around $113,500 – a breakout above this level could confirm the pattern.
- Potential Upside: If confirmed, BTC could see a strong move toward higher resistance zones.
- Volume Watch: A breakout backed by strong volume would add conviction.
Cheers
Hexa
CRYPTOCAP:BTC BITSTAMP:BTCUSD BINANCE:BTCUSDT

$100K Remains the Critical Psychological Level for BTCCRYPTOCAP:BTC just broke below a key trendline, showing weakness in momentum. The zone that once acted as support has now flipped into resistance, which explains why price is struggling to push higher.
At the same time, there’s a strong demand zone and a big psychological level sitting around $100K. If price pulls back deeper, that’s where buyers are most likely to step in aggressively.
Right now, BTC is consolidating inside a small upward channel. A breakout from this channel will decide the next move, either reclaiming resistance or retesting that $100K demand area.
DYOR, NFA
Stay tuned for more updates

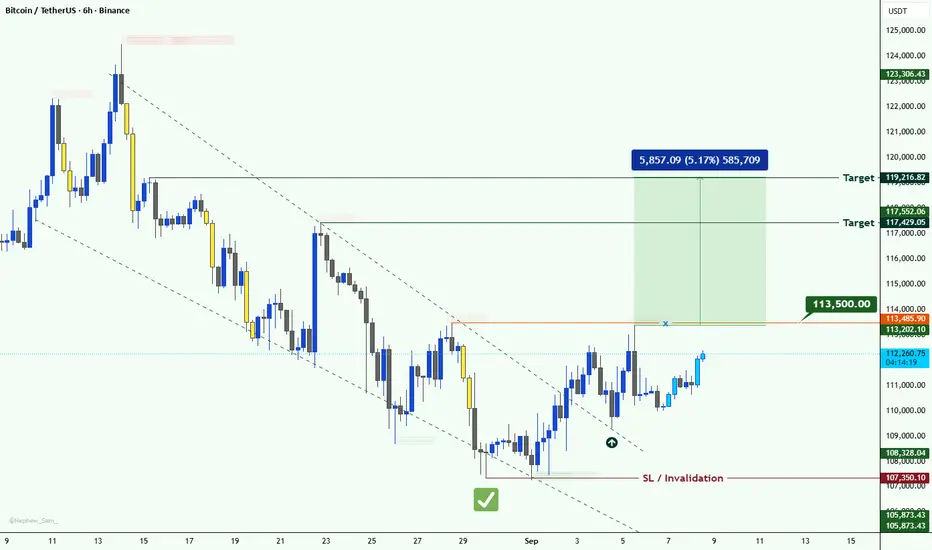
BTC Falling Wedge Breakout – Key Confirmation at 113.5K📊 #BTCUSDT Update
— #BTC cleared the liquidity around 107K and bounced back. ✅
— Currently, the price has formed a Falling Wedge and already broken it. Still, we need extra confirmation.
— If BTC breaks 113.5K with a strong bullish candle, we can expect higher levels as the next targets. 📈
#BTC/USDT Bullish Divergence on 1H, Low Risk Trade#BTC
The price is moving within a descending channel on the 1-hour frame, adhering well to it, and is poised to break it strongly upwards and retest it.
We have a bearish trend on the RSI indicator that is about to be broken and retested, supporting the upside.
There is a major support area in green at 108062, which represents a strong basis for the upside.
For inquiries, please leave a comment.
We are in a consolidation trend above the 100 Moving Average.
Entry price: 108450
First target: 108959
Second target: 109541
Third target: 110325
Don't forget a simple matter: capital management.
When you reach the first target, save some money and then change your stop-loss order to an entry order.
For inquiries, please leave a comment.
Thank you.

Bitcoin (BTC/USDT) Trade Setup🚀 BINANCE:BTCUSDT Trade Setup 🚀
📉 After a sustained downtrend inside a parallel channel, BTC has finally broken out with bullish momentum. Currently, price is hovering around the 111K zone.
🔑 Key Levels:
Support: Channel retest zone (110K – 109.5K)
Resistance: 113K – 114K
Next Major Target: 116K – 118K 🎯
⚡ Trading Plan:
If BTC successfully retests the channel breakout and flips the resistance into support ✅, we could see a massive upside move (potential Elliott Wave structure forming 🔄).
🔥 Confirmation of strength will come once BTC breaks & sustains above 113K with volume.
This could trigger a huge pump towards Wave 3 & Wave 5 targets 🚀💎
🛡️ Risk Management: Place SL below 109K support to protect against false breakouts.
📈 Summary:
BTC breakout + possible retest = high probability bullish setup 📉➡️📈.
Keep an eye on volume and channel validation before entering.

POL/USDT Trade Idea💎 BINANCE:POLUSDT Trade Idea 💎
📊 Pattern spotted: Double Bottom ✅
This setup indicates strong support around 0.2800 and signals a possible bullish reversal.
⚡ Entry (Advanced): 0.2860 – 0.2870
🎯 Target (TP): 0.2960
🛡️ Stop Loss (SL): 0.2800
✨ Risk/Reward: Low Risk – High Profit 🚀
This is an advanced entry with tight SL and strong upside potential.
📈 If the neckline breaks and sustains above, we can expect a bullish move towards the target.
🔑 Summary: Double Bottom gives confidence of reversal 📉➡️📈. Perfect setup for traders who like low loss & high reward opportunities.
