Btcusdtlong
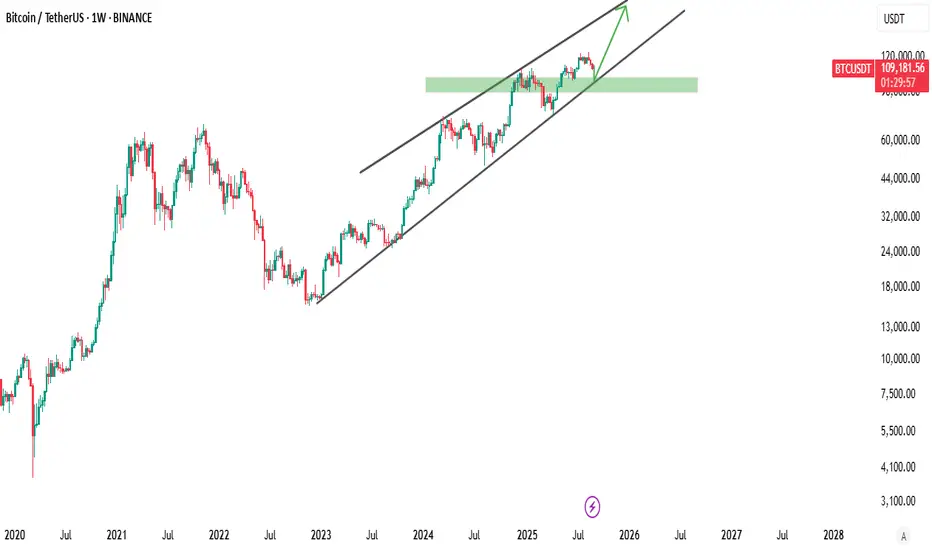
Bitcoin (BTCUSDT) Weekly Outlook – Still in the Uptrend ChannelHello Traders! 👋
Bitcoin is currently trading around $109,200, showing a slight pullback after its strong bullish rally. On the weekly chart, BTC continues to respect the ascending channel, and the green support zone is acting as a key demand area.
🔑 Key Levels & Structure
Support Zone (Buyers’ Area): $105,000 – $110,000
Channel Support: Lower black trendline (dynamic support)
Upside Target: $120,000+ if the channel holds
Invalidation: A weekly close below $105,000 may shift momentum bearish
📊 Market Insight
Bitcoin is consolidating near the middle of the channel after hitting resistance at the upper band.
If buyers defend the green demand zone, BTC could rebound strongly toward the upper channel line, potentially breaking $120K in the coming weeks.
On the other hand, if price breaks below $105K, we could see a correction toward the $95K – $100K area before bulls re-enter.
📈 Strategy Idea
Bullish Bias: Look for long setups if BTC shows bullish reversal candles near $105K – $110K.
Target: $120K – $125K (upper channel).
Risk Management: Keep stops below $105K for safer entries.
🔥 Bitcoin’s long-term uptrend remains intact, but short-term volatility will test trader patience.
💬 What’s your BTC target before the next halving? Do you see $120K soon or a deeper correction first?
Drop your thoughts in the comments ⬇️, and don’t forget to hit 👍 if you found this analysis useful!
Bitcoin (BTC/USDT) – 4H Chart Update !!Bitcoin (BTC/USDT) – 4H Chart Update
BTC is trading near $110,000 and respecting a descending trendline. The price is currently consolidating near support with RSI around 40, showing slight weakness.
Immediate Support → $109,456
Long-term Support → $98,376
Immediate Resistance → $112,935
Long-term Resistance → $122,879
Possible Scenarios:
Bullish Case (Long Setup):
A breakout above $112,935 could open doors to $116,818 → $120,001 → $122,879.
Long entry valid above breakout confirmation, SL below $109,456.
Bearish Case (Short Setup):
Failure to hold $109,456 could drag price down to $105,189 → $102,154 → $98,376.
Short entry valid below $109,456, SL above $112,935.
The market is at a critical decision zone – waiting for a breakout/rejection will give clearer direction.
DYOR | Not Financial Advice

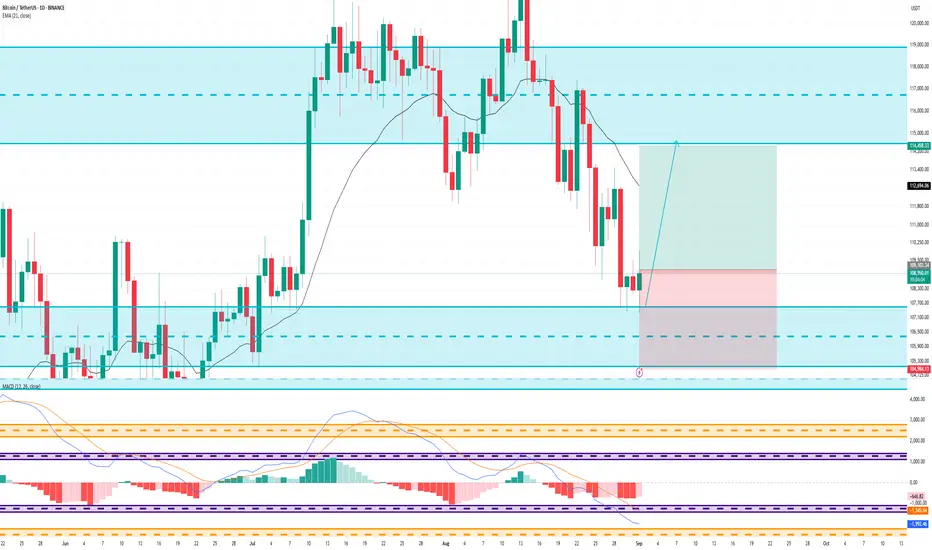
Bitcoin Finds Support Around $110K After CorrectionMarket Dynamics
The price is trading around $112,950, with a daily growth of ≈ 1.17%, the maximum mark is $113,419, the minimum is $110,924.
The overall market sentiment is bullish:
Bitcoin found support around $110K after a correction from the historical maximum ($124K), which is facilitated by the expectation of easing the Fed's interest rate policy.
Analysts note important support at the level of $109K - a break below could trigger a short-term correction.
Investment flow remains positive: in August alone, $260 million inflow was recorded into the Bitcoin ETF; the presidential decree increases institutional interest in the asset.
Support and Resistance Levels
Level Value / Comment
Support $110K–$109K — critical zone to maintain bullish balance
Resistance $113K–$114K (current area), then $120K–$124K (breakout will open the way to growth)

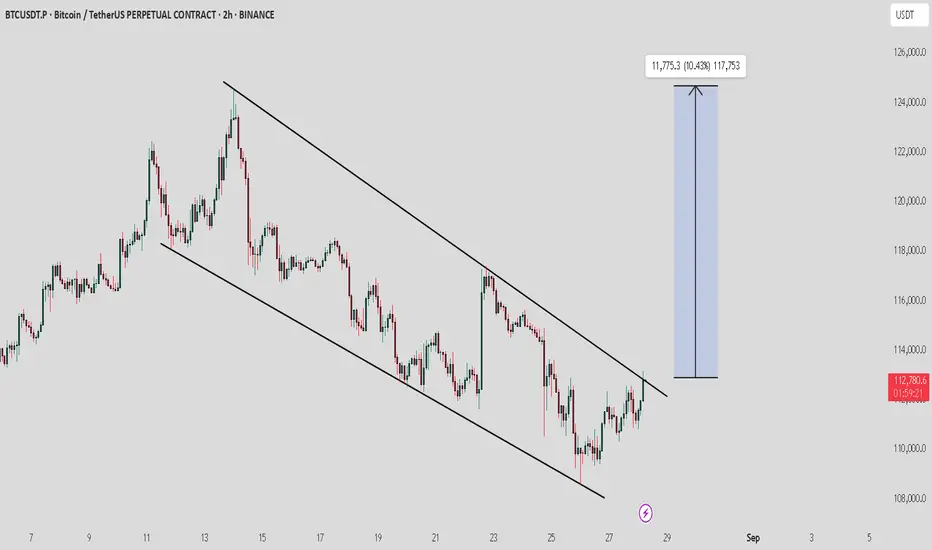
BTC / USDT : Trying to breakout from descending channelBTC/USDT is breaking out of the descending channel on the 2H timeframe. If this breakout holds, we could see a bullish rally of around +10%, targeting the $124,000 zone.
Trade Setup:
Entry: After breakout confirmation / retest hold above $113,000
Targets: $118,000 – $124,000
Stop-Loss: Below $111,000 (channel support invalidation)
As always, wait for confirmation to avoid fake breakouts and manage risk properly.
Altcoin Pioneers Group TRADING | Bitcoin Daily Analysis Day1BINANCE:BTCUSDT
Altcoin Pioneers Group TRADING ™ | Bitcoin Daily Analysis Day1
👋 Welcome to Altcoin Pioneers Group TRADING ™!
Let’s analyze Bitcoin. Let’s explore the reason behind it and what Bitcoin’s next move might be.
The price appears to follow a descending triangle pattern 🔻, with two notable bottoms (Bottom 1 ⬇️ and Bottom 2 ⬇️) marked on the chart.
The price has declined 📉 from a higher level, forming a resistance line 🚧 (the upper boundary of the triangle) and a support line 🛡️ (the lower boundary) around 114,000 USDT.
A target price 🎯 of approximately 118,000 USDT is indicated, suggesting a potential breakout 🚀 above the resistance.
The current price is around 112,513.38 USDT 💰, with recent fluctuations 📊 showing a slight recovery ⬆️ after hitting Bottom 2.

BE CAREFUL !! 2026 SELL ALL @EVERYONE !!!Analysis of Bitcoin using the Elliott 5-wave decline model shows that the market is likely in the transition from wave (iv) to the final wave (v). Once wave (v) is completed, the price may rebound with a major corrective phase (ABC) back toward the upper channel. Fibonacci levels, RSI, and the price channel all support this scenario.

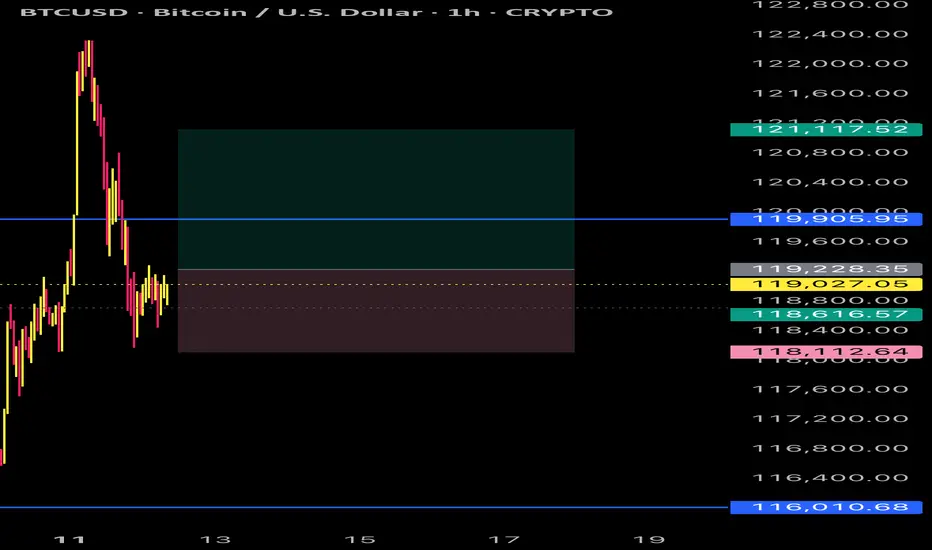
BTCUSDT: Price Action Trade Bitcoin 121K!Hello friends, based on the price action levels and this phase change from a bearish mode and back to a broken level, Bitcoin is expected to reach the level of 121,000.

#BTC/USDT Bitcoin & STRONG SUPPORT#BTC
The price is moving within an ascending channel on the 1-hour frame, adhering well to it, and is on track to break it strongly upwards and retest it.
We have support from the lower boundary of the ascending channel, at 114600.
We have a downtrend on the RSI indicator that is about to break and retest, supporting the upside.
There is a major support area in green at 114866, which represents a strong basis for the upside.
Don't forget a simple thing: ease and capital.
When you reach the first target, save some money and then change your stop-loss order to an entry order.
For inquiries, please leave a comment.
We have a trend to hold above the 100 Moving Average.
Entry price: 115361.
First target: 116202.
Second target: 117481.
Third target: 119106.
Don't forget a simple thing: ease and capital.
When you reach the first target, save some money and then change your stop-loss order to an entry order.
For inquiries, please leave a comment.
Thank you.

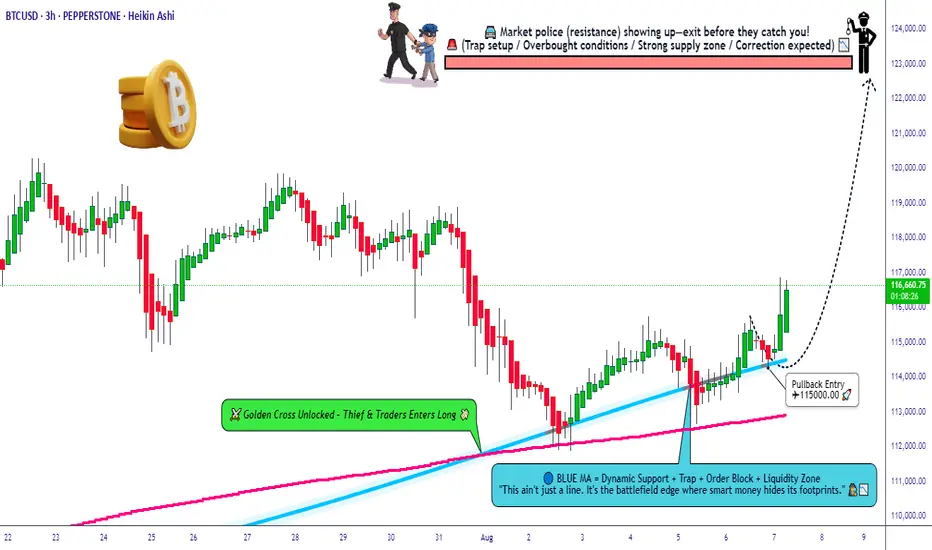
Can the Thief Rob BTC Pullback Before the Police Arrive?🚨 BTC/USD 💰 Bitcoin Breakout Heist Plan – Robbers in Action 🚀 🚨
Asset: BTC/USD “Bitcoin vs U.S. Dollar” — Crypto King Market
📊 Plan: BULLISH BREAKOUT RAID
🎯 Target: 123,000.00 🎯 — Police Barricade Resistance + Overbought Trap Zone
🔒 Entry: ANY PRICE LEVEL — Thief avg pullback entry at 115,000.00
🛑 Stop Loss: 113,000.00 — Below the Laser Tripwire
🎩 Thief Entry Blueprint 🕵️♂️
The vault’s trembling. The thief’s not waiting.
Layered limit orders are being deployed like smoke bombs — we strike anywhere, anytime, with stealthy precision. No begging for dip, we rob it raw. 💣🧨
📉 Risk Protocol Setup 🛡️
SL: Under local support – cut fast if alarms trigger.
Risk light, rob heavy. Use tight stops or trailing guards to escape with the loot.
📈 Why Rob Long?
Bullish momentum building like a pressure cooker 💥
Resistance zones turning into trapdoors for late bears 🐻
Liquidity pools above — ripe for raid
Sentiment flips, on-chain signals, and macro tailwinds align ⚡
📌 Robbery Reminders:
NO SHORTING — This is a one-way heist 🚷
Avoid news-time chaos ⛔
Use multiple entries (layer style) and escape plans.
Overbought ≠ exit — it’s the bait for the next raid 🧠
💖 LIKE = SUPPORT THE CREW
Every like boosts the Thief Trader movement — more heat, more setups, more wins.
Smash Boost. Share the Heist. Stay Robbing. 🐱👤📈🔥
🔔 Stay tuned. Next breakout blueprint dropping soon.
BTCUSD SCALP TRADEBitcoin will be scalping it carefully and as quick as possible and will just wait for a turn over to the upper side
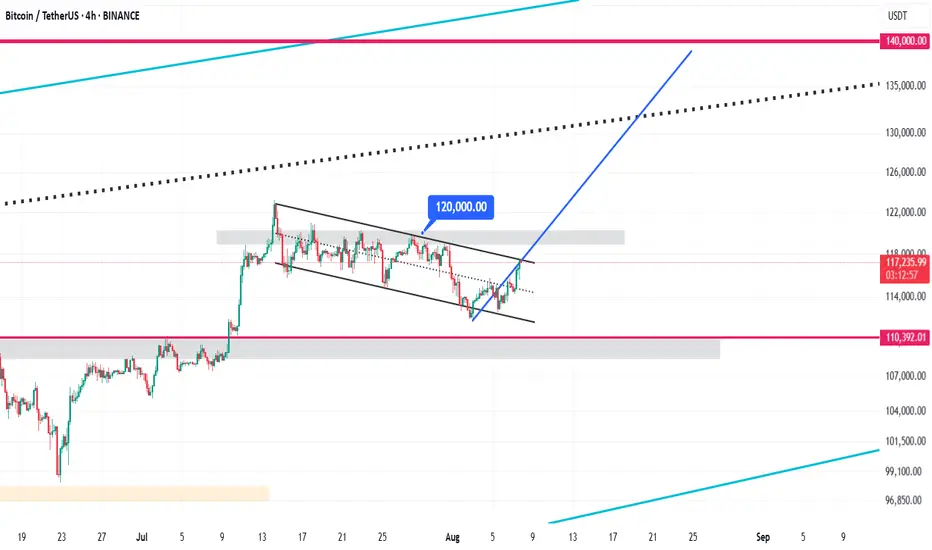
Bitcoin Bullish Flag Pattern Analysis & $140,000 Target🚩 Bullish Flag Pattern Formation
Bitcoin is currently forming a bullish flag pattern on the 4-hour chart. This pattern typically appears after a sharp upward move and represents a short-term consolidation within a descending channel. It usually signals a continuation of the strong bullish trend. Currently, the price is oscillating between the upper and lower boundaries of this channel, poised for a potential breakout.
⏳ Duration of the Correction Phase
The correction inside this channel has lasted from July 14 to August 8, 2025, spanning approximately 25 days. This relatively long consolidation period indicates a deep stabilization phase, allowing the market to gather momentum for the next upward wave. During this time, Bitcoin traded in a tight range between the channel’s support and resistance levels.
⚠️ Critical Resistance at $120,000
The key resistance level to watch is $120,000. If Bitcoin can break this level decisively with strong volume and confirming candles, the bullish flag pattern will be validated, signaling a continuation of the upward trend. This breakout point is considered an optimal entry for new long positions.
🎯 Price Target at $140,000
The target price derived from the bullish flag pattern, calculated by measuring the flagpole and projecting it from the breakout point, is around $140,000. This represents approximately a 20% gain from the breakout and may serve as a significant psychological resistance level.
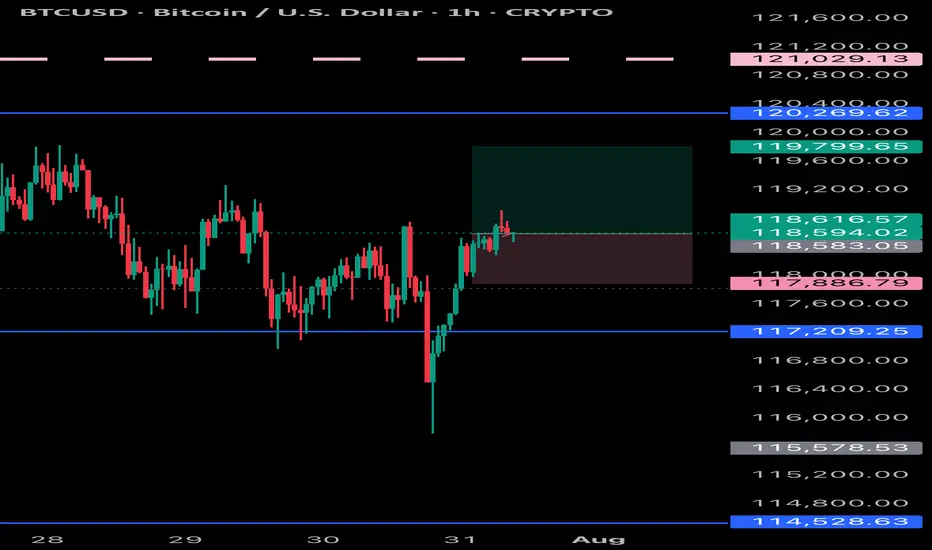
Bitcoin Traps Bulls and Bears – Real Move Next?Bitcoin is trading in a descending channel on the 4H chart, with two recent fakeouts — one above resistance and one below support — trapping traders on both sides. After reclaiming support, BTC is pushing toward the upper boundary with rising volume, hinting at strong demand. A breakout above $119K could drive a rally toward $125K–$135K.
Cheers
Hexa
BINANCE:BTCUSDT BITSTAMP:BTCUSD

BTC Riding the Trend — $120K Target on RadarBitcoin is riding a rising support zone, showing steady bullish momentum despite recent pullbacks.
We’ve seen a key resistance level flip into support, and price is now holding firmly above it. As long as CRYPTOCAP:BTC respects this trendline, bulls have a strong chance to push higher.
The immediate test is the downtrend resistance — a clean breakout here could open the path toward the $120K–$122K zone.
If rejected, price may retest the rising support before making its next move.
DYOR, NFA
Thanks for the reading

BTC - Key insight you must pay Attention to!📊 This is a weekly Bitcoin chart with a key insight you should pay close attention to:
In a bullish trend, you’ll always notice higher highs being formed. Once price breaks the previous high, it's typically a strong confirmation of bullish continuation, as shown by the BOS (Break of Structure) levels marked in blue on the chart.
🔻 The BOS level must not be broken to the downside — if that happens, it signals a trend reversal from bullish to bearish, just like what occurred at the red zone I highlighted.
✅ Currently, Bitcoin has broken its previous high to the upside, which indicates the bullish trend is continuing.
🎯 Next target: $150K.
⚠️ However, if BTC pulls back for a retest and fails to bounce quickly, it will be considered a strong sell signal. That would likely lead to a correction back down toward the $80K zone.
Best regards:
Ceciliones🎯

"Bitcoin’s Big Heist – Are You In or Out?"🚨 BTC/USDT HEIST MISSION – SWIPE THE BULL RUN BEFORE THE BEARS WAKE UP 💰💣
🌟Hi! Hola! Ola! Bonjour! Hallo! Marhaba!🌟
Money Makers & Robbers, assemble! 🤑💰✈️💸
Here’s your decoded BTC/USDT “Bitcoin vs Tether” Crypto Market Heist Plan, fully loaded with Thief Trading Style 🔥 TA + FA combo. We’re prepping for a bullish breakout loot – eyes on the vault, ignore the noise.
🎯 PLAN OF ATTACK:
🎯 ENTRY (BUY ZONE):
💥 “The vault’s open—time to sweep!”
DCA/Layer your buy limit orders near the 15–30 min swing lows/highs for sniper pullback entries.
Use multi-entry method to stack positions (layering / DCA) as per your ammo (capital 💵).
🛑 STOP LOSS:
Set SL at the nearest swing low wick (4H TF) — around 115000.00, adjust based on your risk/load.
SL = insurance. Not optional.
🏁 TARGET:
Lock sights on 125000.00
🎉 Or… vanish with profits before the bear cops arrive.
🔎 MARKET BACKDROP & ANALYSIS:
📈 BTC/USDT currently signals bullish vibes on the swing/day horizon — fueled by:
Macro Fuel & Fundamentals
Sentiment Radar
COT Reports
On-Chain Pulse
Intermarket Clues
🚀 Connect the dots. The smart money's already prepping a breakout move.
🧲 Scalpers Note:
Stick to the long side only. No shorting the beast — unless you’re made of diamonds.
Secure your bag with trailing SLs.
⚠️ NEWS TRIGGER ZONE – TRADE WITH TACT:
📢 Upcoming high-volatility news events can spike charts.
Avoid new entries during releases and guard open trades with trailing SLs.
Protect the loot. Always.
💖 SUPPORT THE HEIST GANG: BOOST IT!
Smash that ❤️ to boost our thief squad’s momentum!
Every click powers this underground mission – making money with style, one pip at a time. 🎯💣💵
🚀 See you in the next heist drop.
Until then – Stay stealthy. Stay profitable. Stay legendary. 🐱👤💸🏆

Don’t Panic Yet… BTC Might Just Be ReloadingBitcoin is doing something it’s done before.
Every time CRYPTOCAP:BTC has pulled back into this key rising zone, it’s bounced back stronger. The last few dips got absorbed right at this level, and we’re seeing the same setup again now.
Price recently flipped a major resistance into new support, and that level is being tested again. If it holds, we’re likely looking at another leg up possibly towards $124K.
Nothing is broken. Just a typical retest in an uptrend.
DYOR, NFA
Thanks for the reading

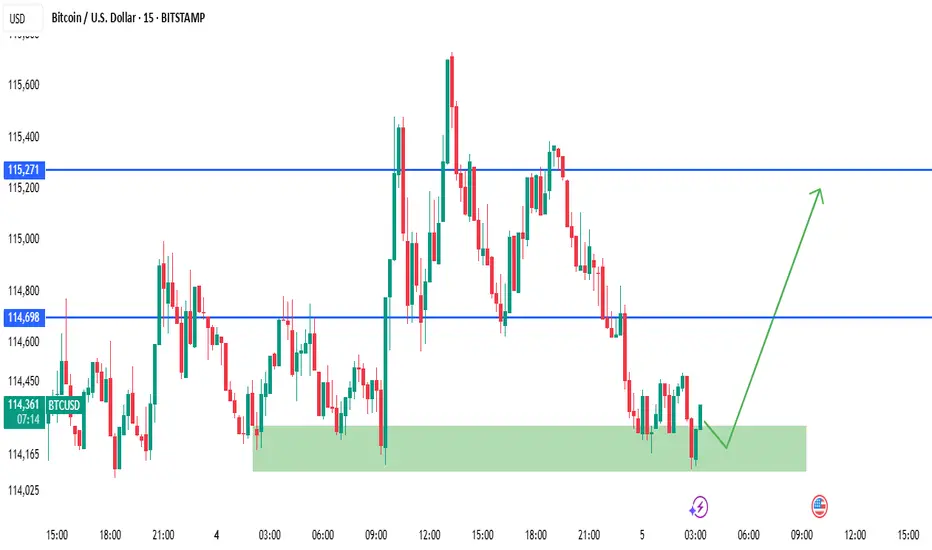
BTCUSD Rejection from Demand Zone – Bullish Play Ahead?Bitcoin just tapped into a strong intraday demand zone (green zone) after a clean selloff. This area has previously acted as a reaction point and is showing signs of holding again.
🔰 Key Levels:
🟩 Demand Zone (Buy Zone): $114,050 – $114,200
🔵 Intraday Resistance: $114,698
🔵 Final Target (Liquidity Pool): $115,271
💡 Bullish Plan:
Entry: Inside demand zone ($114,050 – $114,200)
SL: Below $114,000 (structure invalidation)
TP1: $114,698
TP2: $115,271
The green arrow shows a potential bullish move towards liquidity resting above recent highs if price shows rejection or bullish candle confirmation (e.g., engulfing, pin bar).
📊 SMC Notes (Optional for Advanced Traders):
This is a possible mitigation of a bullish order block from earlier structure.
Price may be completing a liquidity sweep before internal structure break and rally.
Watch for a Change of Character (CHOCH) on lower timeframes for refined entry.
⚠️ Disclaimer:
This is not financial advice. Always use proper risk management and confirm your entries. This is for educational and analysis purposes only.
🔖 Tags:
#BTCUSD #Bitcoin #SmartMoney #PriceAction #OrderBlock #CryptoSignals #RejectionTrade #FrankFx14 #TradingView
Bitcoin Long Position: Strong Trendline Support! Looking to take a long position on Bitcoin (BTC/USDT) as it bounces off the ascending trendline 🚀. The trendline has historically shown strong support levels, and it’s currently retesting it for a potential reversal.
Key Points:
Current Price: 112,580 USDT 💰
Support Zone: Trendline support is around 112,000 – 111,800 ⬇️
Target: Higher Highs near 116,322 (EMA 20 resistance level) 📈
Stop Loss: Set just below the trendline at 111,500 🔒
Trade Setup:
Entry: At 112,580 USDT
Stop Loss: 111,500 USDT
Target 1: 114,800 – 115,500 USDT
Target 2: 116,322 USDT (potential breakout)
Reasoning:
Trendline Rebound: BTC is testing a major trendline support.
Short-Term Momentum: Expecting a continuation after this test.
Risk Management: Tight stop below the trendline for safety.
🔔 Stay updated: Follow for more setups and updates! Happy trading!

BTCUSDT: Elliot Wave AnalysisAs you can see in the chart, the fourth wave has ended and there is a possibility of an increase in the next stage to the level between 128,000 and 131,000, followed by a correction for a larger fourth wave and finally the last leg of the increase to the fifth wave, which has the possibility of reaching 139,000 to 140,000.

BTC Next Move Toward $150K?Bitcoin recently broke out above a long-standing resistance zone ($110K–$115K), supported by a clean move through the volume profile high node. After testing local highs, BTC is now pulling back to retest the breakout area, a critical level that could act as new support.
Key Points:
Breakout Retest: Price has pulled back into the breakout zone around $114K, aligning with strong previous resistance that may now flip to support.
Volume Profile: A strong high-volume node is visible below ($105K–$110K), which reinforces this area as a major demand zone.
EMA Confluence: The 50-day and 100-day EMAs are trending upward and aligning near the retest area, providing additional support.
If this level holds, BTC could resume its bullish leg toward the $150K level.
Cheers
Hexa

BTCUSD INCREASES Bitcoin looking to be targeting new highs and I’m simply following the trend and keeping trading simple
Bullish Flag Forming on BTCUSDT – Is the Next Big Move Coming?🧠 Complete and Insightful Technical Analysis:
The 12H BTCUSDT chart is currently showcasing a textbook Bullish Flag pattern, a powerful continuation structure that often precedes major upward moves.
---
🏗️ Pattern Breakdown: Bullish Flag
1. Flagpole:
The sharp breakout from around $107,000 to $123,000 marks the impulsive rally — this is the flagpole, created by strong bullish momentum.
Represents the "lift-off" phase where buyers dominate the market.
2. Flag (Consolidation Phase):
After the strong rally, price consolidates inside a downward-sloping parallel channel, forming the flag.
This pullback is healthy, characterized by declining volume, a key feature of the Bullish Flag.
Indicates temporary profit-taking before continuation.
3. Confirmation:
A breakout above the flag's upper boundary (around $123,000 – $124,000) with strong volume would confirm the pattern.
Breakout traders often use this as a high-probability entry.
---
📈 Bullish Scenario (High Probability):
If BTC breaks above the flag structure:
🎯 Measured Move Target (Based on Flagpole Height):
$123,000 + ($123,000 - $107,000) = $139,000
🚀 Potential for further upside if macro conditions and sentiment support the move, possibly reaching $135,000+ in the medium term.
Confirmation Required: A strong candle close above $123,500 with volume spike.
---
📉 Bearish Scenario (If Breakdown Occurs):
If BTC breaks down below the flag (~$117,000):
Retracement likely toward previous breakout zones at $112,000 – $109,000
Such a breakdown could turn the current structure into a fakeout or bear trap
However, this zone may present a strong re-entry opportunity for long-term bulls.
---
📚 Educational Insight for Traders:
Bullish Flags often appear during strong uptrends, acting as a pause before the next leg up.
A healthy pattern shows shrinking volume during the flag and rising volume at breakout.
Traders should monitor key horizontal resistance and volume behavior for confirmation.
---
🧭 Conclusion:
BTCUSDT is at a critical technical juncture. The formation of a clean Bullish Flag suggests the potential for a major continuation rally. Confirmation through a breakout is key — this is the time to prepare, not react.
#BTCUSDT #Bitcoin #BullishFlag #BTCBreakout #CryptoTechnicalAnalysis #CryptoTrading #PriceAction #BTCAnalysis #BitcoinPattern #CryptoEducation #BTCFlag #ContinuationPattern
