#BITCOIN: Still Expecting Price To Touch $60K To $65K! Bitcoin is likely to drop further down before we could see a strong bullish move taking price to all time high. This is our view only and it is not an guaranteed move; once price touch our reversal zone then we could see price going back to all time high. Good luck and trade safe!
Team Setupsfx_
Like And Comment Our Ideas For More Such Educational content! 📊🚀
Btcusdtoday

BTC/USD 30mints AnaylsisBTC/USD is currently reacting around a key order block zone.
Price may sweep liquidity into the demand area, then look for a bullish continuation toward the highs.
Watching for confirmation before entry — clean setup with strong upside potential.

BTCUSD: Narrow range at highsBTCUSD is trading in an extremely narrow range at highs today, with clearly tiered core support and resistance levels. The trading strategy centers on waiting for a breakout with volume and following the trend, with strict position control enforced.
Core Support Levels:
Short-term (Intraday Core)88,500 USD (Strong Support): The lower boundary of the consolidation range, a critical bull-bear demarcation level for the short term. A break below this level requires volume confirmation to validate a weakening trend.
Medium-term (Daily Chart, Swing Reference)87,000 USD (Strong Support): The level of the previous consolidation platform, a key defensive position for swing bullish positions. A break below this level will open up further downside correction space.
Core Resistance Levels:
Short-term (Intraday Core)90,500 USD (Intraday Resistance): Today’s high, where pullbacks are likely to occur on rebounds and tests of this level.
Medium-term (Daily Chart, Swing Reference)93,000 USD (Strong Resistance): The upper boundary of the previous consolidation range, a key target for short-term rebounds. A breakout above this level will leave no significant technical resistance to the upside.

BTCUSD: Retracement from elevated levelsBTCUSD trended in a pattern of pulling back from highs and extending weak consolidation during the intraday session. Hit by the escalation of U.S.-EU tariff frictions, rising geopolitical risks and a sell-off in risk assets, the price plummeted sharply from the high of $95,500 and now hovers within the range of $87,000–$91,000. Market panic sentiment is mounting, bears hold the upper hand technically, and rebound momentum remains constrained.
Support Levels:
Short-term Strong Support: 87,000 (lower boundary of the intraday consolidation range, key support zone for rebounds)
Secondary Support: 86,000 (weekly moving average support, previous congestion zone)
Medium-term Support: 85,000 (defensive line for the medium-term trend)
Resistance Levels:
Short-term Strong Resistance: 91,000 (intraday rebound resistance level, bears’ defensive line)
Secondary Resistance: 92,000 (4-hour moving average resistance, key resistance for rebounds)
Medium-term Resistance: 95,000–96,000 (previous all-time high, a strong resistance zone dominated by bears)
Trading Strategy:
Buy 88000 - 88500
SL 87500
TP 90500 - 91000 - 92000
Sell 91000 - 91500
SL 92000
TP 89500 - 88000 - 87200

BTCUSD: Pressure-driven pullback then low consolidationBTCUSD traded in a pattern of correcting under pressure followed by low-range consolidation and recovery today. During the Asian session, it came under selling pressure alongside other risk assets amid escalating U.S.-EU trade frictions, with bears dictating the near-term price action. The core trading range has shifted lower to 90,000–93,000.
Support Levels:
90,000–90,500 (Strong Support): Confluence of the intraday low and the EMA30 trend support level, which has attracted buying interest on multiple retests and serves as the core short-term defense zone for bulls. A breakdown below this level could trigger a further decline toward the 89,000–89,800 range.89,000–89,800 (Medium Support): Boasts robust support strength; a test of this range is likely to trigger a technical rebound.
Resistance Levels:
92,800–93,000 (Strong Resistance): Confluence of the upper boundary of the intraday consolidation range and short-term moving average resistance. Bulls have made multiple unsuccessful attempts to breach this level, which stands as the key defensive line for short-term bears. A decisive breakout could open up upside momentum toward the 93,500–94,000 range.93,500–94,000 (Medium Resistance): Confluence of the 0.618 Fibonacci retracement level and previous swing highs, exerting marked downward pressure and acting as a key target for the bulls’ medium-term rebound.
Trading Strategy:
Buy 90500 - 90800
SL 91000
TP 92000 - 92500 - 93000
Sell 92800 - 93000
SL 93500
TP 92000 - 92500 - 93000

BTCUSD Intraday AnalysisBTCUSD traded in a pattern of retesting support followed by consolidation intraday, maintaining a high-range oscillation overall with the bullish structure remaining intact. The core intraday tussle focused on the 94,000–96,000 range, where profit-taking flows and support buying coexisted in balance.
Intraday Short-term Levels:
Support Levels:
94,200–94,300 (Strong Support): Confluence of intraday lows, short-term neckline and the 0.618 Fibonacci retracement level, with effective buying interest confirmed by multiple retests.
94,800–95,000 (Medium Support): Lower boundary of the consolidation range, acting as a secondary key defense zone for short-term bulls.
Resistance Levels:
95,700–95,800 (Strong Resistance): Confluence of intraday highs and previous swing highs; a decisive breakout requires significant volume confirmation.
96,000–96,500 (Medium Resistance): Psychological level plus previous congestion zone, exerting marked downward pressure on price action.
Trading Strategy:
Buy 94800 - 95000
SL 94000
TP 95500 - 96000
Sell 95800 - 95600
SL 96000
TP 95000 - 94500

BTCUSD Spikes Post-NFP, Then Pulls BackThe core trend of BTCUSD is high-level consolidation with weak upward momentum and supported pullbacks. It has been consolidating narrowly around the $90,500 mark intraday, and is overall trapped in a tug-of-war range between the key resistance at $91,000 and the psychological support at $90,000. The probability of sideways trading over the weekend remains high.
After the release of the U.S. nonfarm payrolls data on Friday, BTCUSD surged to around $91,960, then retreated under the pressure of profit-taking and a stronger U.S. Dollar. A long upper shadow formed on the daily chart, indicating strong resistance around the $92,000 level. During the pullback, the $90,000 threshold platform provided solid support, with no breakdown accompanied by heavy trading volume.
Support Levels:
$90,000 (psychological level, short-term bullish defense line)
$89,600–$89,800 (recent low platform, key support)
$89,000 (secondary strong support)
Resistance Levels:
$91,500–$92,000 (intraday high and recent key resistance zone)
$93,600 (upper band of the daily Bollinger Bands, medium-term resistance)
Trading Strategy:
Buy 90000 - 90500
SL 89500
TP 91000 - 91500
Sell 91500 - 92000
SL 92500
TP 90500 - 90000

$BTC/USDT ANALYSISOn the 8-hour MEXC:BTCUSDT chart, price shows a clear rejection from the higher-timeframe supply zone around the mid-94k area, confirming that strong sell orders are still active there, and the subsequent decline has brought price back into the prior breakout region near 89–90k, which is now acting as a critical decision zone; structurally, the market is trading within a rising base but momentum has weakened, indicating distribution rather than aggressive accumulation, and the current consolidation below resistance reflects compression after rejection rather than strength, meaning as long as price remains below the major supply and fails to reclaim it, downside risk remains elevated, while only sustained acceptance and holding above the 89–90k support would shift the bias back toward continuation higher.

BTCUSD: weak oscillating patternToday, BTCUSD has extended its correction trend that started in October, exhibiting a weak oscillating pattern. Prices have been range-bound around the core zone of $85,000–$86,000. Following the flash crash after the price challenged the $90,000 level, the pair is now lingering near the critical support at $85,000, with bears firmly in control of the market.
Support Levels:
$85,000 serves as the current core lifeline. This level corresponds to the 0.786 Fibonacci retracement of the uptrend that began in April. A daily close below this threshold will most likely trigger a new round of panic selling, opening the door to the next support zone of $78,000–$80,000. In the short term, a weak support has formed around $86,000, though its effectiveness has already been undermined. From the perspective of the daily EMA indicator, $85,000 also coincides with the EMA 400 level, further underscoring its significance as a support level.
Resistance Levels:
For any short-term rebound, the primary resistance zone lies at $87,000–$88,000, with $87,200 and $87,500 as key intraday resistance points. Stronger resistance is concentrated at $91,000 (the midpoint of the previous consolidation phase) and $94,700. Additionally, the descending trend line from the October high has formed a robust resistance barrier. Without the support of large-scale spot buying, it will be difficult for any rebound to break through these levels.
Trading Strategy:
Sell 86500–87000
SL 87500
TP 85000 - 84000 - 83000
Buy 85000 - 85200
SL 84500
TP 86000 - 86500 - 87000

BTCUSD Rebound & ConsolidationToday, BTCUSD is experiencing a narrow-range consolidation following a oversold rebound. Despite bouncing roughly 3% from its overnight low, the bearish structure on the daily timeframe remains intact. Market sentiment stays cautious, and the short-term trend will still hinge on the defense of key price levels and upcoming macroeconomic data releases.
The November U.S. nonfarm payroll data delivered a strong headline but weak internals outcome. It neither altered market expectations for the Federal Reserve’s monetary policy nor provided clear unilateral guidance. Meanwhile, year-end institutional settlements have triggered liquidity tightening, coupled with a slowdown in stablecoin growth, which has weighed on Bitcoin’s short-term risk appetite. Additionally, expectations surrounding the Bank of Japan’s interest rate hike remain uncertain—an unexpected 50-basis-point rate hike could spark a fresh round of correction in Bitcoin prices.
On the support front, the $85,000–$86,000 zone serves as the core support range. This level not only marks the early November low but also encompasses the average cost basis of U.S. spot Bitcoin ETFs. Approximately 400,000 BTC were purchased within this range, making it a robust structural support for the year. A breakdown below this zone would open the door to a further decline toward $80,000–$82,000.
For resistance, the initial hurdle lies at $88,000–$88,500 (yesterday’s rebound peak), with further resistance at $89,700–$90,500. A decisive breakout above this upper resistance band would pave the way for a potential rally toward $94,000.
In summary, BTCUSD is likely to trade within the $85,000–$94,000 range in the short term. Going forward, focus should be placed on the U.S. inflation data and remarks from Federal Reserve officials scheduled for Thursday. Ahead of the release of these key data points and policy signals, the market will most likely adopt a wait-and-see stance, with prices lacking a clear directional bias.
Trading Strategy:
Buy 86000 - 86500
SL 85500
TP 87500 - 88000
Sell 88000 - 88500
SL 89000
TP 86000 - 85500

BTCUSD’s Weak ReboundToday, the BTCUSD pair exhibited a volatile and weak trend characterized by a decline followed by a pullback. After a sharp drop in the early trading session, it staged a slight rebound but still failed to break free from the recent downward trend overall. Bulls and bears engaged in fierce rivalry around key price levels, which was driven by multiple factors including expectations for macroeconomic policies, institutional attitudes and market sentiment.
Resistance Levels
The key short - term resistance stands at $90,400, a level that corresponds to the CME futures gap formed over the weekend. It exerts a strong magnetic pull on the price and serves as a crucial juncture determining whether the rebound can gain further momentum. The $90,500 level, where multiple moving averages converge on the 4 - hour chart, also acts as a resistance level. If this level can be breached, the pair will subsequently face a strong resistance zone between $92,000 and $94,000. Only a volume - backed breakout of this zone will enable Bitcoin to be expected to regain upward momentum.
Support Levels
The current core support zone ranges from $88,000 to $89,000. If this zone is lost, the price may further decline to the key Fibonacci Retracement level of $85,569, or even lower regions, and the subsequent trend will weaken further.
Trading Strategy:
Sell 91500 - 92000
SL 92500
TP 90000 -89000- 88000
Buy 88000 - 89000
SL 875000
TP 91000 - 91500 - 92000

Weekly BTCUSD Trend SummaryThis week, BTCUSD launched a strong rebound following a previous sharp decline, but later pulled back after hitting resistance, presenting an overall oscillatory recovery pattern characterized by "rebound – rally – pullback."
1. Early-Week Oversold Rebound with Intense Long-Short Dynamics (November 24)
At the start of the week, BTCUSD extended its oversold rebound after touching a 7-month low of $80,600 the prior week. Prices briefly broke above $88,000 in the morning, with an intraday peak gain of 3.85%; however, the market pulled back in the afternoon, slipping below $86,000 to turn slightly negative.
2. Mid-Week Oscillatory Uptrend as Bearish Momentum Faded (November 25 – 26)
November 25: Prices traded around $88,000, approaching the key resistance level of $90,000, forming a three-day consecutive rebound on the daily chart.
November 26: A bullish rally emerged in the evening, with prices surging approximately 5,000 points to successfully break through the $90,000 mark. However, the rally lacked subsequent volume support, preventing prices from extending further into higher ranges and laying the groundwork for a subsequent pullback.
3. Late-Week Rally Followed by Pullback, Halted at Key Resistance (November 29 – 30)
In the latter half of the week, the market experienced a turning point. On the morning of November 29 (Friday), prices touched a weekly high of $93,092 but immediately pulled back. Subsequently, prices retreated to around $90,000 to seek support, testing the validity of the $90,000 – $91,000 support range. From a market analysis perspective, the area around $93,000 represents the high of a consolidation range following multiple previous pullbacks, featuring strong resistance.
Overall Outlook & Key Drivers
Overall, BTCUSD staged a significant rebound from recent lows this week, but the lack of sufficient volume during the rebound was a prominent issue. Going forward, focus should be on whether prices can hold above the $90,000 support level—if broken, a further pullback may ensue. Conversely, if BTCUSD can regroup and break through the key level of $93,500, it may attempt to challenge the two-month downtrend line around $96,000.

BTCUSD: Test the resistance zone of 89,000 - 90,000BTC is in a phase of sideways consolidation following a rebound. Its price fluctuates within the trading range of 88,000 - 89,000. Although the bulls still possess upward momentum, the obvious resistance lies ahead. Meanwhile, the market sentiment has been gradually recovering from the previous panic, and the overall market is in a pattern where both bulls and bears are conducting cautious tentative moves.
After stabilizing around the 85,000 level earlier this week, the asset has launched a three - consecutive - day rebound, with a relatively solid support level in place.
Focus on the short - term resistance zone of 89,000 - 90,000 ahead. If this zone is broken through, the price may surge towards the range of 92,000 - 94,000.
Buy 85500 - 86000
SL 85000
TP 87000 - 88000
Sell 89000 - 89500
SL 90500
TP 86000 - 85000

BTCUSDT(BITCOIN): Bitcoin is bearish for now at least! Bitcoin is in distribution phase if we using the smart money concept, that is why we think price is at the final point before it drop faster. There will be mixed views regarding the bitcoin, but this is our personal view and which is more likely view compare to buying. Please use accurate risk management while trading bitcoin. This setup may take time to get it completed, and we will keep you guys updated.
Good luck and trade safe!
Team Setupsfx_

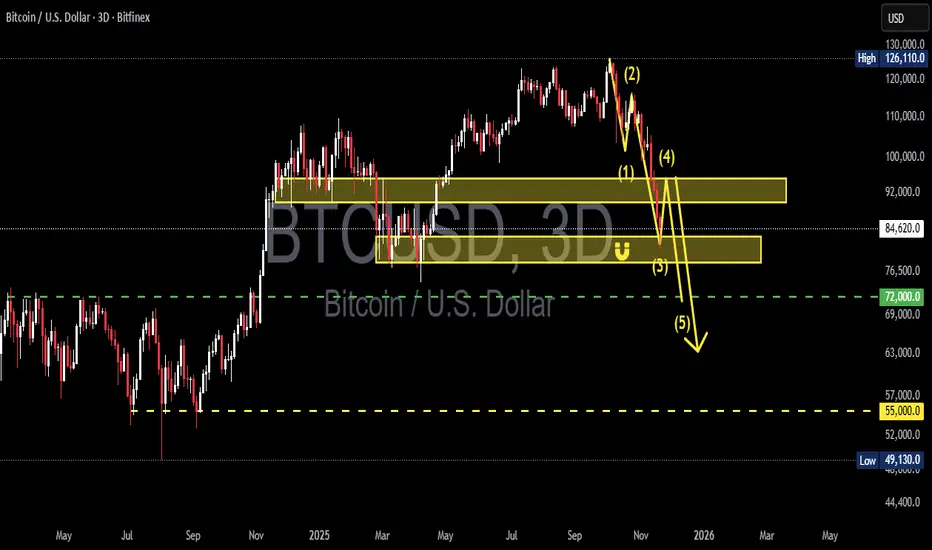
BTC/USDT — Bearish Impulse Structure Near Completion, Is Wave 5?Bitcoin is entering one of its most decisive phases since reaching its recent cycle high. On the 3-Day timeframe, the price is forming a clear 5-wave bearish impulse, and the entire structure is now converging into one critical question:
Are we standing right at the edge of the “final flush” into Wave (5)?
---
📌 The Bigger Picture
After peaking in the 120–126k region, BTC entered a distribution phase that triggered a sharp decline into Wave (1).
The rebound into Wave (2) failed to break new highs — a strong confirmation that the market lost bullish strength.
Now the price is trapped between:
Major Supply Zone (~92k) → Historical distribution block with heavy seller presence
Key Demand Zone (84.6k–78k) → Critical retest zone that acts as the last defensive wall for mid-term buyers
From here, the market narrative becomes very clear:
If BTC loses the 84–78k zone, Wave (5) becomes highly probable — targeting 72k, with an extended risk toward 55k if capitulation unfolds.
---
📉 Bearish Scenario — “The Final Flush”
This is the dominant scenario if the impulse structure continues to hold.
1. Strong rejection from the 92k Supply Zone
If BTC fails to reclaim 92k on a 3D close, Wave (4) is likely complete.
2. Breakdown below 84–78k
This signals buyer exhaustion and confirms momentum toward Wave (5).
3. Wave (5) targets:
72k → primary target
55k → extreme capitulation target (similar to 2019 or 2021 flushes)
This scenario becomes fully validated with a decisive 3D close below 84k.
Volume confirmation will be crucial.
---
📈 Bullish Scenario — “Wave Failure & Trap Reversal”
For BTC to invalidate the bearish structure, buyers must deliver a strong response:
1. A powerful bounce from the 84.6k–78k zone
Not just a wick, but a 3D bullish engulfing with strong volume.
2. A clean break + 3D close above 92k
This invalidates the bearish wave count and opens the door to 105–110k.
3. Formation of a new Higher Low above 84k
A structural confirmation that bulls regain control.
This bullish scenario is less likely —
but in crypto, “unlikely” doesn’t mean “impossible,” especially if the market is setting up a bull trap before the next major leg.
---
🎯 Key Levels to Watch
92,000 → Major Supply / Macro resistance
84,660 – 78,000 → Key Demand Zone / Buyer defense block
72,000 → Critical support & Wave (5) ideal target
55,000 → Deep support if a capitulation event unfolds
---
📊 Why This Pattern Matters
A 5-wave impulsive decline typically appears at either:
The beginning of a major correction, or
The end of a macro bullish expansion
If BTC reaches 72k:
It could become the largest accumulation zone before the next bull expansion
Or signal the completion of the previous macro cycle
Either way, the next move will shape BTC’s direction for the next 6–12 months.
---
#Bitcoin #BTCUSD #BTCAnalysis #CryptoOutlook #ElliottWave #PriceAction #CryptoMarket #BTCBearish #BTCBullish #MarketStructure #CryptoTA
BTC: Bottoming ConsolidationBTCUSD is staging a weak rebound from the lows and oscillating around the $90,000 mark today. Overall, it has yet to break free from the recent sharp correction trend. Meanwhile, technical indicators are showing oversold rebound signals, while pressures from the macroeconomic and capital sides are significantly restricting the upside potential.
Currently, the 90,000 level serves as a key battleground. Having acted as a crucial support level after the previous breakdown, this level has now become a critical psychological resistance during the ongoing rebound. The immediate resistance zone at 93,500 remains effective, with a further resistance level at 95,000. On the downside, the key support lies at 89,000. A break below this level will most likely trigger a new round of sell-offs, subsequently testing the support range between 80,000 and 85,000.
In the short term, BTCUSD is likely to continue its sideways consolidation to build a bottom. If it can hold firm at the 90,000 level and the macro environment eases—such as the Federal Reserve issuing dovish signals or the resumption of capital inflows into Bitcoin ETFs—the price is expected to rebound to the range of 95,000 - 100,000. However, if a black swan event like the Federal Reserve adopting a more hawkish stance occurs, the price may breach the 88,000 support level and slide further to test the 75,000 - 80,000 range.
Sell 93000 - 93500
SL 94000
TP 90000 - 89500 - 89000
Buy 89000 - 89500
SL 88000
TP 92000 - 92500 - 93000

BTC Short-Term Weakness PersistsBTC continued to decline last week, not only breaking below key support levels but also erasing all its year-to-date gains. Affected by multiple factors including capital outflows, macroeconomic conditions and technical trends, the short-term market remains in a bear-dominated weak pattern.
Today, Bitcoin opened near the bottom and staged a slight rebound, but the technical picture still shows a clear bearish dominance with downward momentum not yet fully exhausted. The previous key support level of 94,000 has been breached, and the next support lies around 92,800. If this level is broken, the price may fall further. On the upside, short-term resistance is concentrated in the 98,000-100,000 range, and a breakthrough in the short term is highly challenging.
Sell 96,000 - 97,000
SL 98,000
TP 94,000 - 94,500
Buy 92,800 - 93,500
SL 92,000
TP 94,500 - 95,000

BTC Extends Weak Volatile DeclineBTC witnessed a slight decline with certain price fluctuations today, continuing its recent correction trend. This price drop is a continuation of the ongoing downward trajectory.
Bitcoin had already recorded a significant fall on November 14th. Prior to that, Bitcoin ETFs saw a massive net outflow of approximately 870 million US dollars on November 13th, marking the second-largest single-day withdrawal since the launch of such funds.
Coupled with the market's reevaluation of expectations for the Federal Reserve's interest rate cuts, this has exerted sustained pressure on high-risk assets like Bitcoin, consequently leading to the continuation of the correction trend for Bitcoin's price today.
Today, BTC maintained a weak volatile downward pattern. In the short term, it is constrained by factors such as ETF capital outflows and adjustments to macroeconomic expectations. For the subsequent trend, close attention should be paid to the stability of the support level around 94,000, as well as the shifts in institutional capital flows and marginal changes in macro market sentiment.

BTCUSD: Sharp DropBTCUSD showed a sharp decline today, breaking below the key psychological level of 100,000, with violent intraday volatility. Both technical and capital flows indicate a bearish bias. After opening, the price did not continue the previous consolidation trend; although there were brief signs of stabilization in the morning, it subsequently entered a downward trajectory.
The 100,000 level had been a crucial psychological support for the market. After breaking below this level today, the price further dropped to 95,853 and failed to rebound quickly to reclaim the lost ground. Combined with the 4-hour technical structure where BTC has been in a descending channel, the persistent downward pressure from the 20-period and 60-period moving averages remains unresolved. Following this breach of key support, there may be further downside pressure ahead.
Going forward, focus on the support strength around 95,000. A breakdown below this level could trigger a new round of selling; if it stabilizes here, a short-term technical rebound may occur, but the overall weak pattern is unlikely to reverse easily in the near term.
Trading Strategy:
Buy 95,000 - 95,500
SL 94,500
TP 98,000 - 99,000 - 100,000
Sell 99,500 - 100,000
SL 100,500
TP 98,000 - 97,000 - 96,000

BTCUSD: Narrow-range consolidationToday, BTCUSD overall showed a trend of bottoming out with a slight rebound followed by a narrow-range consolidation, with price movements being volatile and fluctuating. In the morning, prices remained under pressure, fluctuating below 103,500, then rebounded quickly, but the upward momentum was weak, encountering obvious resistance below 105,500.
The short-term resistance above focuses around 106,000. Only a breakthrough of this level accompanied by increased trading volume can confirm a short-term reversal signal. Further resistance can be watched at 108,000; a firm hold above this level would give bulls the opportunity for a sustained rebound.
For support below, close attention should be paid to 102,000. If this support level is breached, prices may further test 99,800. As a key psychological and technical support level, a break below 100,000 could trigger more stop-loss orders, exacerbating downward pressure.
Currently, BTC's short-term trend is relatively weak but supported, and it is likely to consolidate in the 102,000 - 105,500 range.
In terms of operation, it is recommended to adopt a strategy of buying low and selling high with quick entries and exits. Do not blindly chase the upward trend; instead, patiently wait for prices to break through key ranges with increased volume and for the trend to clarify before adjusting positions to reduce trading risks.
Trading Strategy:
Buy 103,000 - 103,500
SL 102,500
TP 104,500 - 105,000 - 105,500
Sell 105,500 - 106,000
SL 106,500
TP 104,500 - 104,000 - 103,500

#BTCUSDT: From $74,000 to $88,000 Moving Well! More Growth CominIt’s been on a steady climb from $74,000 to $88,000. We’re expecting even more growth in the coming weeks. The price has finally broken free from its consolidation phase and is now on the rise. We think it’ll reach $94,000, then $100,000, and maybe even go up to $120,000 by the end of the year.
What do you think? Let me know in the comments below!
Thanks!
Team Setupsfx_

BTCUSD: Overall trend is moving downwardLooking at the candlestick chart, Bitcoin has formed a potential M-top or double top pattern, which is a typical top reversal signal. Currently, the price has broken below all short-term moving averages, indicating obvious weakness.
Yesterday, it is consistent with my analysis. BTC broke below the short-term support at 102,000, fell to around 100,000 where it found support and rebounded. However, this also showed an overall downward shift in the trend, with yesterday’s short-term support at 102,000 having turned into today’s resistance.
Overall, I predict that Bitcoin will continue its overall downward trend today. The short-term support is at 100,000, and a break below this level would target 98,000.
For resistance above, we still focus on 105,000 in the short term, with key attention on 108,000. Only a breakthrough and a firm hold above 108,000 could lead to sustained gains.
Buy 100,000 - 100,500
SL 99,000
TP 102,000 - 102,500 - 103,000
Sell 103,500 - 104,000
SL 104,500
TP 102,000 - 101,500 - 101,000

BTCUSD: Consolidation is the main theme todayYesterday, BTC saw intense battles around the psychological threshold of 100,000. During the session, it once broke below the key support at 99,500, then rebounded to around 104,000.
Today, it pulled back to around 102,000 at the opening of the Asian session and began to consolidate again.
On the upside, the 105,000-105,500 zone forms a crucial resistance range. Only a daily close firmly above this level can confirm the reversal of the short-term downtrend. For today's short-term support, we still focus on 100,000. If it breaks below 100,000, we need to pay key attention to the supporting role of 98,000.
Buy 100,500 - 101,000
SL 100,000
TP 102,000 - 102,500 - 103,000
Sell 103,000 - 103,500
SL 104,000
TP 101,500 - 101,000 - 100,500
