BITCOIN BREAKOUT - WHERE TO??Drop a 👍 if you're watching this closely.
This is a perfect example of a choppy/ranging market on a 15min timeframe.
Price could either breakout of the previous high/resistance at $69,400 or breakout below the previous low/support at $68,600.
Breakout upward or downward??
BTCUSDTPERP

Check out the conditions for a continued uptrend
Hello, fellow traders!
Follow us to get the latest information quickly.
Have a great day!
-------------------------------------
#BTCUSDT
The price is showing a decline near the left Fibonacci level of 0.618 (65760.59).
Therefore, we need to examine whether support can be found in the 65304.01 to 65713.04 range, which corresponds to the DOM(-60) to HA-Low range on the 15m chart.
Based on the 1D chart, the decline is likely to continue. Therefore, if the price finds support in the 65304.01 to 65713.04 range mentioned above and rises, we need to focus on finding a selling position.
If the price fails to do so and falls immediately, we should examine the support near the left Fibonacci level 0.5 (64459.42).
A closer look at the 15m chart reveals that the price fell from the HA-High indicator before encountering the HA-Low indicator.
Therefore, if the price falls from the HA-Low indicator this time, a stepwise downtrend is likely.
This stair-step downtrend is different from the decline that occurs when the price falls from the HA-High indicator and meets the HA-Low indicator.
Since a stair-step downtrend renews its low, there's a chance it could turn into an uptrend upon a rebound.
A decline from the HA-High indicator to the HA-Low indicator is more likely to show sideways movement than to turn into an uptrend, making it challenging to trade.
Therefore, we need to be bold and enter trades when support is found near the HA-Low indicator.
However, as mentioned earlier, because of the possibility of a stair-step downtrend, we should consider whether to cut losses when the price falls or to buy more when it meets the HA-Low indicator again after the decline.
Anyone with some understanding of charts can predict whether the price will fall or rise in the future.
However, because how to trade at support and resistance levels is learned through extensive trading experience, chart analysis can sometimes fail to properly reflect this in actual trading.
Therefore, what we should practice and study is not chart analysis, but rather how to develop a trading strategy that suits our investment style.
If the price declines from the left Fibonacci ratio 0.5 (64459.42), it will eventually touch the previous high range of 57694.27 to 61299.80.
When the BSSC indicator on the 1D chart rises above zero and remains above it, it marks the starting point for an uptrend.
For an uptrend to continue from its starting point, the StochRSI and On-By-Signal Value indicators must show upward trends.
The StochRSI indicator should not rise into overbought territory, and the On-By-Signal Value indicator should rise above its High Line and remain there.
If these conditions are met, the upward trend will finally continue.
-
Thank you for reading to the end.
I wish you successful trading.
--------------------------------------------------
- Here's an explanation of the big picture.
(3-year bull market, 1-year bear market pattern)
------------------------------------------------------

Bitcoin - The next bullrun starts soon!🏅Bitcoin ( CRYPTO:BTCUSD ) creates the bearmarket bottom:
🔎Analysis summary:
Looking at the higher timeframe, Bitcoin remains totally bullish. And despite the recent expected drop of about -50%, Bitcoin is now retesting a massive support area. After we see bullish confirmation in the near future, Bitcoin will start its next bullish cycle.
📝Levels to watch:
$60,000
SwingTraderPhil
SwingTrading.Simplified. | Investing.Simplified. | #LONGTERMVISION

How to interpret the current movement
Hello, fellow traders!
Follow us to get the latest information quickly.
Have a great day.
-------------------------------------
The key points to watch are the HA-Low indicator and the DOM (-60) indicator.
If the HA-Low and DOM (-60) indicators provide support, then that's a good time to buy.
Accordingly, the key question is whether the price can rise after finding support in the 68687.84 ~ 70580.26 range.
-
The StochRSI 20, 50, and 80 indicators are displayed on the chart because they provide useful information for detailed trading.
The StochRSI indicator can also be viewed as an indicator that reverts to its mean based on the 50 level.
Therefore, we need to carefully monitor the trend when the StochRSI crosses the 50 level.
While the StochRSI indicator is typically interpreted based on when it enters or exits overbought or oversold levels, this provides useful information when interpreting auxiliary indicators.
Currently, the order is StochRSI 20 > StochRSI 80 > StochRSI 50.
In other words, to break out of the low zone (oversold zone), the StochRSI must rise above the 20 level. Therefore, ultimately, we can see that the StochRSI must rise above the 20 level (75719.90).
However, the StochRSI 80 level is formed at 71453.53, indicating that a short-term peak has been formed.
This suggests that the current trend is likely a rebound from a downtrend.
Even if the StochRSI rises above the 80 level, if it fails to rise above the 20 level, it is highly likely that the price will eventually decline.
However, if the price remains above the StochRSI 50 level, the upward movement may trigger a change in the positions of the StochRSI 20 and StochRSI 80 indicators, potentially signaling a continued uptrend. Therefore, it's important to monitor whether the price can remain above the StochRSI 50 level (70130.00).
-
To break above a key point or range and continue the uptrend, the StochRSI, BSSC, and OBV indicators must show upward trends.
If possible,
1. The StochRSI indicator should not enter the overbought zone.
2. The BSSC indicator should remain above the 0 level.
3. The OBV indicator should remain above the High Line.
When the above conditions are met, the uptrend is likely to continue.
The current behavior of these auxiliary indicators indicates that the conditions for a sustained uptrend are not yet met.
Therefore, when support is found near the 68,687.84 ~ 70,580.26 range, we should examine whether the above conditions are met.
-
Summary of the above:
1. Support range: 68,687.84 ~ 70,580.26
2. Beginning of a full-blown short-term uptrend: 75,719.90
3. Volatility range: 71,453.53 ~ 75,719.90
Therefore, if support is found at the support range and the trend reverses while moving sideways in the volatility range, we can interpret this as indicating a potential continuation of the uptrend.
Since indicators change position over time, their interpretation may vary depending on the position at the time of the change.
-
Thank you for reading to the end.
I wish you successful trading.
--------------------------------------------------

#BTC #BTCUSD #BTCUSDT #BITCOIN #Update #Analysis #Eddy#BTC #BTCUSD #BTCUSDT #BITCOIN #Update #Analysis #Eddy
As I said in my previous signals and analysis, Bitcoin's fall occurred exactly according to my analysis. (I hope you used and enjoyed my previous signals and analysis)
Now what is the next move for Bitcoin in my opinion?
Considering the demand area that Bitcoin is confirming and the PRZ area and the important one, Bitcoin is likely to rise from the price range of $60,000 to $70,000 to the area of $103,000 to $109,000.
On the other hand, we are witnessing the formation of the Quasimodo "QM" pattern in the RMT style, and from the ICT point of view, we are witnessing CHOCH, and considering the LIT style and observing IDM, we can say that this structure can be the continuation of Bitcoin's movement. That is, the rise to areas above $100,000 and then continuing to fall towards $30,000.
I have identified important demand areas for you in higher time frames.
I have indicated for you the type of movement it can make from the specified areas with PATH arrows.
This analysis is based on a combination of different styles, including Dow and Wyckoff theories, as well as market structure and Quasimodo pattern in RTM style with a combination of ICT and LIT styles.
Get the necessary confirmations to enter the trade from this analysis based on your strategy and style.
Don't forget about risk and capital management.
You are responsible for the transactions and I am not responsible for your failure to comply with risk and capital management.
💬 Note: This is only a possibility and this analysis, like many other analyses, may be violated. Given the specific conditions of Bitcoin, it cannot be said with certainty that this will happen and this is just a view based on the RTM and ICT style and strategy with other analytical styles, including the liquidity style.
Be successful and profitable.
Review the result of my previous analysis of Bitcoin:

Will #BTC continue to fall?📊Will #BTC continue to fall?
🧠From a structural perspective, we haven't stabilized above 68,000, so it's reasonable that our test of the S/R level here was rejected. The 64,000-66,000 area still represents support, but a rebound has occurred, weakening its effectiveness. If you still want to participate in long positions here, it's recommended to use only a small amount of capital.
➡️Good support is around 60,800, with extreme support around 58,888.
⚠️Note that the previous low L is an invalid defense point, as there's still a chance it will break below this level, so please manage your risk carefully.
Let's see 👀
🤜If you like my analysis, please like 💖 and share 💬
BITGET:BTCUSDT.P

#BTC/USDT Weekly Technical Analysis. Will 200EMA Save the day?Bitcoin has broken down from the rising channel and is now sitting on a major confluence zone: weekly FVG and 200-week EMA around 70K–76K. This is a critical demand area.
Key levels
Support: 60K – 66.5K
Invalidation: weekly close below 66.5K
Recent weekly candles show aggressive sell-side expansion into long-term support. We saw a strong impulsive red candle breaking structure, followed by long lower wicks below 70K, showing buying absorption. The latest candle is sitting on the 200-WEMA, suggesting selling pressure is slowing.
The price might just be forming a higher-timeframe base here before the next impulsive move.
A breakdown below 66K would open the door to the next weekly FVG at 43K–48K.
Bias
This looks like a higher-timeframe correction, not a bear market. Smart money typically accumulates in this zone.
If you find this helpful , follow me and please hit the like button.
Do share your views in the comments.
Thank you
PEACE

BITCOIN – MORE DUMP OR PUMP?Drop a 👍 if you’re watching this closely.
On the 45-minute timeframe, Bitcoin faced rejection around the 71K zone and has been trending downward since that reversal.
Momentum is currently favoring the bears, but the big question is:
Are we heading for continued downside, or is this just a pullback before a shift in momentum to the upside?
Is Bitcoin preparing for another leg down… or setting up for a reversal and fresh push higher?
Let’s hear your take. 👇

Bitcoin Bored Range… Big Bounce Loading? (66K Zone)Over the past four or five days, Bitcoin ( BINANCE:BTCUSDT ) has been moving within a range, which might have made some traders a bit bored.
Right now, BTC is moving inside a heavy support zone($78,260-$64,850) and, in the past couple of days, seems to be inside a small descending channel.
From an Elliott Wave perspective, it looks like Bitcoin is completing the corrective wave C of the main wave Y, in a Double Three Correction structure(WXY).
I expect that Bitcoin will rise from the Cumulative Long Liquidation Leverage($66,120-$64,420) and climb at least to $68,971. If it breaks the upper line of the descending channel with strong momentum, we could even anticipate a move up to $71,311. Let me know your thoughts!
First Target: $68,971
Second Target: $71,311
Stop Loss(SL): $63,821
Points may shift as the market evolves
Cumulative Long Liquidation Leverage: $60,000-$58,000
Cumulative Short Liquidation Leverage: $73,100-$71,620
CME Gap: $84,560-$79,660
CME Gap: $54,545-$52,980
💡 Please respect each other's opinions and express agreement or disagreement politely.
📌Bitcoin Analysis (BTCUSDT), 1-hour time frame.
🛑 Always set a Stop Loss(SL) for every position you open.
✅ This is just my idea; I’d love to see your thoughts too!
🔥 If you find it helpful, please BOOST this post and share it with your friends.

Where are the key support levels for #BTC?📊Where are the key support levels for #BTC?
🧠From a structural perspective, we are still in a downtrend. Significant resistance has formed around 72,000, with the next resistance level around 74,500.
➡️Currently, we are in a weak support zone. Only a solid structure forming here can we participate in a bullish formation, or only after stabilizing above 68,000 should we chase the rally!
➡️A better support zone is around 64,000, with an extreme support level around 60,588.
⚠️US January employment data will be released today, so be wary of potential sharp fluctuations.
🤜If you like my analysis, please like💖 and share💬
BITGET:BTCUSDT.P

BTCUSDT IDEA,BTCUSDT is price is entring a strong demand zone, watch here for a clear confirmation of bounce and take long. No confirmation= no trade. If price breakdown that area then avoid long.

BTCUSDT | Two Setups Near Key ResistanceWe are currently trading in a sensitive and potentially dangerous area, but at the same time we have several nearby zones of interest that could provide opportunities.
For this scenario I am considering two different setups, so traders can choose the level of exposure that best fits their risk profile:
🔹 Tight execution → short risk window, quick invalidation in case of adverse movement.
🔹 Wide execution → increased tolerance to volatility, targeting the same destination.
Risk management offers approximately 3:1 on the extended plan and around 1:1 on the conservative approach.
⚠️ This trade carries additional risk.
If the 4H structure confirms continuation, price could easily rotate back toward the supports.
While I currently doubt a full breakdown due to the amount of interest zones around, it remains a real possibility and must be respected.
Everything will depend on what happens around 71,800.
If price shows clear resistance or rejection in that region, the trade will be closed. No need to fight the market.
If, on the other hand, the level breaks with strength, we will be in a position to protect the trade and reassess how the next phase develops.
Patience and capital protection first.

This Volatility Period: February 6th - 8th
Hello, fellow traders!
Follow us to get the latest information quickly.
Have a great day!
-------------------------------------
(BTCUSDT 1M Chart)
The price fell from the critical 69,000 - 73,499.86 range.
We need to see if it finds support near the previous high of 57694.27 to 61299.80.
I believe the price range it cannot return to is below the 42283.58 to 43823.59 range.
-
(1D chart)
This period of volatility is expected to last from February 6th to 8th.
Therefore, the key question is how far it can rebound.
We need to see if it can rise to the critical 69000 to 73499.86 range.
If not, we need to see if it can rise above the left Fibonacci level of 0.618 (65760.59).
The next period of volatility will be around February 17th (February 16th-18th), so the key question is where the price will begin its sideways movement after this period of volatility.
The 57694.27-61299.80 range represents the previous high point, the first significant uptrend, and thus holds some significance.
The M-Signal indicator on the 1D chart is still forming at 87944.84, so we should also monitor whether it re-forms after this period of volatility.
This is because an uptrend begins when it meets the minimum DOM (-60) or HA-Low indicator.
-
Thank you for reading to the end.
I wish you successful trading.
--------------------------------------------------
- This is an explanation of the big picture.
(3-year bull market, 1-year bear market pattern)
I will explain in more detail when the bear market begins.
------------------------------------------------------

#BTC Bearish Head and Shoulders Structure📊#BTC Bearish Head and Shoulders Structure 📉
🧠From a structural perspective, after a strong rebound, we reached the blue resistance zone, but didn't see any intention to test the extreme resistance at 74,000. Furthermore, after a period of sideways consolidation, we've formed a bearish head and shoulders structure within the blue resistance zone, so there's a probability we'll continue to fall from here.
⚠️Today is the start of the week, so significant volatility is expected. Please be sure to manage your risk carefully.
Let's see 👀
🤜If you like my analysis, please like 💖 and share 💬 BITGET:BTCUSDT.P

Bitcoin Cycle Fractal: Consolidation Before Bear Market 2026History Repeats: 2020–2022 vs 2024–2026
In 2020 , before the strong bull run of 2020–2021, Bitcoin formed a clear bull flag consolidation on the higher timeframe.
After the bull market top in 2021 , price entered a distribution phase , forming a bearish structure, which eventually led to the bear market of 2022.
The current market structure looks very similar.
During 2024–2025, Bitcoin is again consolidating after a strong impulse, forming a rising structure that resembles previous pre-bear-market consolidations.
If this fractal continues to play out, I expect:
Continuation of consolidation in 2025
Transition into a bear market in 2026
My near-term downside target is the 60–65k USD range, which aligns with previous support and structural levels.

BTCUSD Either 200k USD or 40k next level ?BTCUSD might test 0.78% by touching 40k mark
alternative it turns around at 50% and next headed to 200k

BTC 4HR Time Frame 7th Feb 2026 🟠 BTCUSDT | 4H TIME FRAME UPDATE
10x Limitless VIP | Osmaan Mooraby
📉 Market Structure
BTC is clearly trading in a downtrend.
Price dropped aggressively toward the $60,000 zone and then bounced back to the EMA 25 around $71,725.
That EMA acted exactly as expected
➡️ strong resistance
➡️ clean rejection
Right now, BTC is holding around $67,500 and the market looks heavy.
⚠️ Downside Scenarios
If weakness continues, we can expect:
🔻 First downside level
👉 $63,000
🔻 Worst case scenario
👉 $60,000
If price revisits $60,000, there is a high chance of a double bottom forming before any serious upside attempt.
This is where smart money usually absorbs liquidity before moving price higher.
💧 Upside Liquidity Zones
If BTC manages to stabilize and reverse:
🔹 First upside liquidity
👉 $71,700 EMA 25
🔹 Next liquidity pools
👉 $75,000
👉 $81,000
These levels are magnets for price, but they must be earned, not assumed.
🎯 Trading Plan
If BTC drops into the $63,000 to $60,000 zone, that becomes a good scalp long opportunity.
🛑 Invalidation
A 4H candle close below $58,000 kills the long idea completely.
Until then, stay tuned for updates..

BTCUSDT | Reaction at Weekly Support – 4H Rebound & Daily TargetBitcoin is currently reacting from a key weekly support zone after a strong bearish impulse.
On the 4H timeframe, price is showing signs of a technical rebound, supported by oversold conditions and a clear rejection from lower levels. This setup favors a short-term counter-trend move, with the first upside target located around the 74,000–76,000 USD zone, which aligns with a nearby resistance area.
From a daily perspective, BTC remains positioned on a macro support level. If the rebound develops with continuation, the daily target area is located around 85,000 USD, corresponding to a higher-timeframe resistance zone.
Key levels & scenarios:
Primary scenario: Rebound from weekly support
4H target: 74,000–76,000 USD
Daily target: ~85,000-90,000 USD
Invalidation: Clean break and acceptance below the weekly support
Alternative scenario: If support fails, the next major support is around 54,000 USD
At this stage, market structure favors a reaction and bounce before any deeper downside continuation.
This is a technical analysis idea, not financial advice.

BTC Breakdown Below $78.5K — Bearish Continuation Toward $55K?On the 3D timeframe (3-Day), Bitcoin’s structure appears to have exited the distribution phase at the top and is now entering a mid-term corrective phase. After printing a higher high around 120K+, price action has formed a sequence of lower highs → lower lows, indicating a structural shift from bullish to bearish in the medium term.
The recent sharp decline shows an impulsive sell-off that broke below a key horizontal support around $78,500, which previously acted as a demand / mid-range support zone.
This breakdown has turned the level into a new resistance (S/R Flip).
---
Pattern Formation
Several patterns can be identified on this chart:
1. Distribution → Markdown Phase (Wyckoff Context)
The upper range around 100K–120K reflects a distribution phase.
Multiple fake breakouts occurred before the final breakdown.
Once mid-range support failed, the market entered markdown.
2. Lower High Structure
After the ATH, every bounce failed to create a new high.
This signals weakening buyers and increasing seller dominance.
3. Bearish Retest Setup
The yellow path illustrates a common scenario:
Breakdown
Retest resistance
Rejection
Continuation downward
This is a classic breakdown → pullback → continuation structure.
---
Key Levels
Resistance:
$78,500 → Major resistance (former support)
$90K area → Minor supply if strong reclaim occurs
Support / Demand:
$55,000 → First major demand zone
$49,500 → Macro demand / previous cycle ATH zone
The $49K–$55K region is a historically strong HTF reaction zone.
---
Bullish Scenario
A bullish outcome remains possible but requires strong confirmation.
Bullish Requirements:
1. Price reclaims $78,500 with strong HTF candle closes.
2. Successful retest holding as support.
3. Structure shifts back into higher highs.
Upside Targets if reclaim succeeds:
$90K
$100K
$110K+
A reclaim of the breakdown level often triggers a short squeeze.
---
Bearish Scenario (Primary Outlook)
This is the dominant scenario based on the chart.
Bearish Flow:
1. Breakdown from $78,500.
2. Pullback / retest to resistance.
3. Rejection.
4. Continuation toward lower demand zones.
Downside Targets:
$62K (minor support)
$55K (major demand)
$49.5K (macro support / cycle level)
If $49K breaks, the market could enter a deeper macro correction.
---
Conclusion
BTC’s structure on the 3D timeframe shows a shift from bullish to mid-term bearish after losing the key $78.5K support.
As long as price remains below this level, market bias leans bearish with downside potential toward the $55K–$49.5K demand zone.
A reclaim of $78.5K becomes the key invalidation level for the bearish outlook.
#BTC #Bitcoin #BTCUSD #CryptoAnalysis #TechnicalAnalysis #BTCChart #CryptoMarket #PriceAction #SupportResistance #Wyckoff #MarketStructure #BearishScenario #BullishScenario #CryptoTrading

Bitcoin - The beginning of the bottom🚀Bitcoin ( CRYPTO:BTCUSD ) just ended its bearmarket:
🔎Analysis summary:
Over the past couple of months, Bitcoin has been dropping about -50%. But with today's retest of the major confluence of support, we are already seeing some first rejection. It all just comes down to Bitcoin creating bullish confirmation at this major reversal area.
📝Levels to watch:
$60,000
SwingTraderPhil
SwingTrading.Simplified. | Investing.Simplified. | #LONGTERMVISION

BTCUSDT Weekly UpdateBTCUSDT Weekly Update.
Bitcoin is currently trading around $70K after a sharp rejection from the recent highs near $100K.
Price has dropped back into the major weekly support zone ($68K–$72K)
This zone previously acted as resistance in 2021–2024 → now acting as flip support
Strong volatility after the breakdown from the rising structure
Weekly trend still bullish as long as support holds
Major Support: $68K – $72K
Next Support: $60K – $62K (critical demand zone)
Resistance: $80K → $92K → $100K
Bearish Scenario If weekly closes below $68K, BTC may revisit $60K or even deeper liquidity before recovery.
Bullish Scenario Strong reclaim + weekly close back above $75K–$78K could restart momentum toward $90K+ / $100K.
Market Structure Overall macro trend remains bullish, but short-term momentum is weak → possible consolidation / shakeout phase before the next big move.

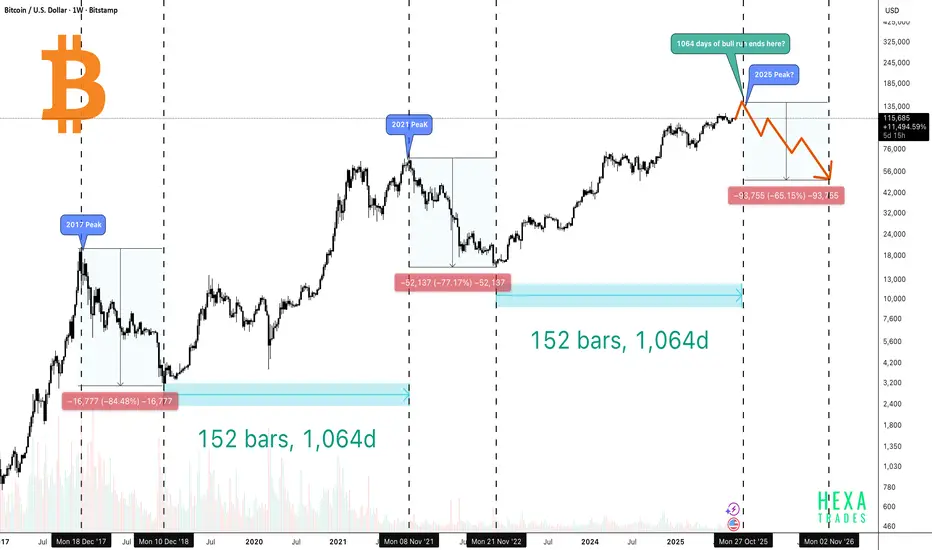
Bitcoin Peak Coming in 45 Days?The above chart compares Bitcoin’s previous market cycles (2017 and 2021) with its current trajectory in 2025, aiming to identify whether history might be repeating. It highlights how long Bitcoin’s bull runs last, how steep the crashes are afterward, and when the next peak and correction could happen.
🔶 2017 Peak
- Bitcoin topped out in December 2017.
- After the peak, BTC crashed by -84%, dropping from around $20K to nearly $3K.
- The bear market lasted about 1 year of decline, followed by roughly 1,065 days of bull run from the bottom before a new cycle peak.
🔶 2021 Peak
- Bitcoin peaked again in November 2021.
- Price fell by -77%, retracing from nearly $69K to about $15K.
- Similarly, the downturn lasted around 1 year of drop, and the recovery phase extended for about 1,065 days of bull run from the bottom.
🔶 2025 Peak?
- If the pattern repeats, the next top could align around late October 2025 and reach the $140K–$150K range.(1,064–1,065 days from the December 2022 bottom).
- In every cycle, Bitcoin’s crash percentage has decreased, suggesting the asset is maturing. If this pattern repeats, we could see a 60–70% drop, pushing the price back toward the $40K–$60K range.
Conclusion
Bitcoin’s historical cycles suggest a repeating rhythm of 1 year of decline followed by ~3 years of recovery and growth. Both the 2017 and 2021 cycles lasted about 1,065 days from bottom to top, with each new bull run setting higher all-time highs and each crash becoming less severe.
If this pattern continues, Bitcoin could potentially reach the $140K–$150K range by late October 2025, before facing another correction in the 60–70% range, possibly pulling the price back to the $40K–$60K zone.
While the market shows signs of maturity with institutional adoption and reduced crash percentages, history reminds us that sharp corrections often follow euphoric peaks. For long-term investors, the lesson remains clear: cycles repeat, but opportunities also return.
BTC Monthly MACD Turns Bearish - Major Correction Ahead?Bitcoin has printed a bearish MACD crossover on the monthly timeframe, a signal that has historically aligned with the start of major market corrections. This pattern appeared during the 2018 top, again near the 2022 macro peak, and the chart now shows a similar bearish crossover forming once more.
Each previous monthly MACD bearish crossover occurred after a prolonged rally and was followed by a multi-month downtrend. The current crossover resembles those same market conditions, suggesting that BTC may be entering a deeper corrective phase if history repeats.
Key Highlights
- Monthly MACD bearish crossover, historically signals macro trend reversals.
-Similar crossovers occurred before the 2018 and 2022 bear markets.
-Strong rejection candle near major resistance aligns with previous cycle tops.
- Momentum weakening after an extended rally suggests potential for further downside.
- Monthly timeframe signals carry high weight and can drive long-term market direction.
Cheers
Hexa
