BTC/USD BULLISH REVERSAL SETUP TARGET 111K, 113K, 115.Key Levels:
Entry Zone: Around 109,800 – 110,000
Price is consolidating just above this level, indicating possible re-accumulation.
Stop Loss: Below 108,300 – 108,400
This sits under the recent swing low (a strong liquidity area).
Targets:
Target 1: 111,637 → Reclaim of structure high.
Target 2: 113,656 → Previous supply zone / liquidity pool.
Target 3: 115,249 → Full bullish objective and previous major high.
Structure & Smart Money Flow:
The chart shows BOS (Break of Structure) and CHoCH (Change of Character) signals, implying the bearish trend may be reversing.
Price likely tapped into a demand zone below liquidity (Stop Hunt) before showing bullish intent.
The marked consolidation suggests Smart Money accumulation, preparing for a possible upside expansion.
Strategy Outlook:
✅ Bullish Confirmation: A clear break and retest above 110,000–111,000 zone would confirm buyers in control.
⚠️ Invalidation: A break below 108,300 would invalidate the bullish scenario and could resume the bearish trend toward 107,000–106,000 support.
🎯 Risk-to-Reward: Approx. 1:3 to 1:5, favoring long positions if executed near entry.
Summary:
Market Structure: Bullish Reversal Forming
Entry Zone: 109,800 – 110,000
Stop Loss: 108,300
Targets: 111,637 → 113,656 → 115,249
BTCUSDTPERP

Today's Bitcoin Trading StrategyTechnical aspect: "Support broken + Trend continuation", the bearish dominant pattern has been established
The price has successfully broken through the key support range: $109,100 is located between the psychological threshold of $110,000 and the 200-day moving average ($107,846). The 1-hour chart shows that after the price continuously attempted to reach $110,000 for 3 times without success, it formed a "head and shoulders top" pattern and broke through, with the neckline at $109,500 being lost. After that, the decline measured pointed to $107,000. More importantly, the 50-day moving average at the daily level has crossed below the 100-day moving average, forming a "death cross". This is the first medium-term bearish signal since 2024 May. Historical data shows that when such a technical combination occurs, the average decline within 5 trading days is 5.3%. Meanwhile, although the RSI indicator has entered the oversold zone, there is no divergence signal, indicating that the downward momentum has not yet exhausted.
Today's Bitcoin Trading Strategy
sell:109000-110000
tp:108000-107000
sl:111000

Multidimensional short-selling strategies and in-depth analysisFunding situation: "Institutional wait-and-see + Small investors' takeover", with a disparity in takeover strength
ETF and on-chain data show a distinct divergence: During the rebound period, the net inflow of the US Bitcoin spot ETF was only 0.8 billion US dollars, significantly less than the selling scale (5.2 billion US dollars) during the previous decline. This indicates that institutions have a low recognition of the rebound; while on-chain small addresses (1-10 BTC) increased their holdings by 62% around 110,000 US dollars, contrasting with the net outflow of whales (1000+ BTC), presenting a dangerous structure of "small investors' takeover + large players' cash-out". The derivatives market exposes more risks: Although the short-to-long ratio of perpetual contracts has risen from 0.89 to 1.02, the long positions are concentrated on platforms dominated by small and medium-sized investors (such as Huobi, with a 54% long position), while the long positions on leading platforms (Coinbase, Binance) are only 49.3%, indicating a disparity in capital quality that suggests the rebound is unlikely to last.
Cross-market "risk assets' linkage retreat", with valuation anchors moving downward
The 30-day correlation between Bitcoin and the Nasdaq 100 Index dropped from 0.75 to 0.61, and the weakened synchronization is due to the overall pressure on risk assets: The earnings reports of leading US technology stocks like Apple and Microsoft were below expectations, and the Nasdaq 100 Index broke below the 50-day moving average, leading to a cooling of risk appetite; at the same time, the hedging attributes of gold and US Treasuries have rebounded, with the 10-year US Treasury yield falling from 4.2% to 4.05%, indicating a clear trend of capital shifting from high-risk assets to safe-haven assets. This combination of "stock-currency linkage retreat + risk aversion rise" has deprived Bitcoin of external upward momentum, and its own valuation (the current price is still 1.8% lower than the average cost of institutions at 112,300 US dollars) has partially released the demand for valuation repair through the rebound.
Emotional aspect: "Rebound overextension + expectation correction", optimism has peaked
The panic and greed index quickly rose from the "panic" range of 28 to the "neutral" range of 45, with short-term emotional recovery being too rapid, and the implied volatility (IV) of call options in the futures market (higher than put options IV) from -3% to +2%, indicating that the optimistic expectations for the rebound have been overpriced. Historical data shows that when the emotional indicator rises by more than 15 points within 3 trading days and the IV premium of options turns positive, the probability of a correction within the next 48 hours is 73%, and the overextension of the emotional aspect provides an opportunity for short sellers to reverse.
Today's Bitcoin Trading Strategy
sell:109000-110000
tp:108000-107000
sl:111000

#BTC Reaches Support Zone📊#BTC Reaches Support Zone✔️
🧠In the previous post, we discussed the need to be wary of the "sell the news" effect after the release of interest rate cut expectations! As expected, the market experienced a significant pullback, testing the two support levels I was watching (109000, 106621). The rebounds after touching these support levels have already occurred, indicating a significant success rate.
➡️From a structural perspective, it's reasonable that we broke below the bullish defense point (106621) and then experienced a sharp rebound after capturing the bullish liquidity there. However, this also implies the emergence of expectations for a medium-term correction, so we should be wary of a deeper correction. New bullish expectations will only emerge after we patiently wait for a breakout above the gray S/R level.
➡️Currently, our long positions have locked in major profits. Shorting opportunities will need to be sought after a further price rebound.
Let's see 👀
🤜If you like my analysis, please like 💖 and share 💬
BITGET:BTCUSDT.P
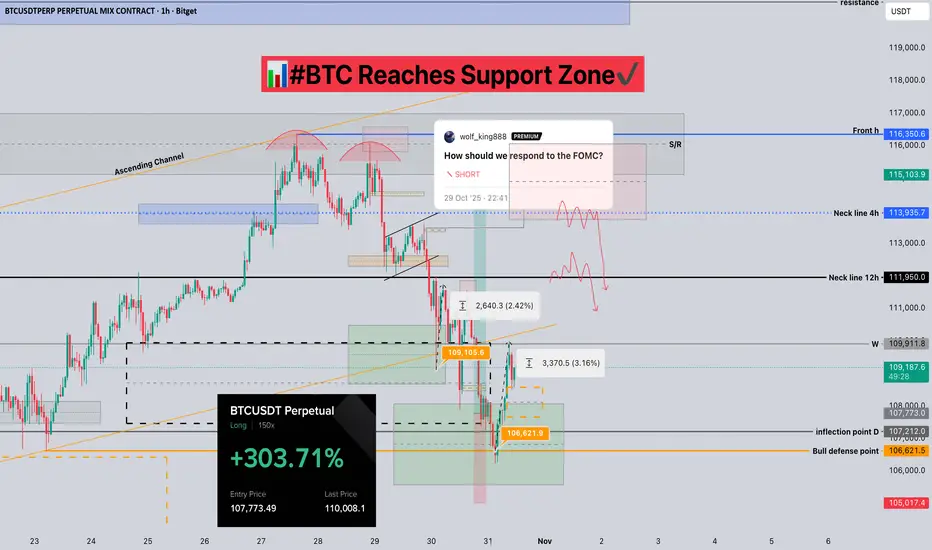
How should we respond to the FOMC?📊How should we respond to the FOMC?
🧠Yesterday, we failed to break through the gray resistance zone (S/R), instead forming a double-top bearish structure in this area. Therefore, our long position opened at the 4-hour neckline support has already hit our cost price and been closed. After a pullback, it tested the 1-hour neckline support and the black descending trendline, and a rebound occurred, but we didn't see a strong upward move, so we closed our long position here as well.
➡️The expectation of a rate cut has already been priced in during the upward movement, so we should be wary of (sell the news)!
➡️If we cannot hold the current support, then we need to be wary of a deeper pullback. The next support level to watch is around 109000, and the extreme support level to watch is the bulls' defense point (106621).
Let's see 👀
🤜If you like my analysis, please like 💖 and share 💬 BITGET:BTCUSDT.P

Market volatility, why I dare to be bullish on BTC#BTCUSD BITSTAMP:BTCUSD BINANCE:BTCUSDT
The BTC market has been declining since yesterday's US session, with a sharp drop following Powell's hawkish comments, hitting a low of around 106,500. Institutional trading activity has decreased in the short term, suggesting a deliberate wait-and-see approach, anticipating further price corrections before re-entering the market. Therefore, do not blindly participate in trading in the short term.
The current BTC market may seem bustling, but it is actually rife with undercurrents. A new direction will only be established when sentiment reaches its peak and volatility subsides. Perhaps the next real starting point will not be in the current clamor, but after the cheers of retail investors subside. Pay attention to the performance of the downward channel support level of 160,000-104,500. If it pulls back to this range, you can consider establishing a small long position.

BTC/USD: Wave 5 Launch or Wave Cycle End?BTC/USD: Wave 5 Launch or Wave Cycle End?
📈 Weekly Scenarios
Bullish scenario: Price holds above ~$110,000, breaks through ~$120,000 → wave (5) strengthens → possible rise to ~$135,000-140,000.
Consolidation: Price trades between ~$110,000 and ~$120,000 without a formed structure, the market is paused.
Bearish scenario: Break of support at ~$110,000 with volume → corrective wave A-B-C → possible decline to ~$100,000-105,000.
✅ Conclusion
On the weekly timeframe, BTC/USD is at a key turning point: either an upward impulse (wave (5)) or the beginning of a major correction.
Holding support at ~$110,000 is the basis for a bullish scenario.
A breakout of resistance at ~$120,000 is a signal for continued growth.
A breakout below ~$110,000 is a signal for a change in structure.

#BTC UpdateCRYPTOCAP:BTC Support: $110K | Resistance: $116K
As long as BTC continues to move sideways between these levels, it’s better to avoid using high leverage.
Nothing lasts forever, and that includes this boring price action.
Sooner or later, things will pick up, but now is the time to prepare while no one’s paying attention.
The plan is simple: preserve funds and wait for a breakout, regardless of direction.

Where is #BTC support?📊Where is #BTC support?
🧠From a structural perspective, it's reasonable to see resistance at the gray S/R resistance zone and a pullback. However, bullish patterns are present on the long-term charts and on both the 1-hour and 4-hour charts, with targets yet to be reached. Therefore, we should seek support to enter a long trade.
➡️We are currently testing the 4-hour neckline support, which is considered aggressive.
➡️More robust support is near the intersection of the 1-hour neckline and the black descending trendline S/R.
Let's see 👀
🤜If you like my analysis, please like 💖 and share 💬
BITGET:BTCUSDT.P

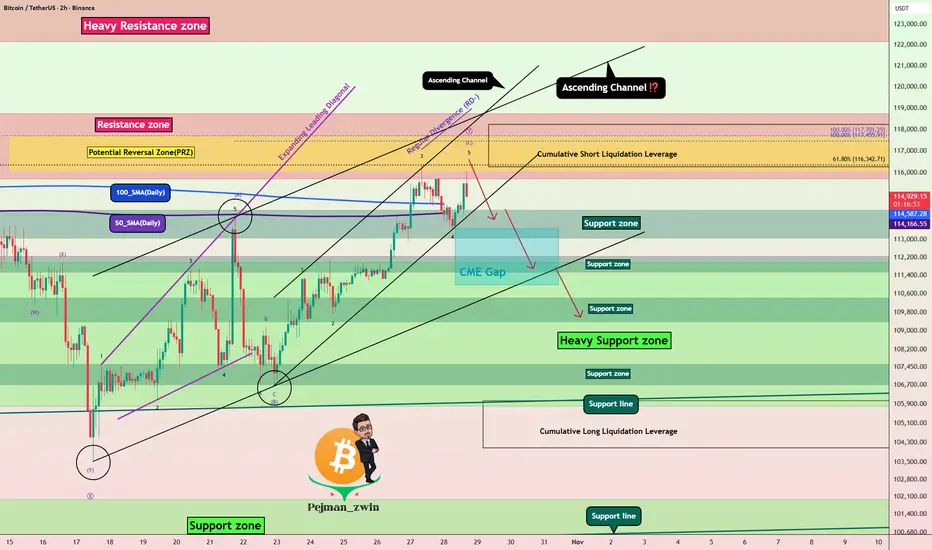
Bitcoin Hits PRZ – Time for a Correction?As I expected yesterday , Bitcoin ( BINANCE:BTCUSDT ) did drop down to the Support zone($114,300-$113,000) at the lower line of the ascending channel and then started rising again today. Both Long and Short positions basically hit their Targets .
At the moment, Bitcoin is moving near a Resistance zone($118,740-$115,740) , the Potential Reversal Zone(PRZ) , and Cumulative Short Liquidation Leverage($118,224-$116,281) .
From an Elliott Wave perspective , it seems like Bitcoin is completing the microwave 4 of the microwave C of the main wave Y . There's a noticeable Negative Regular Divergence(RD-) between the last two peaks, which suggests some weakening momentum .
I expect that Bitcoin won't break through the Resistance zone($118,740-$115,740) easily and may fall back at least to the Support zone($114,300-$113,000) . If it drops below the 100_SMA(Daily) and 50_SMA(Daily) , we could see a deeper decline and possibly the CME Gap($113,495-$110,990) being filled.
Note: Another point to mention is that although the SPX500( TVC:SPX ) has been hitting new all-time highs as the new week began, BTC has shown a bit less correlation with it in the last day. So if the S&P 500 undergoes a correction, Bitcoin might actually see a sharper pullback, which is something to watch out for as a potential negative factor for Bitcoin.
Note: Also, keep in mind that tomorrow, some important U.S. economic indices will be released, which could also influence the market. So definitely factor that into your considerations.
Note: In general, the crypto market in the past couple of weeks has been heavily influenced by news around U.S.-China tariffs. Any headline can cause Bitcoin and other tokens to swing up or down, so keep an eye on those geopolitical headlines.
Cumulative Long Liquidation Leverage: $106,033-$104,090
Please respect each other's ideas and express them politely if you agree or disagree.
Bitcoin Analysis (BTCUSDT), 2-hour time frame.
Be sure to follow the updated ideas.
Do not forget to put a Stop loss for your positions (For every position you want to open).
Please follow your strategy and updates; this is just my Idea, and I will gladly see your ideas in this post.
Please do not forget the ✅' like '✅ button 🙏😊 & Share it with your friends; thanks, and Trade safe.
No Rise in Sight — 107K Might Be RightAt the moment, I don’t see any technical reasons for Bitcoin to continue its rally.
For now, I’d like to see Bitcoin move down toward the 107K area or even lower.
The invalidation level of this scenario is marked in red on the chart

Bitcoin Rally Heating Up – Watch This Zone Carefully!As the new week kicked off, Bitcoin ( BINANCE:BTCUSDT ) started to climb, fueled by a pump in the S&P500 index ( SP:SPX ) and the creation of a gap in the S&P500 index.
It seems Bitcoin has successfully broken above the 100_SMA(Daily) and 50_SMA(Daily) , as well as a Resistance zone($114,300-$113,000) .
In fact, Bitcoin has also formed a new CME Gap($113,495-$110,990) due to this S&P500 Index -driven surge.
Right now, Bitcoin is approaching the next key Resistance zone($118,740-$115,740) , Potential Reversal Zone(PRZ) , the Cumulative Short Liquidation Leverage($117,577-$116,731) , and the upper line of an ascending channel .
From an Elliott Wave perspective , by breaking this Resistance zone($114,300-$113,000) , Bitcoin has entered a new phase of wave counting. It appears to be completing microwave 4 of the main wave C . Overall, the corrective structure seems to be a Zigzag Correction(ABC/5-3-5) with an expanding leading diagonal in main wave A .
I expect that in the coming hours, after a pullback to the broken Resistance zone($114,300-$113,000) and those moving averages , Bitcoin might rise again at least up to the Potential Reversal Zone(PRZ) . There's a possibility of forming a larger ascending channel, but since we haven't confirmed a second top, we can't rely on that channel just yet.
Note: In general, the crypto market in the past couple of weeks has been heavily influenced by news around U.S.-China tariffs. Any headline can cause Bitcoin and other tokens to swing up or down, so keep an eye on those geopolitical headlines.
Cumulative Long Liquidation Leverage: $113,625-$112,175
Cumulative Long Liquidation Leverage: $106,033-$104,090
Note: If Bitcoin falls below the moving averages and the Resistance zone($114,300-$113,000) again, we can expect further declines.
Please respect each other's ideas and express them politely if you agree or disagree.
Bitcoin Analysis (BTCUSDT), 2-hour time frame.
Be sure to follow the updated ideas.
Do not forget to put a Stop loss for your positions (For every position you want to open).
Please follow your strategy and updates; this is just my Idea, and I will gladly see your ideas in this post.
Please do not forget the ✅' like '✅ button 🙏😊 & Share it with your friends; thanks, and Trade safe.

BTC/USDT: Bearish Drop to 108,500?BINANCE:BTCUSDT is signaling a bearish breakdown on the 1-hour chart , where price is trapped in a descending triangle formed by a downward trendline and an upward trendline, with increasing pressure at the convergence point near resistance—indicating potential for a downside continuation if sellers dominate. This classic pattern suggests weakening bullish momentum amid recent pullbacks.
Entry zone between 112,500-114,000 for a short position. Target at 108,500 near the support zone, offering a risk-reward ratio of 1:2 . 📊 Set a stop loss on a close above 114,500 to protect against an upside breakout. 🌟
Look for confirmation on a break below the entry with surging volume, capitalizing on Bitcoin's current choppy range.
Fundamentally , Bitcoin has seen high volatility recently, hitting new all-time highs above $125K earlier this month before dropping to around $105K, now stabilizing near $111K amid mixed macro signals and uncertainty from large holder movements. Additional catalysts include ancient wallet awakenings transferring billions in BTC and ongoing debates on tokenized gold versus Bitcoin's value. 💡
📝 Trade Plan:
✅ Entry Zone: $112,500 – $114,000 (short zone near resistance)
❌ Stop Loss: Close above $114,500
🎯 Target: $108,500 (major support area)
💎 Risk-to-Reward: Approx. 1:2 – clean, structured short setup within a bearish pattern.
What's your take on this setup? Drop your thoughts below! 👇

Can #BTC continue to rise?📊Can #BTC continue to rise?
🧠From a structural perspective, the long-term trend remains bullish, so any upward movement is justified! Based on the current structure, we've broken through the blue downtrend resistance line and are poised to test last week's high of 115,867. This doesn't make it suitable for short trades, but the profit-loss ratio for chasing gains isn't ideal either, so for now, we can only remain patient and wait for new trading opportunities!
➡️If the price reaches the overlapping resistance zone tomorrow, we can look for short scalping opportunities.
➡️If the price pulls back instead of rising tomorrow, we'll need to look for long trades at lower levels.
⚠️Note that there's a chance the price will continue to challenge the ATH, so shorting is considered counter-trend trading, so please ensure proper risk management.
🤜If you like my analysis, please like 💖 and share 💬
BITGET:BTCUSDT.P

Bitcoin Roadmap– Next Move Down Incoming?As I expected yesterday , Bitcoin ( BINANCE:BTCUSDT ) started rising from the Support zone($107,580-$106,700) and has now hit its Target at the Resistance zone($110,430-$109,380) .
Now the question is: will Bitcoin continue its short-term uptrend in the next few hours, or is it going to drop again? Stay with me to find out.
Bitcoin is trading near the Resistance zone($110,430-$109,380) , Potential Reversal Zone(PRZ) , and Cumulative Short Liquidation Leverage($111,613-$110,542) .
From an Elliott Wave perspective , it seems that Bitcoin is completing the wave C of an Expanding Flat Corrective Pattern(ABC/3-3-5) .
Given that the S&P 500 ( SP:SPX ) ( which has recently been correlated with Bitcoin ) is likely to drop when the U.S. market opens , I expect Bitcoin to resume its decline . This next drop might be the final push to break the Heavy Support zone($111,980-$105,820) .
What do you think? Can Bitcoin break that Heavy Support zone($111,980-$105,820) in the end or not? Let me know your thoughts!
Cumulative Long Liquidation Leverage: $106,606-$105,463
Please respect each other's ideas and express them politely if you agree or disagree.
Bitcoin Analysis (BTCUSDT), 15-minute time frame.
Be sure to follow the updated ideas.
Do not forget to put a Stop loss for your positions (For every position you want to open).
Please follow your strategy and updates; this is just my Idea, and I will gladly see your ideas in this post.
Please do not forget the ✅' like '✅ button 🙏😊 & Share it with your friends; thanks, and Trade safe.

See if it can rise above 110644.40-111696.21
Hello, fellow traders!
Please "Follow" to always get the latest information quickly.
Have a great day.
-------------------------------------
(BTCUSDT 1W Chart)
Support levels for maintaining an uptrend are:
1st: 104463.99-108353.0
2nd: 87814.27-93570.28
Support must be found within the first and second levels above.
To rise above the right Fibonacci ratio of 2.618 (133889.92), which is my target level, the price must rise above the uptrend line (1) and maintain its position.
In other words, the price must rise above the HA-High indicator level of 116259.91 on the 1W chart and maintain its position.
-
(1D Chart)
The key is whether the price can find support near 10443.99-108353.0 and rise above the 110644.40-111696.21 range.
If the price fails to rise, it is highly likely to fall further, so we need to consider countermeasures.
Since the M-Signal indicator on the 1W and 1D charts is passing near the 110644.40-111696.21 range, I believe the trend will likely be determined by the presence of support.
The HA-High ~ DOM(60) range on the 1W chart is formed within the 116,259.91-119,086.64 range, while the HA-High ~ DOM(60) range on the 1D chart is formed within the 120,760.81-124,658.54 range.
Therefore, the 116,259.91-124,658.54 range is likely to act as resistance.
Therefore, I believe a surge in capital is needed to break above this range.
-
Therefore, I believe BTC dominance should rise while USDT dominance should decline.
If BTC dominance rises, most altcoins are likely to move sideways or decline, so altcoin trading requires a strategy to counter this.
BTC dominance is likely to rise to around 61.73,
USDT dominance is expected to fall below 4.55 and break above the resistance level.
-
If both BTC and USDT dominance decline simultaneously, an altcoin bull market could begin.
However, BTC dominance must decline below 55.01, and USDT dominance must also decline below 4.91.
The next period of volatility is expected to occur around October 25th (October 24th-26th).
-
Thank you for reading.
We wish you successful trading.
--------------------------------------------------
- This is an explanation of the big picture.
(3-year bull market, 1-year bear market pattern)
I will explain in more detail when the bear market begins.
------------------------------------------------------

#BTC retests support at 104,000. Can it hold?📊 #BTC retests support at 104,000. Can it hold?
🧠From a structural perspective, the pullback after reaching our ideal red target zone makes sense. After the October 11th crash, market liquidity suffered a devastating blow, so we're likely to see some period of sideways consolidation. Therefore, we continued to reduce our holdings after hitting our short defensive point, locking in a total of 80% profit. Our long position has now been closed at our cost price.
➡️This is the third time we've tested support near 107,400. The more times it's tested, the weaker the support becomes. However, don't chase shorts near this support level. Even if you do short, wait for a break below this support level and a rebound before considering a short position.
➡️If the decline continues, support near 105,188 or the solid support at 103,588 (where we last entered a long position) is worth watching.
Let's see 👀
🤜If you like my analysis, please like 💖 and share 💬 BITGET:BTCUSDT.P

Today's Bitcoin trading strategy, I hope it will be helpful to y The emerging favorable factors (leaving room for long - positions) are as follows:
Capital is starting to : Previously, Bitcoin ETFs saw an outflow of $1.23 billion in a single week, but on October 21st, there was a net inflow of $477 million, and none of the twelve ETFs had an outflow. In particular, large - institution ETFs like BlackRock saw an inflow of $211 million in a single day. This indicates that some of the funds that fled in panic before are now coming back to bottom - fish.
The Federal Reserve may cut interest rates: Federal Reserve Chairman Powell recently signaled in his speech that "more attention should be paid to employment and less worry about inflation", and the market expects a possible interest - rate cut at the end of October. Once the interest rates are cut, the interest on US - dollar deposits will decrease, and the money originally lying in banks may flow into assets like Bitcoin, which is equivalent to "injecting liquidity" into the market.
Regulatory relaxation in some regions: Singapore has postponed the new regulations on crypto - assets originally scheduled for 2026 to 2027, giving the market more time to adapt and also making local institutional funds more confident to participate. This regional regulatory relaxation can, to a certain extent, offset the regulatory pressure in other places.
Today's Bitcoin Trading Strategy
BTC @ buy:107000-108000
pt:109000-110000
sl:105000

Bitcoin at the Top of Wedge – Bearish Reversal Coming Again?As I expected in yesterday’s idea , Bitcoin dropped to the $107,800 level, hitting its target .
In the last few hours, BTC started to pump again and is now trading near a cluster of resistances : the 100_SMA(Daily) , the 50_SMA(Daily) , and Cumulative Short Liquidation($117,517-$116,020) . This creates a strong resistance , and I don’t think Bitcoin will easily break through it. ( As of the time of writing, there’s no fresh news influencing the market .)
From an Elliott Wave perspective, it looks like Bitcoin is forming a Triple Three Correction(WXYXZ ).
On the Classical Technical side, Bitcoin is at the top of an ascending broadening wedge pattern , which is a reversal pattern . There’s also a Regular Bearish Divergence (RD-) between the two peaks in this pattern.
I expect that in the coming hours, Bitcoin will start to drop again. After breaking the important $111,000 level , it could fall at least to the lower line of the ascending broadening wedge .
Note: In these past few days, the Bitcoin and crypto market have been quite volatile and driven by news, especially related to US-China tensions. So always manage your risk carefully and avoid impulsive decisions based on sudden headlines.
New CME Gap: $107,690-$107,220
Cumulative Long Liquidation: $107,105-$104,297
Cumulative Short Liquidation: $115,241-$113,454
Stop Loss(SL): $116,200
Please respect each other's ideas and express them politely if you agree or disagree.
Bitcoin Analysis (BTCUSDT), 1-hour time frame.
Be sure to follow the updated ideas.
Do not forget to put a Stop loss for your positions (For every position you want to open).
Please follow your strategy and updates; this is just my Idea, and I will gladly see your ideas in this post.
Please do not forget the ✅' like '✅ button 🙏😊 & Share it with your friends; thanks, and Trade safe.

Today's Bitcoin long-term trading strategySummary of the Core Situation in the Current Bitcoin Market
Institutional Funds Are "Bottom-Fishing"
Many large global investment institutions are buying Bitcoin. For example, some funds in the United States have increased their Bitcoin holdings by more than 2 billion US dollars in the past month. The purchase of such large sums of money provides support for Bitcoin's price, making it less likely for Bitcoin to plummet significantly.
Regulatory News Is "Mixed"
Some countries (such as the European Union) have recently clarified the rules for Bitcoin trading, which has made the trading more standardized and relieved the market to a certain extent. However, other countries (such as some regions in Asia) are investigating illegal Bitcoin platforms, which occasionally triggers short-term panic selling.
Retail Investors' Sentiments Are Divided
Some retail investors think that Bitcoin's price has risen quite a lot and are worried about a decline, so they have started to sell gradually. On the other hand, some believe that institutions are still buying and the price will rise further in the future, so they are waiting for a lower price to enter the market. This has led to a temporary balance between the buying and selling forces in the market.
Today's Bitcoin Trading Strategy
BTC @ buy:107000-108000
pt:109000-110000
sl:105000

BTCUSDTHello Traders! 👋
What are your thoughts on BITCOIN?
Bitcoin has entered a healthy corrective phase after hitting the upper boundary of its ascending channel. Price is now approaching a key demand zone, which could offer strong support for the next leg higher within the broader bullish trend.
As long as Bitcoin holds this zone, the bullish structure remains intact, and a rebound could target the channel top near $140,000
If Bitcoin breaks below the support zone and closes under the trendline, this would invalidate the current bullish setup, potentially leading to a deeper correction toward lower levels.
Don’t forget to like and share your thoughts in the comments! ❤️

Perfect prediction of BTC trend, today's retracement continuesWith the emergence of the double top structure, gold and silver investors have been taking profits, and market funds have continued to flow into crypto assets led by BTC and ETH.
Historically, BTC and the broader cryptocurrency market have risen after gold peaks, driven by capital rotation.
In his opening remarks at the Federal Reserve's first Payment Innovation Conference held today, Federal Reserve Governor Waller spoke highly of cryptocurrencies and the "DeFi industry." Waller noted that the conference aims to explore how blockchain and cryptocurrency can be integrated into mainstream finance.
At the same time, the Federal Reserve also indicated that it would create a new era in the payment field, and the DeFi industry would not be doubted or despised.
Waller also revealed that he has proposed setting up a new type of account at the central bank, which he called a "payment account." Waller said he has asked the Fed to consider this new type of account, which would make it easier for businesses to access the central bank's payment channels without having to have a full master account. This move has clearly increased market attention for cryptocurrencies.
In the subsequent BTC trading market, we can once again use 109500-108500 as short-term support, and go long on pullbacks to see rebounds. Pay attention to the 113000-115000 resistance zone above. If the momentum is maintained, it may move towards 120000.
BITSTAMP:BTCUSD BITSTAMP:BTCUSD

BTCUSDT — at Edge of the Trend: Bullish or the Next Bear Trap?Main Narrative
Bitcoin is standing at a critical crossroads. After a deep correction from the 126K peak, the price is now forming a Symmetrical Triangle Pattern — a classic setup that appears when the market holds its breath before a major move.
Pressure from both sides — a descending resistance from sellers above and an ascending support from buyers below — is squeezing the price closer to the apex, the point where a decisive breakout becomes inevitable.
The next movement will decide whether the bulls regain control or the bears reclaim dominance.
---
Pattern & Structure Analysis
This triangle has formed after a strong downtrend, signaling a phase of consolidation and uncertainty.
There was one false breakout to the upside (yellow ×) — a typical liquidity trap where market makers lure buyers before pulling the price back inside the pattern.
Currently, Bitcoin remains trapped between:
Descending resistance (upper yellow line): around 110K–112K
Ascending support (lower yellow line): around 106.7K
This is a pressure zone — the longer the price stays inside, the more explosive the breakout will be once it happens.
---
Key Levels
Main Resistance: 110K – 112K (breakout zone)
Primary Support: 106.7K (bulls’ last stand)
Secondary Support: 103.6K and 102.1K (critical continuation zone)
Bullish Targets: 116K–118K (retest of previous resistance), and up to 126K if momentum expands
Bearish Targets: 103K → 102K → potential breakdown continuation below 100K if selling pressure dominates
---
Bullish Scenario — “Real Breakout or Just Another Trap?”
If the 4H candle closes above 112K with strong volume confirmation:
Buyers regain short-term control.
First target lies around 116K–118K (prior supply zone).
Sustained momentum could lift the price back toward 126K — the previous major high.
However, without volume confirmation, any breakout could turn into a second fake rally, often followed by a sharper decline.
---
Bearish Scenario — “Support Break = Bearish Continuation”
If the price breaks below 106.7K, confirmed by a strong 4H close and rising sell volume:
The breakdown could drive the price toward 103.6K, then 102.1K.
A confirmed close below 102K may trigger panic selling and open a path toward the next psychological zone below 100K.
In this case, the triangle would represent a continuation pattern, not a reversal — signaling further downside.
---
Market Psychology
This chart perfectly reflects a battle of patience between buyers and sellers.
The longer the consolidation lasts, the more energy builds up behind the next move.
Experienced traders know: long consolidations often end with violent breakouts.
---
Strategy & Key Notes
Wait for a confirmed 4H candle close beyond the triangle with strong volume.
Breakouts without volume = traps.
Keep position size small until direction is confirmed.
Enter only after a successful breakout retest to reduce risk exposure.
---
Conclusion
Bitcoin is entering a decisive phase.
A confirmed breakout above 112K could ignite a bullish run toward 116K–126K,
while a breakdown below 106K would confirm that the market is leaning back into a bearish phase.
This isn’t just another triangle — it’s a critical point that will define the medium-term trend for Bitcoin.
---
#Bitcoin #BTCUSDT #CryptoAnalysis #Breakout #TechnicalAnalysis #TrianglePattern #BTC #CryptoTrading #CryptoMarket
