#BTC/USDT Let Bitcoin make a new ATH#BTC
The price is moving within a descending channel on the hourly timeframe. It has reached the lower boundary and is heading towards a breakout, with a retest of the upper boundary expected.
The Relative Strength Index (RSI) is showing a downward trend, approaching the lower boundary, and an upward bounce is anticipated.
There is a key support zone in green at 92445. The price has bounced from this level several times and is expected to bounce again.
The indicator is showing a trend towards consolidation above the 100-period moving average, which we are approaching, supporting the upward move.
Entry Price: 89286
First Target: 90011
Second Target: 91141
Third Target: 92445
Stop Loss: Below the green support zone.
Don't forget one simple thing: Money Management.
For any questions, please leave a comment.
Thank you.
Btcusdtrade

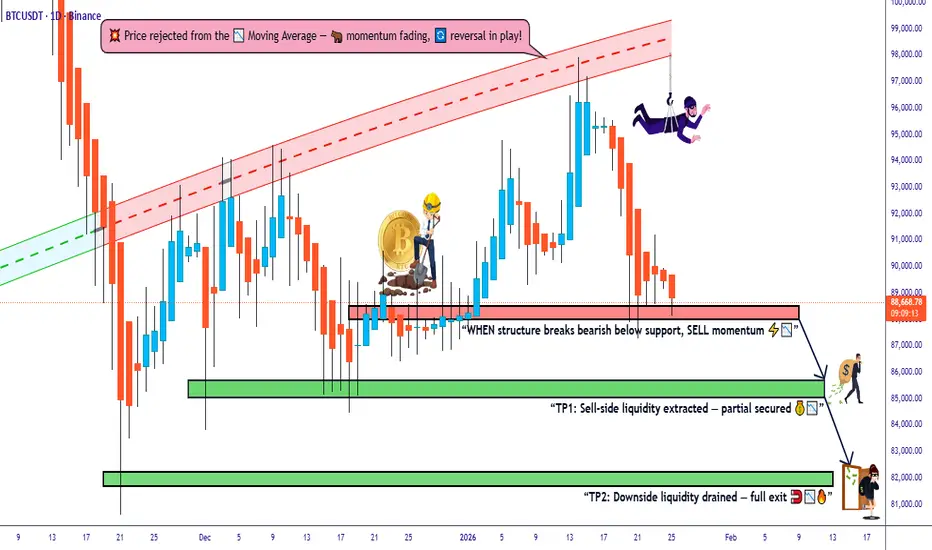
Bitcoin vs Tether: Structure Breakdown Trade Plan📊 BTC/USDT "BITCOIN VS TETHER" CRYPTO MARKET PROFIT PATHWAY SETUP 💰
🎯 TRADE TYPE: Day / Swing Trade - Bearish Bias w/ Bullish Rejection Signals
💡 REAL-TIME MARKET DATA (As of January 25, 2026) ✅
Bitcoin is currently trading around $88,516.85 USD, showing consolidation after recent volatility. BTC/USDT is down approximately 0.40% in the last 24 hours, with the market experiencing what analysts describe as a critical technical squeeze pattern.
🔥 TECHNICAL SETUP BREAKDOWN 🔥
📍 CURRENT PLAN: Bearish trend confirmed with multiple bullish rejection attempts at resistance zones
🎯 ENTRY ZONE: Support level breakout @ $88,000 📉
Pro Tip: Watch for volume confirmation on breakdown before entering position
🎯 TARGET 1: $85,500 (Initial profit-taking zone)
🎯 TARGET 2: $82,000 (Extended bearish target)
🛑 STOP LOSS: $91,000 placed at recent swing high resistance
⚠️ RISK DISCLOSURE ⚠️
Dear Trading OG's & Market Warriors 🏴☠️
These are MY technical levels based on current market structure. This is NOT financial advice! You're the captain of your own ship 🚢
✅ Your money, your rules, your responsibility
✅ Adjust TP/SL according to YOUR risk tolerance
✅ Never risk more than you can afford to lose
✅ Position sizing is KEY to survival in this game
📈 CORRELATED PAIRS TO WATCH 💎
Recent correlation data shows BTC exhibiting strong alignment with major cryptocurrencies, with Solana showing near-perfect correlation at 0.99, Ethereum at 0.89, and XRP at 0.86.
Monitor these pairs for confluence:
🔹 ETH/USDT (Ethereum) - Correlation: 0.89 | Trading ~$3,100
🔹 SOL/USDT (Solana) - Correlation: 0.99 (Almost identical movement!) | ~$175-$180
🔹 XRP/USDT (Ripple) - Correlation: 0.86 | Trading ~$1.89-$2.00
🔹 DOGE/USDT (Dogecoin) - Correlation: 0.87 | Meme power tracking BTC
🔹 ADA/USDT (Cardano) - Correlation: 0.86 | Parallel movement patterns
💡 KEY INSIGHT: The unusually high correlations suggest the market is moving in unison, with broad sentiment overriding individual asset characteristics. When BTC moves, expect these pairs to follow!
📰 FUNDAMENTAL & ECONOMIC FACTORS 🌍
🔴 CRITICAL MACRO EVENTS INFLUENCING THIS TRADE:
1️⃣ Regulatory Landscape Shift 🏛️
Institutional experts highlight that regulatory clarity, particularly the potential passage of the Digital Asset Market Clarity Act, could be a key driver for Bitcoin's recovery path. The CLARITY Act aims to establish the CFTC as the primary regulator for digital commodities and end "regulation by enforcement."
2️⃣ Institutional ETF Flows 💼
Bitcoin spot ETFs accumulated over $1.9 billion in net inflows during the first week of January 2026, showing continued institutional appetite despite price weakness. However, recent patterns show a $1.2 billion inflow followed by a $243 million outflow, typical of tight consolidation phases.
3️⃣ Bollinger Bands Squeeze Alert! 📊
Bitcoin's Bollinger Bands have narrowed to less than $3,500, the tightest compression since July 2025, signaling an imminent major price move in either direction. This technical pattern historically precedes significant volatility explosions.
4️⃣ Market Sentiment Analysis 😰
Current market sentiment shows "extreme fear" conditions, which can actually be a contrarian bullish indicator. Historically, periods of extreme fear have coincided with attractive entry points for long-term investors.
5️⃣ Interest Rate Environment 📉
Potential Federal Reserve rate cuts and a more accommodating monetary policy stance toward crypto could support Bitcoin in 2026, though geopolitical uncertainties and elevated equity valuations create a complex investing environment.
6️⃣ Expert Price Forecasts 🎯
Industry analysts forecast a wide range for Bitcoin in 2026, from lows of $75,000 to highs of $225,000, with major institutions like Standard Chartered and Citi projecting targets between $143,000-$150,000.
7️⃣ Supply-Demand Dynamics ⚖️
Corporate treasuries and sovereign reserves have absorbed Bitcoin's annual production by a factor of 4.7 in 2026, creating a significant supply-demand imbalance that could support long-term price appreciation.
🎲 UPCOMING CATALYSTS TO WATCH 📅
🔸 January FOMC Meeting - Fed policy decisions impacting risk assets
🔸 U.S. Midterm Elections (2026) - Political uncertainty factor
🔸 GENIUS & CLARITY Acts - Legislative developments
🔸 AI Investment Sustainability - Tech sector correlation effects
🔸 Geopolitical Tensions - Safe-haven vs risk-off dynamics
🧠 TECHNICAL CONFLUENCE CHECKLIST ✔️
✅ Multiple bearish rejections at resistance
✅ Support level identified at $88,000
✅ Volume analysis confirming selling pressure
✅ Bollinger Bands squeeze = volatility explosion incoming
✅ RSI positioned neutrally (room to move either direction)
✅ 720-day moving average intact at $86,000 as long-term support
✅ Key resistance cluster at $94,000-$95,000 zone
💪 PROFESSIONAL TRADER MINDSET 💪
Remember:
🎯 Plan your trade, trade your plan
🎯 Risk management > Being right
🎯 Markets reward patience and discipline
🎯 One trade doesn't define your career
🎯 Protect your capital like it's your last dollar
📢 FINAL THOUGHTS 🚀
This setup offers a defined risk-reward opportunity in a market experiencing historically low volatility that typically precedes major price movements. The confluence of technical patterns, institutional flows, and regulatory developments creates an intriguing setup for both day and swing traders.
Trade smart, not emotional! 🧠💎
🔔 LIKE, BOOST & FOLLOW FOR MORE PREMIUM SETUPS! 🔔
💬 DROP YOUR THOUGHTS IN THE COMMENTS! 💬
🚀 LET'S GET THESE GAINS TOGETHER! 🚀
#Bitcoin #BTCUSDT #CryptoTrading #TechnicalAnalysis #DayTrading #SwingTrading #CryptoSignals #TradingView #BTC #Cryptocurrency #PriceAction #SupportAndResistance #TradingStrategy #RiskManagement #BearishSetup #MarketAnalysis #CryptoMarket #BTCAnalysis 📊💰🎯
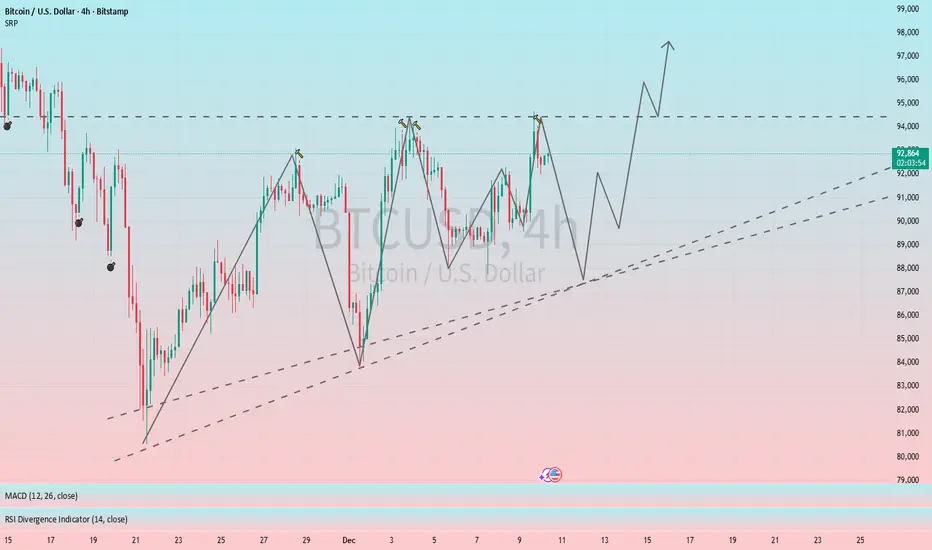
BITCOIN: As Expected Price Is Dropping, Waiting To Come at 60K?Dear Traders,
As anticipated, the price is reversing from $98,000 and may experience a significant drop towards $60,000. The $60,000 area remains strong and attracts swing buyers. Our recommendation is to wait for the price to break through this trading range pattern. A strong breakthrough would indicate a clear price pattern.
If you like our idea, please like and comment for more.
Team SetupsFX_

BTC/USD BEARISH SETUP TECHNICAL CHART ANALYSIS (2H)Key Resistance Zone
95,900 – 97,200
This zone aligns with:
Previous swing high
Supply zone
Upper boundary of the bearish structure
Rejection from this area confirms sellers are active.
Entry Zone
~95,300 – 95,400
Entry is valid after:
Weak bullish candles
Bearish rejection or breakdown from consolidation
This area acts as a retest of broken support.
Stop Loss
Above 97,200
Invalidates the bearish idea if price breaks and holds above resistance.
Targets
Target 1: 93,277
Previous support
Likely reaction zone (partial profit recommended)
Final Target: 91,100 – 91,000
Strong demand zone
Completion of bearish move

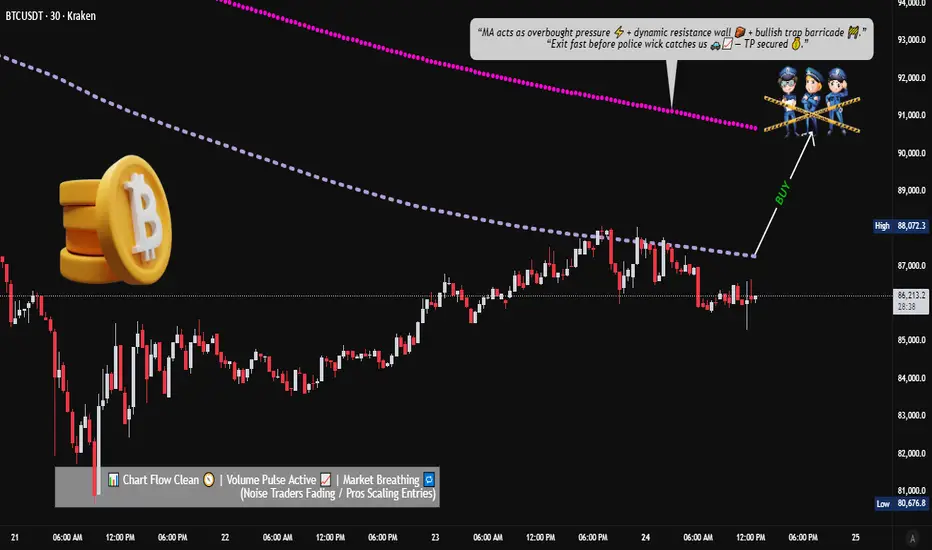
Bitcoin MA Breakout Setup: What Traders Should Watch Now📈 BTC/USDT – “BITCOIN VS TETHER” | Crypto Market Opportunity Blueprint (Day Trade)
🔥 Bullish Breakout Roadmap for Active Day Traders
🧭 PLAN:
Price is attempting a bullish breakout above key moving averages. Once price clears $88,000, momentum buyers may step in and drive a continuation leg upward.
🎯 ENTRY (Breakout Confirmation):
▶ Enter at any price level AFTER a clean moving-average breakout above $88,000.
Look for strong candle closes + volume expansion.
🛑 STOP–LOSS (Risk Management First):
⚠️ This is MY thief-style SL: $84,000
Dear Ladies & Gentlemen (Thief OG’s) — manage your own risk according to your playbook.
This is only my SL, not a rule. You’re free to adjust based on your own risk appetite.
💰 TARGET:
Moving averages align as a dynamic resistance zone, combined with overbought conditions and potential bull-trap signals.
Secure profits responsibly.
▶ Target: $90,800
Again — Dear Ladies & Gentlemen (Thief OG’s), this TP is MY personal level.
Book profits your own way, at your own risk.
🔍 Related Crypto Pairs to Watch (Correlation + Key Notes)
1️⃣ ETH/USDT (Ethereum)
Highly correlated with BTC in bullish phases
Strong ETH movement often front-runs or confirms BTC breakouts
Watch for ETH strength → may add confidence to BTC breakout trades
2️⃣ BTC.D (Bitcoin Dominance)
Rising BTC dominance = Capital flowing into Bitcoin → Supports bullish continuation
Falling dominance = Altcoins gaining share → BTC breakouts may weaken or turn choppy
3️⃣ TOTAL / TOTAL2 (Crypto Market Cap Charts)
Confirms whether capital is entering the entire crypto market
TOTAL rising with BTC strength = broad market confidence
TOTAL flat/dropping during BTC’s rise = possible bull trap
4️⃣ SOL/USDT (Solana)
Solana often moves aggressively when BTC breaks out
Sharp SOL rallies can signal strong risk-on momentum across majors
5️⃣ USDT.D (USDT Dominance)
When USDT dominance drops → Traders moving out of stablecoins → Bullish risk appetite
When it spikes → Smart money hedging → BTC breakout may fail
6️⃣ BTC/USDT Perp Funding Rate
Positive & increasing funding = heavy long side → Potential squeeze
Neutral funding = healthy breakout
Negative funding = breakout might be fueled by short covering
📊 Market Tone:
BTC continues to show strong buyer interest, but resistance pockets remain.
Trade mechanically. Don’t chase candles. Let structure confirm itself.
BTCUSD Stalls After Impulsive Drive: Market in Rebalancing ModeBitcoin is currently pausing after a strong directional move, with price action reflecting consolidation rather than a structural breakdown. Momentum has cooled, volatility is tightening, and the market appears to be recalibrating as participants reassess the next directional phase. This kind of behaviour often signals absorption of recent moves, keeping the broader structure intact while setting the stage for the next expansion.
Disclosure: We are part of Trade Nation's Influencer program and receive a monthly fee for using their TradingView charts in our analysis.

BTC/USD Price Framework Based on Structure and Liquidity🎯 BTC/USD Professional Trading Setup | Bitcoin vs US Dollar Analysis
💰 CRYPTO MARKET PROFIT PATHWAY SETUP (Day/Swing Trade)
📊 ASSET OVERVIEW
Trading Pair: BTC/USD (Bitcoin vs US Dollar)
Market: Cryptocurrency
Trade Type: Day Trading / Swing Trading
Strategy: Thief Layer Entry System (Multiple Limit Orders)
🔥 TRADE PLAN: BULLISH BIAS
🎯 ENTRY STRATEGY - "THIEF LAYERING METHOD"
This strategy utilizes multiple limit orders to capture optimal entry zones. You can enter at ANY price level, but recommended layer entries:
💎 Bull Limit Layer Entries:
Layer 1: $92,000
Layer 2: $93,000
Layer 3: $94,000
Layer 4: $95,000
Note: You can increase/decrease layers based on your risk appetite and capital allocation
🚨 TARGET ZONE - "POLICE FORCE RESISTANCE"
🎯 Primary Target: $105,000
Technical Reasoning:
Simple Moving Average (SMA) acting as strong resistance
Overbought conditions expected at this level
Correlation with traditional market resistance zones
Trap zone for late entries - ideal profit-taking area
⚠️ Disclaimer: Dear Ladies & Gentlemen (Thief OG's), I'm NOT recommending you set ONLY my TP. This is YOUR trade - take profits at YOUR own risk and comfort level! 💪
🛑 STOP LOSS - "THIEF PROTECTION ZONE"
🔒 Stop Loss: $89,000
⚠️ Disclaimer: Dear Ladies & Gentlemen (Thief OG's), I'm NOT recommending you set ONLY my SL. Risk management is PERSONAL - protect your capital at YOUR own discretion! 🛡️
🔗 CORRELATED PAIRS TO WATCH
Monitor these pairs for correlation signals and market confirmation:
ETH/USD (Ethereum) - $3,200-$3,500 range
Key Point: ETH typically follows BTC momentum with 70-80% correlation. Strong ETH moves confirm BTC direction.
SPX/USD (S&P 500) - Watch $5,900-$6,000 levels
Key Point: Risk-on sentiment in equities = bullish crypto flow. Inverse correlation during risk-off.
DXY (US Dollar Index) - Monitor 108-110 range
Key Point: Inverse correlation - Weak dollar = Strong BTC. Dollar strength = BTC pressure.
GOLD/USD (XAU/USD) - $2,650-$2,700 zone
Key Point: Both are "alternative assets" - Gold strength indicates inflation hedge demand, bullish for BTC.
NDX/USD (NASDAQ 100) - Tech correlation
Key Point: BTC trades like a risk asset - Strong NASDAQ = Bullish crypto sentiment.
📰 FUNDAMENTAL & ECONOMIC FACTORS
🌍 CURRENT ECONOMIC LANDSCAPE (Real-Time Considerations)
🔴 Key Factors Influencing BTC/USD:
🏦 Federal Reserve Policy
Current Fed stance on interest rates (January 2026)
Monetary policy direction impacts risk assets
Watch FOMC meeting minutes and statements
📊 Inflation Data (CPI/PPI)
High inflation = BTC bullish (inflation hedge narrative)
Low inflation = Possible risk-off, pressure on crypto
Next CPI release dates are critical
💵 US Dollar Strength (DXY)
Strong dollar = Bearish for BTC (inverse correlation)
Weak dollar = Bullish for BTC
Current DXY trending near multi-month highs/lows
🏛️ Regulatory Environment
SEC crypto regulation developments
Bitcoin ETF flows and institutional adoption
Global crypto legislation updates
⚡ Bitcoin-Specific Fundamentals
Hash rate and network security
Exchange inflows/outflows (whale movements)
Mining difficulty adjustments
Institutional accumulation patterns
📅 UPCOMING NEWS EVENTS TO WATCH
US Economic Data: GDP, Employment reports, Retail sales
Fed Speeches: Any commentary from Powell or voting members
Crypto Regulations: SEC announcements, ETF decisions
Global Risk Events: Geopolitical tensions affecting risk appetite
Tech Earnings: Major tech companies (correlate with BTC sentiment)
⚡ TECHNICAL CONFLUENCE
✅ Bullish Indicators:
Layer entry zones align with demand areas
SMA resistance provides clear target structure
Risk/Reward ratio favorable with defined SL/TP
⚠️ Risk Considerations:
Overbought conditions at target zone
Potential trap for late entries above $105K
Macro economic headwinds could shift sentiment
💡 THIEF OG'S PHILOSOPHY
🎯 "Make Money, Take Money, Manage Risk"
This isn't financial advice - it's a technical framework for disciplined traders. Your capital, your rules, your responsibility!
🚀 Trade smart, layer entries, respect the plan, and let the market pay you!
🔔 ENGAGEMENT CALL
👍 Like if this setup resonates!
💬 Comment your entry layers and targets!
🔄 Share with fellow Thief OG's!
⭐ Follow for more professional crypto setups!
📈 Good luck, Thief OG's! May the profits be with you! 💎🙌

XRP/USDT | Bullish Breakout + Structure Holding📈 XRP/USDT — Bullish Breakout Pathway Activated!
RIPPLE vs TETHER | Crypto Market Trade Opportunity (Day / Swing)
🔍 Market Overview
XRP/USDT is showing strong bullish intent after a confirmed moving average breakout followed by a healthy retest. Price structure remains constructive, suggesting momentum continuation if buyers maintain control above key zones.
This setup is designed for both Day Traders & Swing Traders, with a layered entry strategy for risk-controlled positioning.
🧭 Trade Plan – Bullish Bias
✅ Trend Direction: Bullish
✅ Confirmation: Moving Average Breakout + Retest
✅ Momentum: Buyers defending structure with volume stability
🎯 Entry Strategy (Layered Execution)
📌 Entry Type: Flexible / Any price level entry using Layering Method
Thief Layer Strategy (Bullish Limit Zones):
🟢 Buy Limit 1: 2.0500
🟢 Buy Limit 2: 2.1000
🟢 Buy Limit 3: 2.1500
➡️ Traders may add or adjust layers based on personal risk management and timeframe.
This approach helps average entries efficiently during pullbacks while aligning with the higher-timeframe trend.
🏁 Target Zone
🎯 Primary Target: 2.4000
📊 Rationale:
Moving Average acting as dynamic resistance (Police Force Zone)
Market currently showing overbought behavior near resistance
Possible liquidity trap & correlation pressure expected near highs
💡 Action: Partial profits recommended near resistance zones to protect gains.
🛑 Stop Loss (Risk Control)
🔴 Stop Loss: 2.0000
⚠️ This SL is based on structure invalidation, not emotion.
Each trader may customize SL placement according to account size and risk tolerance.
📌 Risk Disclaimer
Dear Ladies & Gentlemen,
This trade plan is not financial advice.
You are free to secure profits or manage risk according to your own strategy and discipline.
🔗 Related Pairs to Watch (Correlation Insight)
Monitoring correlated assets helps confirm strength or weakness in XRP:
COINBASE:XRPUSD 💵 – Dollar-based momentum confirmation
BINANCE:BTCUSDT 🟠 – Overall crypto market direction & risk sentiment
BINANCE:ETHUSDT 🔷 – Altcoin flow & capital rotation signal
CRYPTOCAP:USDT.D 📉 – Tether dominance (falling dominance = bullish for alts)
📌 Key Insight:
If BTC & ETH remain stable or bullish, XRP continuation probability increases.
Rising USDT dominance may signal temporary risk-off behavior.
🌍 Fundamental & Economic Factors to Monitor
📰 Crypto-Specific Drivers
Ripple ecosystem updates & adoption news
Regulatory clarity surrounding XRP
On-chain volume & wallet activity trends
🌐 Macro & Economic Factors (Global)
U.S. Dollar strength (DXY impact on crypto liquidity)
Central bank tone (risk-on vs risk-off sentiment)
Crypto ETF flows & institutional participation
📆 High-Impact Events to Watch
Major U.S. macroeconomic releases
Central bank statements affecting risk assets
Sudden volatility in BTC dominance
📌 Pro Tip: Always check economic calendars & crypto news feeds before entry or scaling.
⭐ Final Note
This setup combines technical structure, layered execution, correlation analysis, and macro awareness — built for disciplined traders who respect both profit and protection.
👍 If this idea adds value, boost with a like
💬 Share your execution thoughts in comments
🔔 Follow for more structured market pathways
Trade smart. Manage risk. Let structure lead. 🚀

BTCUSD I Potential Accumulation BreakoutWelcome back! Let me know your thoughts in the comments!
** BTCUSD Analysis - Listen to video!
We recommend that you keep this on your watch list and enter when the entry criteria of your strategy is met.
Please support this idea with a LIKE and COMMENT if you find it useful and Click "Follow" on our profile if you'd like these trade ideas delivered straight to your email in the future.
Thanks for your continued support!

Bitcoin Aligns With Bullish Trend Metrics — What’s Next?🚀 BTC/USD — Bitcoin vs Tether | Bullish Profit Pathway (Day/Swing) 📈
Asset: BTCUSD — Bitcoin vs Tether (Realtime live price feed) 📊
✅ Bullish Setup Confirmed
Bullish trend confirmed with Hull Moving Average breakout — structure shift on higher timeframes. Momentum signals showing accumulation near support zones. 🟢
🎯 Trading Plan — Entry (Layer Strategy)
Thief strategy: A layered limit entry style method (multi-limit entries):
✅ Layer 1: ~93,000
✅ Layer 2: ~94,000
✅ Layer 3: ~95,000
➡️ Add additional layers as per your risk profile and real-time order flow.
Why layering? Better average price, less slippage, more control over drawdowns.
📌 Target & Notes
🔹 Primary Target: ~99,000 — key resistance & overbought trap zone 🛑
🔹 Monitor reaction at overhead supply / previous swing highs.
🔹 Lock partial profits into reaction zones — don’t be greedy, protect capital.
🔹 Important: You choose your own TP & RR (risk/reward) depending on your play style.
🛑 Stop Loss
💥 Thief SL Zone: ~92,000
➡️ This is a structural invalidation level for this bullish scenario.
✅ Adjust based on your risk tolerance — your risk, your money.
🔗 Pairs to Watch & Correlations 🔎
📌 ETH/USD (Ethereum) — often correlated with BTC swings — if ETH breaks key structure, BTC bias can extend.
📌 BTC/USDT & BTC/EUR — cross-pairs reveal strength vs USD/dollar index behaviour.
📌 S&P 500 / NASDAQ Indexes — crypto sentiment often mirrors risk asset flows.
📊 Technical Levels / Key Zones
✔ Support Range: 90,000–92,500 — critical accumulation band. 📉
✔ Resistance — watch reactions near 99,000+ and breakout extension zones.
✔ EMAs / MACD / RSI — confirm entry and momentum continuation. 📈
📊 Fundamental & Macro Factors — Real-Time News (London Time)
📰 Inflation & CPI Impact: BTC rallied through ~$92k after U.S. CPI inflation held lower, sparking renewed Fed rate-cut expectations — supportive for risk assets like Bitcoin.
📰 Safe-Haven Demand: Softer US inflation + geopolitical tensions are boosting Bitcoin demand near $95k.
📰 Institutional Demand: ETF inflows & broader institutional traction continue to underpin structural support.
📌 Upcoming Watchlist:
👉 FOMC / Fed rate announcements — major macro driver.
👉 U.S. CPI / PPI releases.
👉 Dollar Index (DXY) movement — inversely influences BTC sentiment.
👉 ETF flow reports & regulatory headlines.
📌 Risk Management Reminder
⚠️ This idea is educational — do your own analysis (DYOR). Manage position sizing and risk per your plan.
📌 Discipline > Emotion. Keep a trading journal.
🙌 Happy trading Thief OG’s — let the charts speak. 💎

BTCUSDT: Volatility Contraction Leads to Expansion - LVRB BreakoWe have broken out of a consolidation range (the "quiet" period), triggering a confirmed LONG signal.
On the BTCUSDT 2-hour chart, the LVRB (Low Volatility Range Breakout) indicator identified a volatility squeeze (Box) and has successfully broken above its resistance.
I view this current setup as a critical pivot point where the market transitions from Volatility Compression to Expansion.
⚡️ 1. The Logic: Why This Matters
Markets move in cycles based on a universal principle: "Periods of low volatility are often followed by periods of high volatility."
Box (Accumulation): The True Range (TR) narrows significantly as the market stores energy ("The Silence").
Breakout (Release): That stored energy is released rapidly. We have confirmed a release to the upside .
---
⚡️ 2. Technical Analysis & Track Record
Between Jan 10 and Jan 11, price action was compressed into a tight range of $90,200 - $91,000 (the LVRB Box). Today (Jan 12), we saw a clear breakout. A candle close outside the box has confirmed theLONG entry signal.
The indicator has been accurately tracking the recent short-term trend direction:
Jan 3 | LONG | ✅ $89,500 → $94,500 (Up) |
Jan 5 | LONG | ✅ $91,500 → $94,500 (Up) |
Jan 8 | SHORT | ✅ $91,000 → $90,000 (Down) |
Current | LONG | ⏳ Active / In Progress |
---
⚡️ 3. Trade Plan (The Setup)
Here is my actionable plan based on this breakout.
We follow the momentum of the breakout to capture trend continuation.
Entry: Around $91,700 (Current Price) or on a retest of the box upper limit.
Take Profit (TP):
Target 1 : $93,500 (Recent swing high)
Target 2: $94,500 (Jan 6th High / Key Resistance)
Stop Loss (SL): $90,000 (Below the Box Low)
This setup offers a ratio of approximately 1:1.6 (TP1) to 1:1.9 (TP2).
⚡️ 4. The Tool: What is LVRB?
The LVRB (Low Volatility Range Breakout) is a custom tool I developed, specifically optimized for the BTCUSDT 2H chart.
How it works: It analyzes ATR and candle body size to automatically draw boxes around periods where price action is "dead" (accumulating energy).
Signals: It detects confirmed breakouts (via Close or Wick) to generate clear LONG/SHORT alerts, helping traders avoid chop and catch the start of a move.
⚡️ Conclusion
Trading breakouts from low volatility is one of the most effective ways to catch the start of a new trend.
The current LONG signal suggests a move toward $93,500 - $94,500, provided we hold above the $90,000 invalidation level.
Disclaimer : This analysis is for educational purposes only and does not constitute financial advice. Trading involves risk; please trade responsibly.

Bitcoin (BTC/USD) – Rising Wedge Breakdown Setup 3H TimeframeRising Wedge
Upper trendline: Acting as resistance
Lower trendline: Rising support
Price is now near the upper boundary, where rejection is common.
This structure typically resolves to the downside, especially after a strong uptrend.
Key Levels
Resistance
92,800 – 93,200 → wedge resistance + recent highs (entry zone marked)
94,500 – 95,000 → major rejection zone if price spikes higher
Support / Targets
1st Target: ~89,000
Previous structure support
Psychological level
Final Target: ~86,500 – 87,000
Strong horizontal demand
Prior consolidation base

BTCUSD | 4H | Supply → Demand Reaction | Potential Bounce SetupBitcoin is currently trading inside a clear range structure on the 4H timeframe.
🔴 Supply Zone (Resistance):
Price previously reacted strongly from the 93,500 – 94,500 area, confirming this zone as strong selling pressure. Multiple rejections show smart money distribution here.
🟢 Demand Zone (Support):
Price has now pulled back into the 89,800 – 90,300 demand zone, where buyers previously stepped in aggressively. This zone aligns with prior consolidation and wick rejections, indicating hidden buying interest.
📉 Market Structure:
Short-term bearish pullback
Overall structure still corrective, not broken
No strong lower low below demand yet → bullish potential remains valid
📌 Trade Expectation:
As long as price holds above the demand zone, we can expect a bullish reaction and a move back toward higher levels.
🎯 Targets:
First target: 91,800 – 92,200
Main target: 93,500 – 94,000 (Supply zone retest)
❌ Invalidation:
A clean 4H close below 89,700 would invalidate the bullish idea and suggest further downside.
📊 Bias:
Bullish reaction from demand → continuation toward supply
Patience is key. Let price confirm with strong bullish candles or volume expansion before entry.
⚠️ Risk Management:
Always wait for confirmation and manage risk properly. This is not financial advice.

$BTC/USDT ANALYSISOn the 8-hour MEXC:BTCUSDT chart, price shows a clear rejection from the higher-timeframe supply zone around the mid-94k area, confirming that strong sell orders are still active there, and the subsequent decline has brought price back into the prior breakout region near 89–90k, which is now acting as a critical decision zone; structurally, the market is trading within a rising base but momentum has weakened, indicating distribution rather than aggressive accumulation, and the current consolidation below resistance reflects compression after rejection rather than strength, meaning as long as price remains below the major supply and fails to reclaim it, downside risk remains elevated, while only sustained acceptance and holding above the 89–90k support would shift the bias back toward continuation higher.

BTCUSD Stabilises After Volatile Swing as Market Rebuilds StructBitcoin is showing signs of short-term stabilisation following a sharp move, with price action beginning to reorganise on the 4H timeframe. The recent volatility has been absorbed, and the market now appears to be transitioning into a phase of reassessment rather than continuation in a straight line. Momentum remains active, but participation looks more selective as traders wait for clearer confirmation of the next directional phase. This period of consolidation is often where the next meaningful expansion starts to take shape.
Disclosure: We are part of Trade Nation's Influencer program and receive a monthly fee for using their TradingView charts in our analysis.

$BTC/USDT ANALYSISOn the 8-hour BTC/USDT chart, price remains compressed inside a falling wedge structure and is still trading below the descending resistance trendline. The overall market structure is corrective, with lower highs being respected, while buyers are defending the lower boundary of the pattern. The 50-period moving average is positioned above current price and is acting as dynamic resistance, repeatedly capping upside attempts. Momentum is neutral to slightly bearish as long as price stays below both the wedge resistance and the 50MA, which keeps the market in a consolidation phase rather than a clear trend. A decisive break and sustained hold above these resistance levels would shift structure toward bullish continuation; otherwise, price is likely to keep ranging within the wedge with volatility remaining compressed.

BTCUSD: Holding Wave X or Slipping Lower?24 Nov 2025
27 Nov 2025
1 Dec 2025
17 Dec 2025
Bitcoin is still trading inside a falling channel, and the overall structure remains corrective. The recent bounce from lower levels lacks momentum and is overlapping, which signals consolidation rather than a trend reversal. Price continues to respect channel resistance, keeping the broader bias weak.
Wave X is acting as an important support zone around 83,822 , and as long as price holds above this level, further consolidation remains possible. This area is currently absorbing selling pressure and preventing immediate continuation to the downside.
However, a decisive breakdown below Wave X would signal that the correction is not complete. In that scenario, downside momentum is likely to expand, opening the path toward the 79,650 - 75,655 zone.
Stay Tuned
@Money_Dictators
RD :)

$BTC/USDT LONG IDEA – 3-DAYBitcoin is currently trading inside a strong **higher-timeframe support and reversal zone around $80,000–$82,000**, which also aligns closely with the **200 EMA** on the 3-day chart. This area has acted as a major demand zone in the past, and price is now showing stabilization after a sharp sell-off. As long as BTC holds above this zone, the structure supports a **bounce-based long setup** rather than continuation to the downside.
We are planning a **long position near the support zone**, expecting buyers to defend this level. The **stop loss** should be placed **below $79,900**, as a clean break below this level would invalidate the support and open the path toward the $74,500 area. For the upside, the **final target** is set at **$92,000–$94,000**, which is the nearest major resistance and previous supply zone on the higher timeframe. This setup offers a **clean structure-based long** with clear invalidation and a favorable risk-to-reward if support holds.
**Trade Summary (for TradingView):**
• Direction: **LONG**
• Entry Zone: **$83,000 – $85,000**
• Stop Loss: **$79,900**
• Final Target: **$92,000 – $94,000**
• Bias: **HTF support + 200 EMA bounce**

BTC/USDT Setup Confirmed – Capital Flow Points to Upside!🚀 BITCOIN (BTC/USDT) Capital Flow Blueprint: Smart Pullback + Liquidity Grab Strategy
📊 Setup Overview
Asset: BTC/USDT | Strategy: Swing Trade | Bias: Bullish with Pullback Confirmation
🎯 Trading Plan Thesis
Bullish structure confirmed with Volume-Weighted Moving Average (VWMA) Pullback + Liquidity Zone Grab. Bitcoin continues to accumulate at demand zones while respecting higher timeframe resistance. This layered entry strategy captures value during temporary pullbacks before the next impulse.
Current Market Context: BTC trading near $109,768 (as of November 1, 2025)
📍 Entry Strategy: Multi-Tier Limit Orders (Layering Method)
Think of this as smart accumulation zones rather than one aggressive entry:
Layer 1: $106,000-107,000 (Deep pullback target)
Layer 2: $107,500-108,000 (Mid-level support)
Layer 3: $108,500-109,000 (Current support zone)
Ratio: Scale position size across layers (30%-40%-30% allocation suggested). This approach reduces timing risk and averages your entry price during volatility.
🛑 Stop Loss: Risk Management First
SL Level: $105,000
Rationale: Sits below the 4-hour swing low, providing buffer for wick rejection while maintaining favorable risk-reward ratio
⚠️ Risk Disclaimer: Stop loss placement is YOUR decision based on your account size and risk tolerance. Never risk more than 2% of your trading capital per trade.
📈 Take Profit: Multi-Exit Strategy
Target: $119,000
Confirmation: ATR (Average True Range) acting as resistance + Overbought RSI confluence + Previous resistance break
Exit Plan:
Partial 1 (50%): $115,000 (Take some profits early)
Partial 2 (30%): $117,000 (Lock in most gains)
Final (20%): $119,000 (Let runners chase the moon 🌙)
⚠️ Risk Disclaimer: Profit targets are based on technical analysis. Market conditions change. Take profits at levels that suit YOUR strategy and risk profile.
🔗 Correlated Pairs to Monitor (Market Ecosystem Check)
Direct Correlation Pairs:
ETH/USD ($3,865): Major altcoin bellwether. Watch 1-4 hour RSI divergence
BNB/USD (~615): Binance ecosystem health indicator
SOL/USD (~245): Alt season strength confirmation
Inverse Watch:
USDT Dominance: If BTC dominance drops >59%, profit-taking likely incoming
VIX Index: Higher volatility = more chop (avoid during spikes)
💡 Key Technical Points
✅ Volume Profile: Sellers exhausted at $105K-106K zone
✅ Order Flow: Institutional absorption at weekly support
✅ Micro Resistance: $112,000-113,500 (breakout confirmation needed)
✅ Macroeconomic: Fed sentiment + Bitcoin ETF flows = liquidity tailwind
⚡ Pro Tips for Better Execution
Timeframe: Confirm entry on 4-hour chart before scaling on 1-hour bounces
Volume Filter: Only take Layer 1/2 if volume > 20-day average
News Calendar: Avoid entries 2 hours before major economic data
Trail Stop: Move stop to breakeven once price hits Layer 3 + $1,000
🎁 Community Love
✨ "If you find value in my analysis, a 👍 and 🚀 boost is much appreciated — it helps me share more setups with the community!"
#Bitcoin #BTC #CryptoTrading #SwingTrade #TechnicalAnalysis #LiquidityGrab #VWMA #CryptoChart #TradingStrategy #CryptoSignals #LayeringStrategy #BTCUSD #CryptoAnalysis #TraderLife #AlgoTrading

BTC/USD Liquidity Blueprint – Are You Reading the Flow Right?🎯 BTC/USD: The Great Heist Setup | Swing Trade Blueprint 💰
📊 Market Overview
Asset: BTC/USD (BITCOIN/US DOLLAR)
Market: Cryptocurrency
Trade Type: Swing Trade
Strategy Style: The Thief Method™ (Layered Entry System)
🎨 Technical Setup
📈 Market Structure: BULLISH CONFIRMED
The Simple Moving Average is showing strong accumulation patterns with a healthy pullback structure. Bulls are loading up their bags like thieves preparing for the ultimate vault heist! 🏃♂️💨
Key Technical Indicators:
✅ SMA showing strong bullish accumulation
✅ Pullback phase completed
✅ Higher lows formation intact
✅ Volume supporting upside momentum
🎯 The Heist Plan: Entry Strategy
💎 The Thief Layered Entry System
Instead of going all-in at one price (that's how amateurs get caught! 👮), we're using a professional layered approach with multiple buy limit orders:
Entry Layers:
🔹 Layer 1: $108,000
🔹 Layer 2: $109,000
🔹 Layer 3: $110,000
🔹 Layer 4: $111,000
🔹 Layer 5: $112,000
💡 Pro Tip: You can add more layers or adjust based on your bag size and risk appetite. The beauty of this strategy? You average into position like a pro! 🎭
🛡️ Risk Management
⛔ Stop Loss: $106,000
⚠️ Important Note: Dear Thief OG's (Ladies & Gentlemen),
This is MY stop loss based on MY risk tolerance. You're the captain of your own ship! 🚢 Set your SL according to YOUR risk management rules. Remember: Take profits at your own risk, protect capital like it's your treasure!
🎯 Target Zone: The Great Escape
🚨 Target: $124,000
Why this target?
The "Police Barricade" (strong resistance zone) sits right here with multiple confluence factors:
🔴 Major resistance level
🔴 Overbought conditions expected
🔴 Bull trap zone activated
🔴 Historical rejection area
🏃♂️ Exit Strategy: When we hit this zone, it's time to take your loot and run! Don't get greedy and caught in the trap!
⚠️ Important Note: Dear Thief OG's (Ladies & Gentlemen),
This is MY take profit target. You're free to take profits whenever YOU feel comfortable. Your money, your rules, your timeline! 💰
🔗 Correlated Pairs to Watch
Keep your eyes on these related assets for confirmation:
💱 Major Correlations:
BITSTAMP:ETHUSD - Typically follows BTC momentum; watch for similar accumulation
BINANCE:BTCUSDT - Alternative pairing for liquidity confirmation
TVC:DXY (US Dollar Index) - Inverse correlation; weakness in DXY = strength in BTC
$SPX/SPY (S&P 500) - Risk-on sentiment indicator
GOLD ( OANDA:XAUUSD ) - Alternative store of value; competitive correlation
📍 Key Correlation Points:
When DXY weakens, crypto typically strengthens
Traditional market risk-on flows support Bitcoin upside
ETH/BTC ratio helps confirm alt-season vs BTC dominance
Gold movements indicate macro hedging flows
⚙️ Why The Thief Strategy Works
✨ Dollar-Cost Averaging (DCA) on steroids
✨ Reduces emotional decision-making
✨ Better average entry price
✨ Lower risk per order
✨ Professional money management
Think like a thief planning the perfect heist: multiple entry points, calculated risks, clear escape route! 🎭
🎬 Final Thoughts
This isn't financial advice—it's a strategic blueprint for those who trade with discipline and style! The market is our playground, but only the smart thieves get to keep their loot. 🏆
Remember:
📊 Stick to your plan
🎯 Manage your risk
💰 Take profits systematically
🧠 Trade with logic, not emotion
🎭 Execute like a professional
📣 Support This Analysis
✨ If you find value in my analysis, a 👍 and 🚀 boost is much appreciated — it helps me share more setups with the community!
#Bitcoin #BTCUSD #CryptoTrading #SwingTrade #TradingStrategy #TechnicalAnalysis #CryptoAnalysis #BTC #LayeredEntry #RiskManagement #ThiefStrategy #CryptoSignals #BitcoinAnalysis #PriceAction #TradingSetup #CryptoTA #BTCSetup #SwingTrading
🎯 Stay sharp, trade smart, and may the profits be with you! 🚀

Ascending triangle formation indicates a bullish outlook for BTC#BTCUSD BITSTAMP:BTCUSD BINANCE:BTCUSDT
From the 4H chart, BTC's short-term trend has formed an ascending triangle pattern, which is a typical bullish pattern. Short-term resistance is located at 93500-94500, a break above this level would likely lead to further gains. The key support level to watch is 88000-87500. If the price retraces to this range, we can consider going long on BTC.
ElDoradoFx PREMIUM 3.0 – BTCUSD PRO ANALYSIS (07/12/2025)1. Market Overview
BTC is trading inside a contracting corrective structure after rejecting the 89,750–89,850 supply zone. Price failed to sustain above the intraday EMAs and shifted momentum bearish. Liquidity remains heavy below current price, and MACD shows continued bearish pressure across short- and mid-timeframes. Weekend conditions favour engineered sweeps into deeper demand before any strong reversal attempt.
⸻
2. Technical Breakdown
🔹 Daily (D1)
• BTC remains in a broader retracement phase after major rejections at 97,400 and 104,000.
• EMAs overhead continue acting as dynamic resistance.
• Short-term relief rallies lack follow-through; price is at risk of retesting 88,000–87,500.
• Momentum is flattening but still bearish (MACD increasing negative histogram).
🔹 H1
• Strong rejection at 89,750 followed by BOS to the downside.
• Price now trades under both 50/200 EMAs, retesting them as resistance.
• Trendline support from prior swing low is being tested.
• Demand pockets: 89,350 → 89,200 → 89,000 → 88,800 (PDL).
• Structure remains bearish unless 89,750 is reclaimed with conviction.
🔹 15M–5M
• Clear lower-high sequence with repeated CHoCH → BOS confirmations.
• Sellers defended the supply zone aggressively.
• MACD flipped short with strong follow-through; RSI mid-range but with bearish slope.
• Liquidity clusters align below: 89,200, 89,000, 88,800 → highly attractive for engineered sweeps.
⸻
3. Fibonacci Analysis (Golden Zone)
Swing: 88,899 → 89,750
• 38.2% = 89,450
• 50% = 89,325
• 61.8% = 89,200
🎯 Golden Zone: 89,450 – 89,200
This aligns perfectly with intraday demand and previous liquidity builds.
⸻
4. High-Probability Trade Scenarios
📈 BUY Scenario (Countertrend Only)
Buy Zone:
• 89,200 – 89,000 – 88,800 (PDL sweep preferred)
Targets:
• 89,350 → 89,500 → 89,750
Stop-Loss: below 88,700
Confirmation Needed:
• Wick rejection at demand
• MACD re-flip long
• 5M BOS to confirm reversal structure
⚠️ Note: This is a counter-trend setup.
⸻
📈 BUY Breakout Scenario
Trigger: Break & hold above 89,750
Retest: 89,600–89,650 holding as support
Targets:
• 90,050 (PDH) → 90,300 → 90,750
Stop-Loss: 89,200
⸻
📉 SELL Scenario (Primary Setup)
Sell Zone:
• 89,600 – 89,750 (major supply zone)
Targets:
• 89,350 → 89,200 → 89,000 → 88,800 (PDL)
Stop-Loss: 89,900
Why this is preferred:
• Strong momentum confluence
• EMA rejection
• Multiple CHoCH/BOS confirming bearish control
⸻
📉 SELL Breakout Scenario
Trigger: Break below 89,000
Retest Fail Zone: 89,050–89,100
Targets:
• 88,800 → 88,400 → 88,000
Stop-Loss: 89,350
⸻
5. Fundamental Watch
• Weekend trading = algorithmic liquidity hunts, low-volume manipulations.
• No major fundamentals expected; movement will be structure-driven.
• Liquidity below is highly attractive; expect volatility near 89,200 / 89,000.
⸻
6. Key Technical Levels
Resistance:
• 89,600 / 89,750 / 90,050 / 90,300
Support:
• 89,350 / 89,200 / 89,000 / 88,800
Breakout Buy Trigger: > 89,750
Breakout Sell Trigger: < 89,000
⸻
7. Analyst Summary
BTC sentiment remains short-term bearish with strong structural, momentum, and EMA confluence. The sell zone at 89,600–89,750 remains the primary area of interest. First key liquidity target sits at 89,200, with deeper sweeps into 89,000–88,800 likely if momentum persists.
Countertrend longs only activate after confirmation at those deeper zones.
⸻
8. Final Bias Summary
Primary Bias: Bearish below 89,750
Bullish Only If: Price reclaims and holds above 89,750
Key Decision Zone: 89,200–89,000
⸻
🥇 ElDoradoFx PREMIUM 3.0 – PERFORMANCE 05/12/2025 🥇
⚡ Smart Entries. Consistent Wins.
📈 BUY +570 PIPS (From 04/12)
📈 BUY +500 PIPS (From 04/12)
📈 BUY +40 PIPS
🟥 SELL -55 PIPS (SL)
📈 BUY +120 PIPS
📈 BUY +210 PIPS
📈 BUY +20 PIPS
🟥 BUY -40 PIPS (SL)
📈 BUY +20 PIPS
📉 SELL +60 PIPS
━━━━━━━━━━━━━━━
💎 SWING TRADES – STILL RUNNING
🔵 BUY → +3,005 PIPS
🟣 BUY → +2,260 PIPS
🟢 BUY → +1,390 PIPS
📊 Long-term swing positions continue to dominate, while intraday precision adds consistent controlled gains.
━━━━━━━━━━━━━━━
💰 TOTAL PIPS GAIN: +1,445 PIPS
🎯 8 Wins · 2 SL
🔥 80% Accuracy
━━━━━━━━━━━━━━━
✅ A powerful close to the week — strong swings + clean intraday setups delivering exceptional profit.
— ElDoradoFx PREMIUM 3.0 Team 🚀

BTC Wave 4 Bounce Looks Like a Trap! Is it?BTC is still moving inside a clear corrective channel, with the current bounce likely forming wave 4 before one final drop toward the 1.618 extension near 79,650 . The highlighted red zone shows a potential trap area where price may lure traders into thinking a reversal has started. Until BTC breaks above the channel convincingly, the broader structure still favors a wave 5 decline. The wave count from 1–2–3 supports this final leg down before any major recovery.
Stay Tuned!
@Money_Dictators
