BTCUSDBTCUSD has dropped heavily last week and could be potentially completing triangle for another push to start very soon.
Disclosure: We are part of Trade Nation's Influencer program and receive a monthly fee for using their TradingView charts in our analysis.
Btcusdtrade

ElDoradoFx PREMIUM 2.0 – WEEKEND BTCUSD ANALYSISBTC is trading around 111,600, recovering after last week’s sharp correction from 126,000.
Price is forming higher lows from 109,500, suggesting a short-term bullish correction while overall structure remains bearish.
⸻
🔍 Technical Outlook
Daily Structure (1D):
BTC is holding above the 200 EMA / major demand zone (107,700–108,800).
Momentum indicators (MACD + RSI) show early recovery — buyers stepping in after the deep retracement.
Trend is still bearish, but a clean push above 112,500–113,000 would confirm a short-term CHoCH bullish shift.
The Fibonacci retracement (126,000 → 107,200) marks the Golden Zone at 116,600–118,400, still the ideal swing-sell region.
Intraday (1H + 15M + 5M):
Charts show a clear bullish order block (OB) around 110,200–111,000 and a bearish OB above 112,800–113,200.
Fair Value Gaps (FVGs) remain unfilled near 112,400–113,000, likely short-term targets.
Market structure: forming Higher Lows (HLs) with momentum building on the MACD and RSI across lower timeframes.
Short-term bias: bullish correction until resistance confirms rejection.
⸻
📌 Breakout Levels to Continue Trend
Bullish continuation:
• Break above 111,800, retest 111,400–111,600 → upside path 112,400 → 113,200 → 114,000
• If price continues, next resistance aligns at 116,600–118,400 (Golden Zone)
Bearish continuation:
• Break below 110,200, retest 110,400–110,600 → downside path 109,200 → 108,000 → 106,800
• Clean close below 108,800 confirms daily bearish trend resumption
⸻
📅 Fundamental Watch
No major weekend data.
Sunday CME gap (109k–111k) could attract liquidity before Monday’s open.
Upcoming U.S. CPI next week will define the next strong directional move in BTC and risk assets.
⸻
⚠ Key Levels to Monitor
Resistance zones:
111,800 / 112,400 / 113,200 / 116,600 / 118,400
Support zones:
110,200 / 109,200 / 108,000 / 107,700 / 106,800
⸻
✅ Summary
BTC is consolidating inside a bullish order block, with momentum building toward 112.8k–113.2k, where a major bearish OB + FVG confluence exists.
A break and retest above 111,800 could extend the recovery to 113k–114k, while failure below 110,200 would reopen the path to 108k–106.8k.
Main trend remains bearish, but short-term correction likely continues before sellers regain control near the Golden Zone (116.6k–118.4k).
— ElDoradoFx PREMIUM 2.0 Team

ElDoradoFx PREMIUM 2.0 – Weekend BTCUSD AnalysisBTC is trading around 110,200, after a sharp 12,000-pip correction from the recent 126,000 high.
This week’s movement confirms a bearish structure shift, driven by heavy liquidation and macro profit-taking after the extended bull leg.
⸻
🔍 Technical Outlook
📅 Daily Structure (1D):
• BTC broke below the 115,000 key support and is now testing the ascending trendline support near 108,800–107,700 (the previous swing-low region).
• The daily candle shows a long lower wick, signaling potential demand re-entry, but momentum remains weak.
• The 200-EMA (yellow) around 107,700 is critical — a close below would confirm a mid-term bearish reversal.
• MACD shows a strong bearish crossover with fading histogram strength, indicating decelerating bearish pressure.
• RSI has cooled to the 35–38 zone, approaching oversold — supporting a possible short-term rebound.
🎯 Fibonacci Golden Zone:
The retracement from the swing low (107,200) to the previous swing high (126,000) places the Fibonacci Golden Zone (61.8%–50%) between 112,000–114,500.
This zone will likely act as the first major resistance on any pullback.
If price retests this area and rejects, it offers a high-probability short continuation opportunity.
⸻
📈 Intraday Structure (1H + 15M + 5M):
• 1H structure remains bearish, with continuous Breaks of Structure (BOS) toward new lower lows.
• Short-term consolidation is forming around 110,000–110,500, right above the daily support zone.
• 15M and 5M charts show small bullish divergences on RSI and MACD, suggesting a possible technical bounce before continuation.
• 50EMA and 100EMA on intraday remain above price — still confirming short-term downtrend dominance.
• The current compression could lead to a small retracement toward 111,800–112,400, which aligns with the Fib retracement zone and intraday supply.
⸻
📌 High-Probability Entry Zones (≤600-pip SL)
🔴 SELL (Trend Continuation)
• Entry: 111,800 – 112,400 (Fib 50–61.8% zone)
• SL: 113,000
• TP1: 110,000
• TP2: 108,800
• TP3: 107,300 (200-EMA / Daily demand)
Bias: Short from retracement back into structure resistance & EMAs alignment.
🟢 BUY (Short-Term Reversal Play)
• Entry: 108,800 – 109,200 (demand & trendline)
• SL: 108,200
• TP1: 111,200
• TP2: 112,000 (Fib zone)
Bias: Only valid if RSI stays above 35 and MACD histogram flips green — scalp reversal before trend resumes.
⸻
📅 Fundamental Watch
• Weekend liquidity remains low — avoid chasing false breakouts.
• No major macro events until Monday, but watch CME Futures Gap risk between 109k–111k.
• U.S. CPI data from earlier in the week reinforced stronger USD; risk appetite still fragile — BTC sensitive to Dollar Index movements.
⸻
⚠ Key Levels to Monitor
Resistance: 111,800 / 112,400 / 114,500 / 116,500
Support: 109,200 / 108,800 / 107,700 / 106,800
⸻
✅ Summary
BTC remains in a bearish correction phase below 114,000 after failing to hold structure.
A pullback to 111,800–112,400 could offer the best short opportunity (sell-the-rally setup).
If bulls defend 108,800, expect a technical bounce back to 112k before another drop.
Below 107,700 = full bearish continuation toward 105,000,
while reclaiming above 114,500 = short-term bullish recovery.
— ElDoradoFx PREMIUM 2.0 Team
⸻
🥇 ElDoradoFx PREMIUM 2.0 – PERFORMANCE 10/10/2025 🥇
📊 MARKET RECAP:
🔻 SELL 🔴 +50 pips
🔻 SELL LIMIT 🔴 +20 pips
❌ SELL 🔻 –95 pips (SL)
🔻 SELL 🔴 +210 pips
🟢 BUY 🟩 +110 pips
🟢 BUY 🟩 +200 pips
🔻 SELL 🔴 +40 pips
---
🏆 GOLD TOTAL PIPS WON: +535 pips
📊 RESULT: 7 Signals → 6 Wins | 1 SL
🎯 ACCURACY: 86 %
---
🔥 Another strong trading day!
Controlled risk, solid entries, and consistent results 💪📈
👏 Congratulations if you profited ✅✅✅🚀🚀🚀

Bitcoin - The path remains clearly bullish!💰Bitcoin ( CRYPTO:BTCUSD ) remains bullish either way:
🔎Analysis summary:
For the past 1.000 days, Bitcoin has simply been heading higher. Considering that the previous bullruns lasted about 800 days, Bitcoin is ready for a correction. But market structure tells us, that Bitcoin remains bullish, even if we see a short term correction in the near future.
📝Levels to watch:
$50.000, $1.000.000
SwingTraderPhil
SwingTrading.Simplified. | Investing.Simplified. | #LONGTERMVISION

#BTCUSDT: Two Areas To Buy Swing, Same Target $150KDear traders,
We are resuming publication here on TradingView. If you agree with our insights, consider liking and commenting on the idea.
Let’s focus on Bitcoin. Its price has rallied since the last two weeks, showing extreme bullish volume in the market. This is mainly due to fear of negative fundamentals in the US economy, which is showing a lack of trust in the US Dollar. As traders and investors seek alternatives to the US Dollar, the main two prospects that look promising are Gold and Bitcoin.
So, what’s next? We think there are two possible buying areas where the price could reverse. The first is at a minor correction, and the second is a major correction. However, we believe the minor correction looks more promising at the current market conditions, while the major corrections would require fundamental intervention. Both present good opportunities.
This is our view only, and it doesn’t guarantee that the price will follow our predictions. Do your own analysis and research before making any decisions. We thank each of you for your support throughout and expect it to continue.
Much Love and Regards,
Team Setupsfx_

Want to Trade Like a Pro? This BTC Layer Strategy is Your Answer🚀 Become a Pro Trader: The "Thief" Layer Strategy for BTC/USDT (Bullish Swing Plan) 🚀
Unlock a professional money-making operation! This detailed plan combines a unique entry technique with deep fundamental & sentimental analysis to give you an edge.
📈 Trade Idea: BTC/USDT (Swing / Day Trade)
Bias: Bullish | Timeframe: 4H - 1D
🎯 The "Thief" Layer Entry Strategy
This strategy "steals" good entries at various levels instead of chasing the market.
Entry Method: Multiple Buy Limit Orders (Layering)
Proposed Entry Zones: $111,000 | $111,500 | $112,000 | $112,500
You can add more layers based on your capital and risk appetite.
⛔ Stop Loss (Risk Management)
Hard Stop Loss: $110,000 (Below key support)
⚠️ IMPORTANT NOTE (Thief OG's): This is MY stop loss. You MUST adjust your SL based on your personal risk management strategy. Protect your capital first.
🎯 Take Profit (Exit Strategy)
Primary Target: $116,000 (Strong Resistance + Overbought Zone)
The Plan: Escape with "stolen" profits before any potential trap snaps shut!
⚠️ IMPORTANT NOTE (Thief OG's): This is MY target. You are free to take profit earlier or adjust based on your own analysis. Secure your bags!
🔍 Why This Plan? The "Thief's" Analysis
This trade setup is backed by a confluence of technical, fundamental, and sentimental factors.
📊 Technical & Sentimental Backdrop (As of Sept 9, 2025)
Price Action: BTC showed strength with a +1.52% gain, bouncing from the $111,184 support.
Market Sentiment (Fear & Greed Index): 48/100 (Neutral) 😐. This indicates a balanced market with no extreme fear or greed—often a good base for a move.
Retail vs. Institutional:
Retail Traders: 55% Long (Slightly Bullish) 🤔. Fueled by Fed rate cut expectations.
Institutional Traders: 60% Short (Cautiously Bearish) 🏢. Their selling pressure appears to be exhausting, as shown by declining volume on dips. This creates a contrarian opportunity.
🌍 Fundamental & Macro Tailwinds
The $7.26T Cash Pile: Money market funds are holding a massive $7.26 Trillion. A Fed rate cut could unleash this capital into risk assets like Bitcoin. 🏦
Fed Rate Decision: An expected 25-50 bps cut is highly bullish for crypto, potentially triggering a major rotation.
Strong Bitcoin Fundamentals:
Low Inflation Rate: Only 1.17% (low new supply pressure). ✅
Network Health: Active addresses and settlement volume remain stable (~$12.9B/24h).
Dominance: BTC is outperforming traditional safe havens like gold (+102% YoY vs. gold's +42%).
✅ Overall Outlook Score
Bull (Long) Score: 55/100 → Neutral-Bullish 🐂
Bear (Short) Score: 45/100 → Weak Bearish Pressure 📉
🎯 Final Thief's Outlook: Cautiously optimistic. The layered entry strategy allows us to capitalize on potential upside driven by macro factors while strategically managing risk.
👀 Related Pairs to Watch
BINANCE:ETHUSDT | BINANCE:SOLUSDT | BINANCE:BNBUSDT (Altcoins follow BTC's lead)
TVC:DXY (U.S. Dollar Index) | CBOE:SPX (S&P 500)
✨ “If you find value in my analysis, a 👍 and 🚀 boost is much appreciated — it helps me share more setups with the community!”
#BTC #Bitcoin #Trading #Strategy #LayerStrategy #SwingTrading #Cryptocurrency #TechnicalAnalysis #FundamentalAnalysis #ThiefStrategy

BTCUSDBTCUSD needs correction and further upside to break the ATH again.
Disclosure: We are part of Trade Nation's Influencer program and receive a monthly fee for using their TradingView charts in our analysis.

Bitcoin Swing Trade Setup – Institutional Inflows Fuel Bulls🎭 BTC/USD – Money Heist Plan 🚀 (Swing + Scalping Strategy)
📊 BTC/USD Real-Time Market Data
Current Price: $111,156.01
24h Change: +$2,117.61 (+1.94%)
Day’s Range: $108,540.93 – $111,180.45
52-Week Range: $49,538.00 – $123,640.00
😰 Fear & Greed Index
Score: 49/100 → Neutral 😊
Trend: Shifted from “Fear” to “Neutral” in the last 24 hours.
🧠 Investor Sentiment Outlook
Retail Traders: Cautious (63% worry about crypto safety).
Institutional Traders: Bullish (💵 $3.7B net inflows in August).
🌍 Fundamental & Macro Score
Policy Uncertainty: High (U.S. tariffs, Fed policy shifts).
Fed Rate Cut Probability: High (expected September cut).
Key Event: Non-Farm Payrolls (Sept 5; forecast 45K jobs).
Gold Rally: $3,508/oz (+30% YTD, strong hedging demand).
🐂 Market Outlook
Short-Term: Neutral → Slightly Bearish (September volatility ahead).
Long-Term: Bullish (Institutional inflows + macro liquidity).
Bull/Bear Score: 55% Bullish vs 45% Bearish.
🎯 Thief’s Trading Plan (Layered Entry Strategy)
I’m setting up multiple limit orders (“Thief Layers”) instead of going all-in — this spreads risk, builds better entries, and keeps flexibility.
Entry (Layered Buys):
$109,000 → $109,500 → $110,000 → $110,500
(Add more layers as per your own strategy)
Stop Loss (Thief SL):
$107,500 (Adjust for your own risk appetite)
Target Zone (Profit Extraction):
$116,000 (Checkpoint before major resistance zone)
💡 Key Takeaways
BTC rebounded +1.94% but faces headwinds from whale profit-taking & policy risks.
Neutral sentiment (49/100) reflects a balanced investor mood.
Friday’s NFP jobs data could shape Fed rate expectations → big volatility catalyst.
🔍 Related Pairs to Watch
BITSTAMP:ETHUSD | COINBASE:SOLUSD | BITSTAMP:XRPUSD | BINANCE:BTCUSDT | CRYPTOCAP:BTC.D
#BTCUSD #Bitcoin #CryptoTrading #SwingTrade #Scalping #TradingStrategy #LayeredEntries #CryptoCommunity
✨ “If you find value in my analysis, a 👍 and 🚀 boost is much appreciated — it helps me share more setups with the community!”

ElDoradoFx PREMIUM 2.0 – Weekend Bonus BTCUSD Analysis 04/10/25
BTC is trading around 122,280, consolidating after an explosive rally of over +11,000 pips from the 110,600 demand zone. After a strong bullish impulse, momentum is slowing as price hovers near short-term resistance.
⸻
🔍 Technical Outlook
Daily (1D):
BTC printed a massive bullish breakout from the descending channel, rallying from 110,600 to 123,800 before facing rejection at 123,900 — a previous structural high and psychological resistance.
• MACD: strong bullish momentum but starting to flatten, suggesting exhaustion.
• RSI: near 70, indicating overbought conditions.
• Parabolic SAR: still below price (bullish bias intact).
→ The daily structure remains bullish, but pullbacks are likely before continuation.
Intraday (1H):
Price is forming a short-term range between 121,950–122,900.
• The 200 EMA (white) is below price at 120,800, confirming ongoing bullish structure.
• However, MACD histogram shows decreasing buying volume and potential cross to the downside → early sign of correction.
• RSI hovering around 55–60, neutral zone → consolidation after high volatility.
Short-Term (15M / 5M):
BTC is showing lower highs while holding the 122,150–122,250 zone, building a potential bull flag.
• On the 15M chart, a small descending channel connects the highs at 122,790 → 122,460 → 122,300.
• 5M chart shows repeated liquidity sweeps below 122,180, followed by immediate rebounds → strong short-term demand.
Fibonacci Golden Zone (from swing low 120,779 → swing high 123,887):
Golden zone = 122,000–122,300 — BTC is trading exactly inside it now, offering a high-probability reload area for buyers if defended successfully.
⸻
📈 High-Probability Entry Zones (Max 60 pips SL)
🎯 Buy Setup (Fibonacci Golden Zone Support):
• Entry: 122,000–122,200
• SL: 121,900 (below structure)
• TP1: 122,600
• TP2: 122,900–123,000
• TP3 (extended): 123,800 (previous high)
→ Confluence: Fib Golden Zone + short-term EMA support + strong RSI defense.
🎯 Sell Setup (Short-Term Resistance Rejection):
• Entry: 122,850–123,000
• SL: 123,100
• TP1: 122,450
• TP2: 122,100
→ Only valid if price fails to hold above 122,850, confirmed by bearish candle structure on 15M.
⸻
📌 Breakout Levels to Continue Trend
• Bullish Continuation: Above 123,000–123,200 → momentum could extend into 123,900–124,400.
• Bearish Continuation: Below 121,900 → opens correction toward 121,200–120,800 (EMA + liquidity pool).
⸻
📅 Fundamental Watch (Weekend)
• No major events until Monday.
• Weekend liquidity is extremely thin, expect sharp stop hunts and sudden wicks.
• CME futures closed at 122,350 → small gap risk on Sunday open.
• Market sentiment remains cautiously bullish after strong week for risk assets.
⸻
⚠ Key Technical Zones
Resistance:
• 122,850 → 123,000 → 123,900 (major)
Support:
• 122,000 → 121,900 → 120,800
⸻
✅ Summary
BTCUSD is consolidating inside the Fibonacci golden zone (122,000–122,300) after a massive breakout week. The bias remains bullish while above 121,900, but momentum is slowing. Scalpers can buy dips within the golden zone for short-term 200–600 pip reactions. A clean breakout above 123,000 confirms bullish continuation, while a break below 121,900 triggers a correction toward 120,800.
— ElDoradoFx PREMIUM 2.0 Team

BTC/USD – Short Setup from Resistance Zone (Oct 2025 Analysis)Trend & Channel
The price has been moving inside an ascending parallel channel (highlighted in pink).
Current price is $122,395, approaching the upper boundary of the channel, where resistance typically appears.
Key Levels
Entry Point: Around $124,257 – suggested short-entry zone.
Support/Resistance Zone (Blue Box): Between $128,000 – $130,442. This is where rejection is expected.
Stop Loss: Above $132,000 – just outside the resistance zone to protect against a breakout.
Target Point: $104,097 – near the lower boundary of the channel, aligning with prior support levels.
Price Action Setup
The chart suggests a short trade setup (sell) if BTC/USD hits the $124K–$130K zone.
Expectation: After touching this resistance area, price could reverse downward toward the $104K target.
Risk-to-Reward Ratio
Risk: About $8,000 (132K - 124K).
Reward: About $20,000 (124K - 104K).
Approximate R:R = 2.5 : 1, which is favorable for a swing trade.
✅ Summary:
This is a bearish short-term outlook for BTC/USD. The strategy is to wait for price to reach the 128K–130K resistance zone, enter a short position, keep a stop loss above 132K, and aim for a target around 104K

BTC/USDT Bearish Trend analysis Read The captionSMC Trading point update
Technical analysis of BTC/USDT (4H timeframe) chart analysis:
---
Bearish Bitcoin Setup
Trend: The market is clearly in a downtrend, with price respecting the descending channel.
Fair Value Gaps (FVG): Two FVG zones are highlighted where price retraced to fill imbalances.
Moving Averages:
50 EMA (red) and 200 EMA (blue) are above price, confirming bearish momentum.
Key Resistance: Price is currently retesting the FVG supply zone around 111,000 – 111,500, which aligns with the descending trendline.
Rejection Expected: If sellers defend this zone, price is likely to continue its bearish trajectory.
---
Target Point
A measured move suggests a potential drop towards 106,218 (next support / target zone).
This aligns with the channel’s lower boundary.
.
Mr SMC Trading point
---
Trading Idea
Bias: Bearish.
Entry Zone: Around 111,000 – 111,500 (FVG supply & trendline confluence).
Target: 106,218.
Invalidation: A breakout above 113,000 (200 EMA) would weaken the bearish setup.
---
Please support boost 🚀 this analysis

BTC long, because ... why not?BTC is "THE" asset against monetary expansion and Powell kind of gave the green light, not for more rate cuts, but he acknowledged that Trump might be "irght" about cutting rates.
Market still price 2 or 3 rate cuts by EOY.
there is no reason BTC does not trade above 120k soon, and why not 144k when we are at it?
H12 200 MA/EMA as a nice inflection point here.

BTCUSDBTCUSD needs sideways for few more days within this month and then will start a push up end of this month or early net month.
Disclosure: We are part of Trade Nation's Influencer program and receive a monthly fee for using their TradingView charts in our analysis.

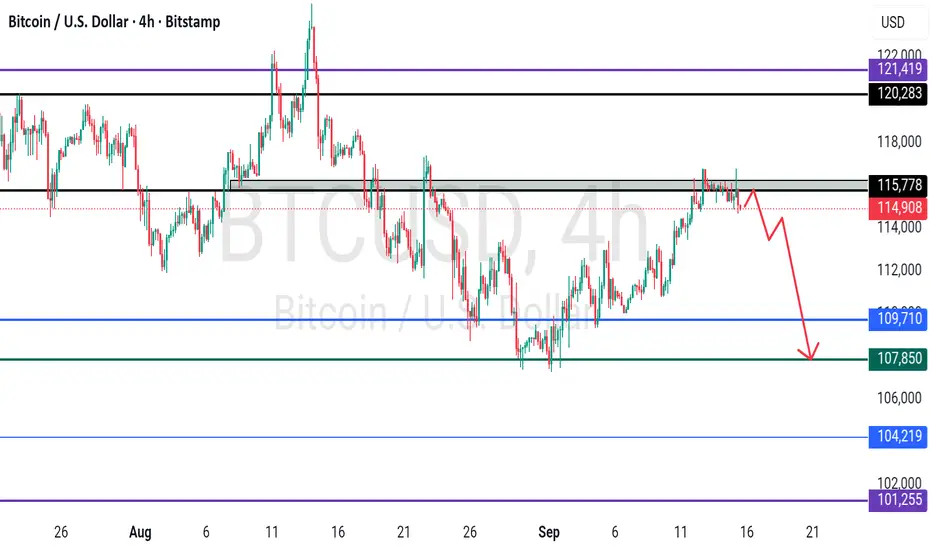
BTCUSD Bearish Flag Continuation: Short Setup Targeting $100,000Bearish Flag/Channel: The chart shows price action forming a downward-sloping, parallel channel after a prior drop (which isn't fully visible but implied by the setup). This pattern is commonly referred to as a bearish flag or descending channel, which is typically a continuation pattern.
Implication: A bearish flag/channel suggests that after this consolidation phase, the price is likely to break to the downside and continue the previous move lower.
Short Trade Plan
The chart outlines a specific short entry, stop loss, and profit target based on the potential bearish continuation:
Entry Point: $118,228.59
Interpretation: The trader is looking to enter the short trade on a retest of a previous resistance level or the top of the consolidation range, specifically a level around the potential breakdown area.
Stop Loss: $121,395.17
Interpretation: This is the price level where the trade would be closed to limit losses. It sits just above the entry point and the consolidation high, likely to protect against a false breakdown or a strong move back up.
Target Point: $100,481.05
Interpretation: This is the profit-taking level. It appears to be based on a measured move of the bearish flag pattern, projecting the distance of the "pole" (the move before the flag) downward from the breakdown point. It also aligns closely with the major psychological level of $100,000.
Risk/Reward
The setup, as drawn, shows a relatively favorable risk-to-reward ratio, which is generally a good characteristic for a trade:
Risk (from Entry to Stop Loss): $121,395.17 - $118,228.59 ≈ $3,166.58
Reward (from Entry to Target Point): $118,228.59 - $100,481.05 ≈ $17,747.54
Approximate R:R: 17,747.54/3,166.58≈ 5.6 to 1
Current Price Context
The current price at the time the chart was taken is $109,401.93.
This means the price is currently well below the proposed entry point of $118,228.59.
The price is sitting within the lower half of the drawn descending channel (bearish flag).
Possible Scenarios from Current Price:
Immediate Continuation: The price could break the lower boundary of the channel from its current position and head directly toward the target. In this case, the drawn trade setup would be missed, and the trader might look for a different entry on a retest of the broken channel.
Execution of Setup: The price could rally back up toward the upper boundary of the channel and the $118,228.59 entry point before reversing and heading down. This would allow the trade plan to be executed as intended.

BTCUSDT at resistance ? What's next ??#BTCUSDT.. market just broke his supporting area and now it will turned into resistance.
Keep close and stay short until holds.
Good lucktrade wisley
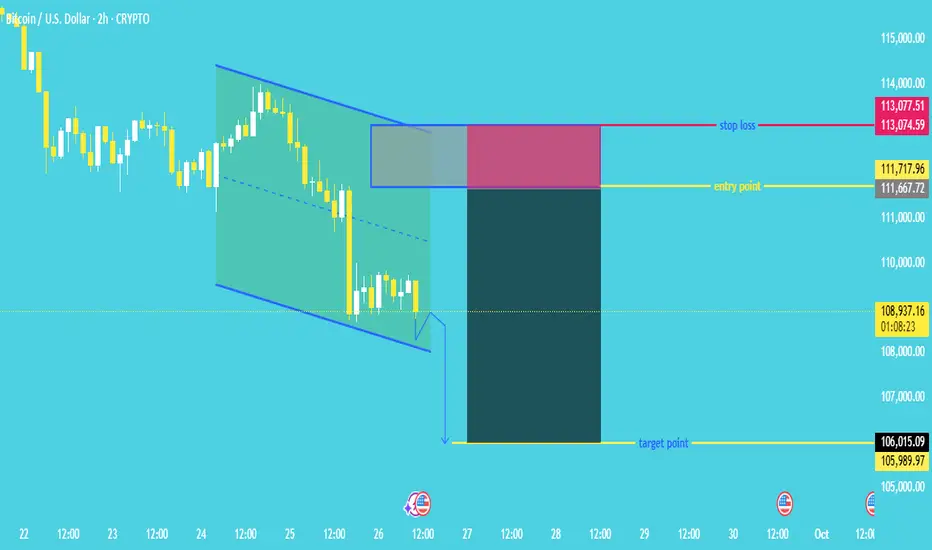
"Bitcoin Bearish Continuation Pattern: Short Entry on Retest"Chart Pattern
The price is moving within a descending channel (highlighted in blue and green), which typically signals continuation of the current downtrend.
A breakout to the downside of the channel seems to be forming (small breakout candle drawn outside the channel).
🔽 Trade Setup: Short Position
This is a short trade setup, meaning the trader expects the price to go down.
🔸 Entry Point
Entry Zone: Between 111,667.72 and 111,717.96 USD
This is above the current price, suggesting a pullback entry (waiting for a slight retracement before shorting).
🔹 Stop Loss
Stop Loss Zone: Between 113,074.59 and 113,077.51 USD
Placed above the channel and the entry point to protect against invalidation.
🟢 Target Point (Take Profit)
Target Zone: Between 105,989.97 and 106,015.09 USD
The expected price move is based on a measured move or projected breakdown from the channel.
🧮 Risk to Reward Ratio
The risk/reward box (red for risk, green for reward) shows a positive risk-reward ratio, likely around 1:2 or better, which is favorable in trading.
✅ Analysis Summary
Trend: Bearish (descending channel, lower highs and lower lows).
Setup: Short position on pullback into resistance zone.
Target: 106,000 area.
Stop: 113,000 area.
Current Price: Around 108,905.09 USD.
📌 Final Thoughts
The setup assumes the breakdown from the channel is valid.
A retest of the breakdown zone (entry point) is anticipated before continuation downward.
Be mindful of potential false breakouts or sudden bullish reversals.
#BTC/USDT THE ONLY BITCOIN CHART YOU NEED!BTC : Almost There!
BTC is currently following the trajectory shown in my last chart. It took some time, but it’s playing out exactly as expected. Sooner or later, a bounce is coming — there’s no reason to panic unless we break below $103.5K, which is the key support level.
You need to understand that only when money moves out of BTC and big-cap alts will THE MID AND THE SMALL CAPS will have their time to shine. And sooner or later, you'll realise all this happened for good if you played it right. Even if not, many opportunities are coming ahead.
You’ll see this happen soon.
MY MESSAGE TO YOU ALL:
If you've been in crypto for a few years, you know this moment: it’s when the market is on the brink of a big move.
Be patient, it won’t happen overnight, but sooner or later, it will.
If you're currently in the red, take it as a lesson. It happens to the best of us. I've had four positions stopped out, too. It could have been worse if I hadn’t had a STOP LOSS in place.
The silver lining? I can re-enter at a better price.
A lesson I’ve learned over the years: STOP LOSS is a life-saver.
Stay strong and don’t give up right before the big opportunity we’ve all been waiting for.
Opportunities are ahead, manage your risks and remember to take a break, touch some grass. I’m with you.
I'll drop more charts shortly.
Stay strong, folks.
WAGMI!
Do hit the like button, and if you have any doubts, questions, or chart requests, drop them in the comments.
Thank you
#PEACE

Bitcoin Reward – Bullish Thieves or Bearish Bandits?🚨💰 BTC/USD "Bitcoin vs U.S. Dollar" Crypto Market Grand Heist Plan 🎭🚨
🕵️♂️ Dear Thief OG’s, Money Makers & Market Bandits 💎💰
It’s time to lock & load the Bitcoin Heist Plan with both sides of the robbery open (Bullish & Bearish)! ⚡
🔑 Entry Zones (Where the Robbery Begins)
📉 Bearish Bandits: Any price level! Rob the upside liquidity & run it down!
📈 Bullish Thieves: Pullback entry 108,000.0 and above – sneak in with style & power.
🛑 Stop Loss (Escape Route)
🔒 For Bullish: Thief SL @ 105,000.0 🚨
⚠️ Reminder, OG’s: Adjust your SL with your own strategy & risk plan. Don’t get caught by the market police 👮♂️💥.
🎯 Target (The Loot Bag)
🏆 Bullish Robbery Target: 124,000.0 💸
🏴☠️ Bearish Robbery Targets:
1️⃣ 110,000.0
2️⃣ 104,000.0
📜 Thief’s Market Note
This isn’t just a trade, it’s a crypto robbery blueprint – choose your side, Bullish or Bearish, and execute like a true Thief Trader. Always plan your entries in layers, stack the loot, and manage your risk like a pro bandit. ⚡💼
🔥💥 If you love the heist style, Boost this idea 💥🔥
Every boost adds fuel to the Thief Trading Crew 🚀💎.
Stay alert, stay sharp, and remember… the market is the biggest bank, and we are here to rob it! 🤑🎭💰

Bitcoin - Looking To Sell Pullbacks In The Short TermH1 - Strong bearish move.
Currently it looks like a pullback is happening.
No opposite signs.
Expecting bearish continuation until the two Fibonacci resistance zones hold.
If you enjoy this idea, don’t forget to LIKE 👍, FOLLOW ✅, SHARE 🙌, and COMMENT ✍! Drop your thoughts and charts below to keep the discussion going. Your support helps keep this content free and reach more people! 🚀

BTC Analysis TodayAs we’ve maintained all this time, BTC dipped to around 115500 at one point today and that was a great time to buy. Right after the pullback, it rebounded and started rising. the overall upward trend holds, and support level strong.
Buy 115000 - 115500
TP 116000 -116500 - 117000
Daily-updated accurate signals are at your disposal. If you run into any problems while trading, these signals serve as a reliable reference—don’t hesitate to use them! I truly hope they bring you significant assistance

BTCUSDBTCUSD needs some correction for the next few days before any upside.
Disclosure: We are part of Trade Nation's Influencer program and receive a monthly fee for using their TradingView charts in our analysis.

Nailed it! Accurate Prediction of BTCAs we accurately predicted on the 16th, BTC’s resistance level would be concentrated between the 117000 and 118000 and that is exactly what occurred. After advancing to around 117000, it pulled back; subsequently, it rebounded to near 118000 before retreating immediately.
Currently, the support level at 114400 remains solid, and the overall trend continues to be upward.
Buy 115500 - 116000
TP 116500 -117000 - 117500
Daily-updated accurate signals are at your disposal. If you run into any problems while trading, these signals serve as a reliable reference—don’t hesitate to use them! I truly hope they bring you significant assistance

Bitcoin - It is bullish either way!💎Bitcoin ( CRYPTO:BTCUSD ) still remains bullish:
🔎Analysis summary:
Yes, over the past couple of days we have been seeing a quite negative correction on Bitcoin. However, looking at the higher timeframe, Bitcoin remains totally bullish. So even if Bitcoin continues with the recent correction, it would ultimately result in a bullish all time high break and retest.
📝Levels to watch:
$60.000
SwingTraderPhil
SwingTrading.Simplified. | Investing.Simplified. | #LONGTERMVISION
