BTC/USD PROFESSIONAL CHART ANALYSISPrice Action Breakdown
The breakdown candle shows strong momentum and volume, suggesting institutional participation.
Post-breakdown, price formed a lower low → bearish structure confirmed.
The current price action is a pullback into supply / resistance, not a reversal.
Trade Idea Marked on the Chart
Entry Zone (Short)
Entry area around 89,600 – 90,200
This zone aligns with:
Previous support turned resistance
Breakdown level retest
Psychological 90k level
Targets
1st Target: ~87,350
Local support
Likely intraday bounce area
Final Target: ~85,600
Strong demand zone
Prior range base / liquidity pool
Key Levels
Resistance:
90,200 – 91,000 → strong rejection zone
Support:
87,300 (minor)
85,500–85,600 (major)
Btcusdtrading

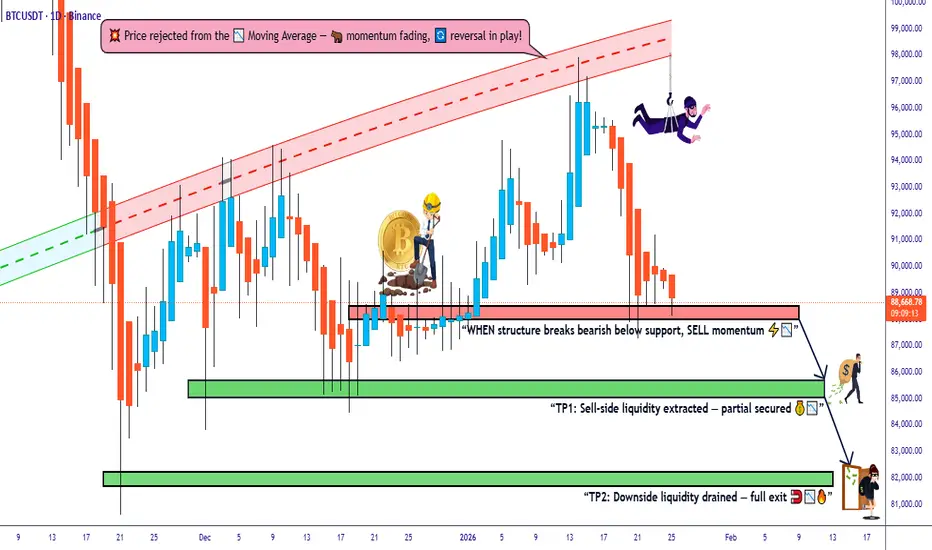
Bitcoin vs Tether: Structure Breakdown Trade Plan📊 BTC/USDT "BITCOIN VS TETHER" CRYPTO MARKET PROFIT PATHWAY SETUP 💰
🎯 TRADE TYPE: Day / Swing Trade - Bearish Bias w/ Bullish Rejection Signals
💡 REAL-TIME MARKET DATA (As of January 25, 2026) ✅
Bitcoin is currently trading around $88,516.85 USD, showing consolidation after recent volatility. BTC/USDT is down approximately 0.40% in the last 24 hours, with the market experiencing what analysts describe as a critical technical squeeze pattern.
🔥 TECHNICAL SETUP BREAKDOWN 🔥
📍 CURRENT PLAN: Bearish trend confirmed with multiple bullish rejection attempts at resistance zones
🎯 ENTRY ZONE: Support level breakout @ $88,000 📉
Pro Tip: Watch for volume confirmation on breakdown before entering position
🎯 TARGET 1: $85,500 (Initial profit-taking zone)
🎯 TARGET 2: $82,000 (Extended bearish target)
🛑 STOP LOSS: $91,000 placed at recent swing high resistance
⚠️ RISK DISCLOSURE ⚠️
Dear Trading OG's & Market Warriors 🏴☠️
These are MY technical levels based on current market structure. This is NOT financial advice! You're the captain of your own ship 🚢
✅ Your money, your rules, your responsibility
✅ Adjust TP/SL according to YOUR risk tolerance
✅ Never risk more than you can afford to lose
✅ Position sizing is KEY to survival in this game
📈 CORRELATED PAIRS TO WATCH 💎
Recent correlation data shows BTC exhibiting strong alignment with major cryptocurrencies, with Solana showing near-perfect correlation at 0.99, Ethereum at 0.89, and XRP at 0.86.
Monitor these pairs for confluence:
🔹 ETH/USDT (Ethereum) - Correlation: 0.89 | Trading ~$3,100
🔹 SOL/USDT (Solana) - Correlation: 0.99 (Almost identical movement!) | ~$175-$180
🔹 XRP/USDT (Ripple) - Correlation: 0.86 | Trading ~$1.89-$2.00
🔹 DOGE/USDT (Dogecoin) - Correlation: 0.87 | Meme power tracking BTC
🔹 ADA/USDT (Cardano) - Correlation: 0.86 | Parallel movement patterns
💡 KEY INSIGHT: The unusually high correlations suggest the market is moving in unison, with broad sentiment overriding individual asset characteristics. When BTC moves, expect these pairs to follow!
📰 FUNDAMENTAL & ECONOMIC FACTORS 🌍
🔴 CRITICAL MACRO EVENTS INFLUENCING THIS TRADE:
1️⃣ Regulatory Landscape Shift 🏛️
Institutional experts highlight that regulatory clarity, particularly the potential passage of the Digital Asset Market Clarity Act, could be a key driver for Bitcoin's recovery path. The CLARITY Act aims to establish the CFTC as the primary regulator for digital commodities and end "regulation by enforcement."
2️⃣ Institutional ETF Flows 💼
Bitcoin spot ETFs accumulated over $1.9 billion in net inflows during the first week of January 2026, showing continued institutional appetite despite price weakness. However, recent patterns show a $1.2 billion inflow followed by a $243 million outflow, typical of tight consolidation phases.
3️⃣ Bollinger Bands Squeeze Alert! 📊
Bitcoin's Bollinger Bands have narrowed to less than $3,500, the tightest compression since July 2025, signaling an imminent major price move in either direction. This technical pattern historically precedes significant volatility explosions.
4️⃣ Market Sentiment Analysis 😰
Current market sentiment shows "extreme fear" conditions, which can actually be a contrarian bullish indicator. Historically, periods of extreme fear have coincided with attractive entry points for long-term investors.
5️⃣ Interest Rate Environment 📉
Potential Federal Reserve rate cuts and a more accommodating monetary policy stance toward crypto could support Bitcoin in 2026, though geopolitical uncertainties and elevated equity valuations create a complex investing environment.
6️⃣ Expert Price Forecasts 🎯
Industry analysts forecast a wide range for Bitcoin in 2026, from lows of $75,000 to highs of $225,000, with major institutions like Standard Chartered and Citi projecting targets between $143,000-$150,000.
7️⃣ Supply-Demand Dynamics ⚖️
Corporate treasuries and sovereign reserves have absorbed Bitcoin's annual production by a factor of 4.7 in 2026, creating a significant supply-demand imbalance that could support long-term price appreciation.
🎲 UPCOMING CATALYSTS TO WATCH 📅
🔸 January FOMC Meeting - Fed policy decisions impacting risk assets
🔸 U.S. Midterm Elections (2026) - Political uncertainty factor
🔸 GENIUS & CLARITY Acts - Legislative developments
🔸 AI Investment Sustainability - Tech sector correlation effects
🔸 Geopolitical Tensions - Safe-haven vs risk-off dynamics
🧠 TECHNICAL CONFLUENCE CHECKLIST ✔️
✅ Multiple bearish rejections at resistance
✅ Support level identified at $88,000
✅ Volume analysis confirming selling pressure
✅ Bollinger Bands squeeze = volatility explosion incoming
✅ RSI positioned neutrally (room to move either direction)
✅ 720-day moving average intact at $86,000 as long-term support
✅ Key resistance cluster at $94,000-$95,000 zone
💪 PROFESSIONAL TRADER MINDSET 💪
Remember:
🎯 Plan your trade, trade your plan
🎯 Risk management > Being right
🎯 Markets reward patience and discipline
🎯 One trade doesn't define your career
🎯 Protect your capital like it's your last dollar
📢 FINAL THOUGHTS 🚀
This setup offers a defined risk-reward opportunity in a market experiencing historically low volatility that typically precedes major price movements. The confluence of technical patterns, institutional flows, and regulatory developments creates an intriguing setup for both day and swing traders.
Trade smart, not emotional! 🧠💎
🔔 LIKE, BOOST & FOLLOW FOR MORE PREMIUM SETUPS! 🔔
💬 DROP YOUR THOUGHTS IN THE COMMENTS! 💬
🚀 LET'S GET THESE GAINS TOGETHER! 🚀
#Bitcoin #BTCUSDT #CryptoTrading #TechnicalAnalysis #DayTrading #SwingTrading #CryptoSignals #TradingView #BTC #Cryptocurrency #PriceAction #SupportAndResistance #TradingStrategy #RiskManagement #BearishSetup #MarketAnalysis #CryptoMarket #BTCAnalysis 📊💰🎯
BITCOIN: As Expected Price Is Dropping, Waiting To Come at 60K?Dear Traders,
As anticipated, the price is reversing from $98,000 and may experience a significant drop towards $60,000. The $60,000 area remains strong and attracts swing buyers. Our recommendation is to wait for the price to break through this trading range pattern. A strong breakthrough would indicate a clear price pattern.
If you like our idea, please like and comment for more.
Team SetupsFX_

$BTC/USDT ANALYSISOn the 8-hour MEXC:BTCUSDT chart, price shows a clear rejection from the higher-timeframe supply zone around the mid-94k area, confirming that strong sell orders are still active there, and the subsequent decline has brought price back into the prior breakout region near 89–90k, which is now acting as a critical decision zone; structurally, the market is trading within a rising base but momentum has weakened, indicating distribution rather than aggressive accumulation, and the current consolidation below resistance reflects compression after rejection rather than strength, meaning as long as price remains below the major supply and fails to reclaim it, downside risk remains elevated, while only sustained acceptance and holding above the 89–90k support would shift the bias back toward continuation higher.

BTCUSD: Bitcoin's Wave Structure Is on the Verge of a New ImpulsBTCUSD: Bitcoin's Wave Structure Is on the Verge of a New Impulse
BTCUSD Wave Overview (D1 and H4)
As a trader who has been practicing wave analysis for over ten years, I note that the current Bitcoin picture shows the completion of an extended corrective formation and the potential for a new move.
Chart D1: The global structure indicates that the market is gradually breaking out of its sideways range. The wave formation looks like the end of a correction, which is laying the foundation for the next impulse.
Chart H4: Local dynamics confirm the first signs of an impulse. Key entry points are forming here, which could mark the beginning of a larger wave.
Main Scenario
After the completion of the corrective phase, a downward impulse sequence is expected to develop. This movement may be accompanied by increased seller activity and a shift in focus to the downside.
Alternative Scenario
If the price holds above local peaks and forms a stable upward impulse structure, the focus will shift to continued growth. In this case, the correction will be considered incomplete, and Bitcoin may experience a further rebound.
Trading Idea
Conservative approach: wait for confirmation of a breakout of key levels and enter with the trend.
Aggressive approach: use local impulses on H4 for earlier entries, but with tight stops.
In both cases, it is important to maintain strict risk management and adjust the plan as new impulses emerge.
Results
BTCUSD is at a crossroads between the end of the correction and the beginning of a new impulse. The wave structure on D1 and H4 provides clear guidelines for action: watch for confirmation of the scenario and act with discipline.

BTC bull market is not over, how should we plan for the future?#BTCUSD BINANCE:BTCUSDT BITSTAMP:BTCUSD BITSTAMP:BTCUSD
The BTC market did not experience much volatility over the weekend, and today it only rose to near the 90500 resistance level before falling back again. Judging from the hourly and 4H charts, BTC still has room for a pullback and adjustment, and may need to consolidate again before breaking through the upper resistance. Short-term support is at 87800-87000. If it falls back to this level, we can consider taking a small long position in BTC. The key support level remains at 85500-85000. As long as this range holds, the bullish trend for BTC remains intact

BTCUSD: Holding Wave X or Slipping Lower?24 Nov 2025
27 Nov 2025
1 Dec 2025
17 Dec 2025
Bitcoin is still trading inside a falling channel, and the overall structure remains corrective. The recent bounce from lower levels lacks momentum and is overlapping, which signals consolidation rather than a trend reversal. Price continues to respect channel resistance, keeping the broader bias weak.
Wave X is acting as an important support zone around 83,822 , and as long as price holds above this level, further consolidation remains possible. This area is currently absorbing selling pressure and preventing immediate continuation to the downside.
However, a decisive breakdown below Wave X would signal that the correction is not complete. In that scenario, downside momentum is likely to expand, opening the path toward the 79,650 - 75,655 zone.
Stay Tuned
@Money_Dictators
RD :)

$BTC/USDT LONG IDEA – 3-DAYBitcoin is currently trading inside a strong **higher-timeframe support and reversal zone around $80,000–$82,000**, which also aligns closely with the **200 EMA** on the 3-day chart. This area has acted as a major demand zone in the past, and price is now showing stabilization after a sharp sell-off. As long as BTC holds above this zone, the structure supports a **bounce-based long setup** rather than continuation to the downside.
We are planning a **long position near the support zone**, expecting buyers to defend this level. The **stop loss** should be placed **below $79,900**, as a clean break below this level would invalidate the support and open the path toward the $74,500 area. For the upside, the **final target** is set at **$92,000–$94,000**, which is the nearest major resistance and previous supply zone on the higher timeframe. This setup offers a **clean structure-based long** with clear invalidation and a favorable risk-to-reward if support holds.
**Trade Summary (for TradingView):**
• Direction: **LONG**
• Entry Zone: **$83,000 – $85,000**
• Stop Loss: **$79,900**
• Final Target: **$92,000 – $94,000**
• Bias: **HTF support + 200 EMA bounce**

$BTC/USDT ANALYSISOn the 2-hour chart, BINANCE:BTCUSD is still trading inside a wide consolidation range, but the overall structure shows a slow upward trend supported by the rising diagonal trendline below the price. Every time BTC has dipped toward that ascending line, buyers have stepped in and pushed it back up, which means the market is still respecting bullish pressure from the bottom. On the upside, the main problem remains the heavy supply zone around 93,500 to 94,500, where price has repeatedly rejected and failed to break through. Each attempt into that zone has triggered selling and pulled the market back down, showing that sellers are still defending this level strongly. At the moment, price is sitting near the mid-range, recovering after a sharp drop, but it has not shown any clean breakout or breakdown yet. As long as the ascending support trendline holds, the market stays in a slow bullish structure, but unless BTC breaks above the 94,500 zone with strength, the chart will continue to move sideways between support and resistance.

$BTC/USDT ANALYSISBitcoin is moving inside a symmetrical triangle on the 8-hour chart and the price is sitting near the middle of the range, trading below the 50MA which is acting as a resistance zone on top. Bulls are defending the lower trendline while sellers are active near the upper trendline, creating a squeeze where volatility is slowly reducing. If price holds above support, it may continue to move sideways inside the triangle, but a strong candle above the 50MA and triangle top would show strength, while a drop toward the ascending support would show weakness. Right now market is neutral and waiting for a clear break from this pattern, so upcoming moves around these trendlines will decide the next direction.

Bitcoin Momentum Building — Bullish Plan Activated!BTC/USDT — “BITCOIN VS TETHER”
Crypto Market Opportunity Blueprint (DAY / SWING Trade) 💹✨
🔥 Plan: Bullish plan confirmed
The structure is supported by a Hull Moving Average (HMA) pullback, behaving like a clean re-accumulation phase — showing buyers quietly loading before the next expansion wave.
This pattern typically appears before trend continuation legs, especially when volatility compresses after a strong impulse.
🎯 Entry
📌 YOU CAN ENTRY AT ANY PRICE LEVEL
(Structure shows strength across multiple levels with buyers defending dips.)
🛡️ Stop Loss
⚠️ This is thief SL @ 86000
Dear Ladies & Gentleman (Thief OG's), adjust your SL based on your own strategy & personal risk tolerance.
🔍 Important:
I am not recommending to use only my SL.
It's your own choice — you can make money then take money based on your own risk.
🎯 Target
Price is moving into a zone where the moving averages act as a strong resistance, combined with overbought conditions and potential trap formation, so escaping with profits is wise.
📌 Our target @ 98000
Again — Dear Ladies & Gentleman (Thief OG's):
I am not recommending to set only my TP.
You can make money then take money at your own risk.
📡 Related Pairs to Watch (Correlations & Key Behaviors)
Below are correlated assets that help confirm BTC/USDT’s flow, momentum, and broader crypto market direction. These are presented in $ format for TradingView tagging.
1️⃣ BINANCE:ETHUSDT (Ethereum)
Strongest beta-pair to Bitcoin.
When BTC shows re-accumulation, ETH often leads the breakout earlier.
If ETH breaks major resistance first → increases confidence in BTC continuation.
2️⃣ BINANCE:SOLUSDT (Solana)
High-momentum asset; reacts faster than BTC.
If SOL pumps aggressively while BTC consolidates → indicates risk-on sentiment across crypto.
Good for measuring market confidence.
3️⃣ BINANCE:BNBUSDT (BNB)
Acts as a market stability indicator.
If BNB stays firm above key moving averages, liquidity remains strong across the crypto market.
Helps confirm medium-term bullish structure.
4️⃣ BINANCE:ETHBTC (Ethereum / Bitcoin Ratio)
A critical relative-strength indicator.
If ETHBTC drops → capital rotates into BTC dominance, supporting your Bitcoin bullish plan.
If ETHBTC rises → broad alts strength, but BTC may not accelerate instantly.
5️⃣ CRYPTOCAP:TOTAL2 (Altcoin Market Cap)
When TOTAL2 rises with BTC → marketwide confidence.
When TOTAL2 stagnates but BTC rises → BTC-only rally (typical before big breakouts).
Useful to detect inflow distribution.
6️⃣ TVC:DXY (US Dollar Index)
Inverse correlation with Bitcoin.
If DXY weakens → supports BTC bullish continuation.
Important for swing traders taking multi-day positions.
7️⃣ CRYPTOCAP:USDT.D (Tether Dominance)
When USDT.D drops → money flowing from stablecoins into crypto.
When USDT.D rises → risk aversion.
Perfect tool for confirming if BTC demand is real.
📈 Summary Insight
Together, BTC’s HMA pullback + re-accumulation structure, rising momentum across correlated pairs, and declining defensive indicators build a high-probability bullish continuation environment for the next expansion wave.

#BITCOIN: Still Expecting Price To Touch $60K To $65K! Bitcoin is likely to drop further down before we could see a strong bullish move taking price to all time high. This is our view only and it is not an guaranteed move; once price touch our reversal zone then we could see price going back to all time high. Good luck and trade safe!
Team Setupsfx_
Like And Comment Our Ideas For More Such Educational content! 📊🚀

BTCUSD: The Premium Mitigation TrapThe Narrative: Mitigation Before Expansion While the crowd chases green candles, the Daily structure tells a different story. We are witnessing a textbook CRT Mitigation Phase. Price is not reversing; it is simply rebalancing inefficiencies to prepare for the next leg of institutional delivery.
Technical Breakdown:
The Magnet (Bearish FVG): Price is currently drawing up into a significant Bearish Fair Value Gap (FVG) sitting between $95,900 and $97,500. In the CRT framework, this gap acts as a "price magnet". Smart Money uses this rise to rebalance price and induce retail bulls before slamming the door.
Premium Pricing: This move brings Bitcoin into "Premium" pricing relative to the recent dealing range. Institutions sell in premium; they do not buy. This rally is the Manipulation Phase designed to hunt Buy-Side Liquidity (stops) above local highs before the real move occurs.
The Draw on Liquidity (DOL): Once the FVG is filled and the trap is set, the Draw on Liquidity flips aggressively to the downside. The structural targets are clear: the resting Sell-Side Liquidity pools at $78,418 and $74,592.
The Execution Plan:
We remain patient and let the price come to us.
Wait: Allow price to trade into the Grey FVG Box ($96k region)
Confirm: Watch for a "Thick Candle" rejection or a lower timeframe shift in structure to confirm the Smart Money entry.
Expand: Target the clean lows below $75k.
“Smart money doesn't chase price; they wait for price to enter their zones.”

BTCUSD: Wave rhythm on the verge of impulseBased on the current structure, Bitcoin is completing its corrective phase and is preparing to form a new impulse. The chart shows a transition from sideways movement to a more dynamic wave, which could set the direction for the near term.
Primary scenario: after the correction ends, a downward impulse sequence is expected to develop. Alternative scenario: if the market consolidates above recent highs, it could continue to rise, delaying the start of a new downward wave.
Idea for traders: watch for confirmation of the structure on lower timeframes and enter only after clear reversal signals appear.
Friends, more wave analysis is available in our profile.
Subscribe to stay up to date with wave analysis!

BTCUSD: Wave Pendulum on the Verge of ReversalBTCUSD: Wave Pendulum on the Verge of Reversal
BTCUSD Wave Overview (H4/D1)
According to its wave structure, Bitcoin is completing its corrective phase and preparing to form a new impulse. Current dynamics indicate a possible end to the sideways movement and a transition to the final wave of a larger cycle.
Primary scenario: A downward impulse sequence is expected to develop after the correction is complete. Alternative scenario: If the market consolidates above recent highs, it could continue to rise, delaying the start of a new downward wave.
Idea for traders: watch for confirmation of the structure on lower timeframes and enter only after clear reversal signals appear.

BTC: Bullish Trend, 900000 Breakout AheadFollowing Black Friday’s plunge, BTC’s uptrend is now confirmed—holding firmly above 85000 and awaiting a direct breakout above 90000
Buy 86500 - 87500
TP 88500 - 89000
Accurate signals updated daily. They serve as a reliable guide for trading issues – feel free to refer to them. Hope they help!

ElDoradoFx – BTCUSD ANALYSIS (22/11/2025, WEEKEND)1. Market Overview
BTCUSD continues in a strong downtrend from the 113k top, now trading around 84,000 after a sharp selloff. Price is sitting near the lower side of the descending channel and just above the key support band 83,500–83,400, with momentum still bearish but short-term showing signs of exhaustion / potential corrective bounce.
⸻
2. Technical Breakdown
🕐 Daily (D1)
• Clear bearish structure: consecutive lower highs and lower lows from ~113k.
• Price trades well below 20/50/100/200 EMAs, confirming dominant downtrend.
• Current D1 candle sitting near the prior “Sweep” zone around 83–81k.
• RSI oversold (~22–25) and MACD deeply red → trend strong but stretched; space for corrective rally before next leg down.
🕐 H1
• Price moving inside a falling channel, last swing low near 81–82k, last swing high around 88–89k.
• EMAs (20/50) below 200 EMA, slightly flattening → trend still down, momentum slowing.
• Small BOS to the upside from the last swing low, but still capped under H1 supply 84.8–85.7k.
• MACD shows bullish divergence vs the recent low → supports idea of pullback toward Fib zone before possible continuation.
🕐 15M–5M
• Intraday price is ranging 83.7–84.3k, forming minor higher lows.
• MACD positive, RSI hovering around 50 → short-term neutral / corrective phase.
• Still trading inside H1 downtrend and below intraday supply 84.8–85.2k.
⸻
3. Fibonacci Analysis
Last clear swing on H1:
• Swing High ≈ 88,700
• Swing Low ≈ 81,300
Fibonacci retracement (bearish pullback):
• 38.2% ≈ 84,120
• 50.0% ≈ 84,990
• 61.8% ≈ 85,870
🎯 Fibonacci Golden Zone: 84,100 – 85,900
This aligns with H1 supply and descending trendline → high-interest sell zone for continuation.
⸻
4. High-Probability Trade Scenarios
📉 A. Trend SELL from Golden Zone (Main Setup)
• Sell Zone: 84,500 – 85,500 (Fib 0.5–0.618 + H1 supply / trendline)
• Initial Targets:
• TP1: 83,500
• TP2: 82,500
• TP3: 81,000
• Extended: 80,600 (prior strong low)
• Stop Loss: Above 86,200
• Confirmation:
• Rejection candle / bearish engulfing in zone
• RSI H1 staying below 55 and MACD crossing back bearish.
• Idea: Primary play is to sell the corrective rally back into the golden zone in line with the dominant downtrend.
⸻
💥 B. Breakout SELL Setup (Continuation)
• Break Sell Trigger (Breaking Price):
• Clean H1 close below 83,450
• Retest Sell Zone: 83,450 – 83,800
• Targets:
• TP1: 82,500
• TP2: 81,000
• TP3: 80,600
• Stop Loss: Above 84,300
• Note: Use if price fails to reach the golden zone and instead breaks the current base directly.
⸻
📈 C. Countertrend BUY from Support (Scalp / Secondary)
• Buy Zone: 83,500 – 83,400 (top of strong support / range low)
• Targets:
• TP1: 84,500
• TP2: 85,500
• TP3: 86,800 (toward top of golden zone / trendline)
• Stop Loss: Below 82,800
• Confirmation:
• Bullish divergence on 15M/5M
• Strong wick rejection from 83.4–83.5k.
• ⚠️ Countertrend only – use reduced risk; objective is to catch corrective leg back into the golden zone.
⸻
🚀 D. Breakout BUY Setup (Structure Shift)
• Break Buy Trigger (Breaking Price):
• H1 close above 85,800 (clear break of Fib 0.618 + channel / supply)
• Retest Buy Zone: 85,800 – 86,000
• Targets:
• TP1: 87,500
• TP2: 89,500
• TP3: 91,300
• Stop Loss: Below 85,000
• Idea: This would be an early trend-change signal; only valid if volume and momentum (RSI > 60 on H1) confirm the break.
⸻
5. Fundamental Watch
• Weekend conditions → thin liquidity & gap risk between Sunday open and Monday session.
• BTC remains highly sensitive to US macro data and risk sentiment (equities, DXY, yields). Any upcoming high-impact USD events next week (CPI, PCE, Fed speakers, etc.) can accelerate either continuation or reversal.
• For swing positions, plan size so you can hold across potential gaps, or close before the weekend if uncomfortable with risk.
⸻
6. Key Technical Levels
• Resistance:
• 84,800
• 85,500–85,900 (Golden Zone upper)
• 87,500
• 90,000
• Support:
• 83,450
• 82,500
• 81,000
• 80,600 (major prior low)
• Golden Zone (Short): 84,100 – 85,900
• Break Buy Trigger: > 85,800 (H1 close)
• Break Sell Trigger: < 83,450 (H1 close)
⸻
7. Analyst Summary
• Structure from D1 to H1 is decisively bearish.
• Current consolidation around 84k looks like a pause within the downtrend, not yet a confirmed bottom.
• The highest-probability play remains selling rallies into the Fib Golden Zone (84.5–85.5k), aiming for new lows towards 82.5–81k → 80.6k.
• Countertrend buys are possible off 83.5–83.4k, but only for quick scalps with tight risk.
⸻
8. Final Bias Summary
• Bearish Bias (Primary):
• Valid while price stays below 85.7–86k.
• Prefer Sell Golden Zone and Breakout Sell < 83,450 setups.
• Bullish Bias (Alternative / Reversal):
• Consider only if H1 closes above 85,800 and retest holds.
• Then target 87.5k → 89.5k → 91.3k with higher-timeframe confirmation.
Manage risk: fixed % per trade, no over-leveraging, and be careful holding full size over the weekend gaps. 🚨
⸻
🥇 ElDoradoFx PREMIUM 3.0 – PERFORMANCE 21/11/2025 🥇
🔥 Precision • Momentum • Profit
━━━━━━━━━━━━━━━
📊 XAU/USD – DAILY RESULTS
🟢 BUY +50 PIPS
🔻 SELL +20 PIPS
🟢 BUY +210 PIPS
🟢 BUY +210 PIPS
🟢 BUY +20 PIPS
❌ SELL -40 PIPS (SL)
🟢 BUY +220 PIPS
🔻 SELL LIMIT +210 PIPS
━━━━━━━━━━━━━━━
🔝 SWING TRADES – STILL RUNNING
📈 BUY → +2,850 PIPS
📈 BUY → +1,320 PIPS
━━━━━━━━━━━━━━━
💰 TOTAL PIPS GAIN: +900 PIPS
🎯 8 Signals → 7 Wins (1 SL)
🔥 Win Accuracy: 88%
━━━━━━━━━━━━━━━
Strong close to the week — perfect blend of scalps, intraday setups, and powerful swing continuation!
Congrats if you profited — PREMIUM 3.0 keeps delivering results! 🚀💰
— ElDoradoFx PREMIUM 3.0 Team 🚀

BitcoinBTCUSD
- Fair Value Gap
- Change of Characteristics
- Order Block
- Rising Wedge as an corrective pattern in Long Time Frame
- Demand Zone

#BTCUSDT: From $74,000 to $88,000 Moving Well! More Growth CominIt’s been on a steady climb from $74,000 to $88,000. We’re expecting even more growth in the coming weeks. The price has finally broken free from its consolidation phase and is now on the rise. We think it’ll reach $94,000, then $100,000, and maybe even go up to $120,000 by the end of the year.
What do you think? Let me know in the comments below!
Thanks!
Team Setupsfx_

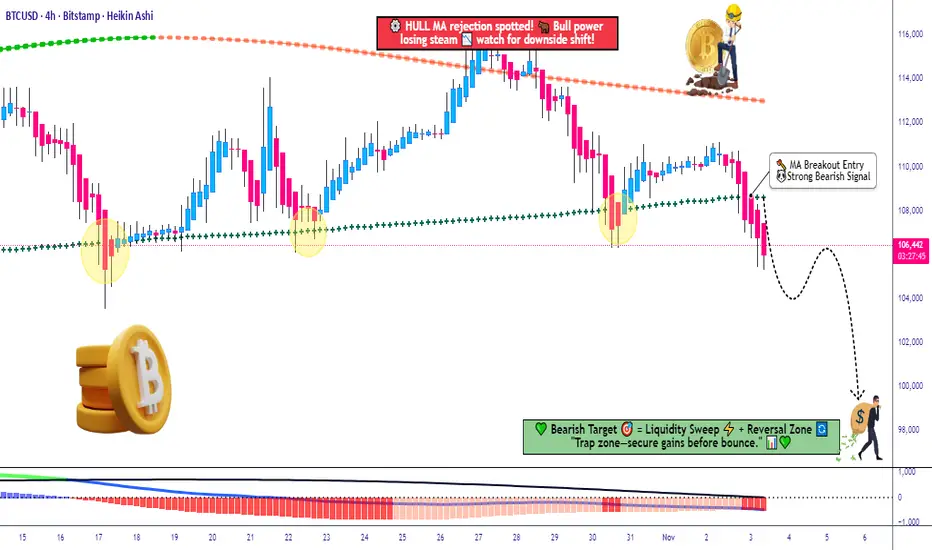
BTC/USD Breakdown Alert — MA Cross & MACD Flash Warning!💰 BTC/USD — “BITCOIN vs U.S. DOLLAR” | Crypto Market Capital Flow Blueprint (Swing Trade)
🧭 Market Overview
The king of crypto 👑, Bitcoin, is showing signs of fatigue at the top. After a solid bull sprint, we’re spotting bearish confirmation on multiple signals — a clean moving average breakout and a MACD divergence to the downside.
Looks like the market’s whispering, “It’s time for a cool-down, mate.” 😏
🎯 Trade Plan (Swing Setup)
Plan: ✅ Bearish plan confirmed — waiting for continuation pressure below structure zones.
Entry Strategy (Thief Layer Method 🕵️♂️):
Using layered limit sell orders — a signature “Thief Strategy” style of scaling in with patience, precision, and a bit of chaos theory.
Sell Limit Layers: 110,000 💸 → 108,000 💸 → 106,000 💸
(You can expand the layer grid as per your risk model.)
Stop Loss: 112,000 — positioned above the previous Higher High (HH) structure.
📝 Note: Dear Ladies & Gentlemen (Thief OG’s), I’m not recommending you to stick to my SL. Manage risk your way — you make money, you take money. 💼
Target: 98,000 — based on strong support, oversold confluence, and a potential liquidity trap zone below.
📝 Note: Same rule — take profits where it makes sense for you. The trap is the escape; don’t overstay the party. 🎭
🔍 Technical Confluence Highlights
📉 MA Breakout: Bears gaining control after crossover rejection.
📊 MACD Divergence: Weak momentum confirmed — watch histogram fade.
Structure Check: Market respecting descending trendline — sellers defending upper zone.
🧩 Momentum Flow: Smart money possibly rotating out of BTC into defensive assets.
🌍 Correlated Pairs to Watch
Keep an eye on these related assets for directional cues and correlation strength:
BITSTAMP:ETHUSD (Ethereum) — often mirrors BTC’s moves with higher beta.
TVC:DXY (U.S. Dollar Index) — rising DXY can pressure BTC.
PEPPERSTONE:NAS100 (NASDAQ 100) — tech sentiment affects BTC risk appetite.
CRYPTOCAP:BTC.D (Bitcoin Dominance) — watch if altcoins start outperforming.
✨ “If you find value in my analysis, a 👍 and 🚀 boost is much appreciated — it helps me share more setups with the community!”
#BTCUSD #Bitcoin #CryptoMarket #SwingTrade #TechnicalAnalysis #ThiefStrategy #BearishSetup #CryptoTrading #MarketFlow #LayeredEntries #SmartMoney #TradingView #EditorPickCandidate #BTCAnalysis
#BTCUSDT:Last Drop at 98K Before Hitting 140K?Bitcoin dropped significantly after reaching a record high of 125k. This comes after we announced a 100% tariff on China, creating fear in the global market, especially among crypto investors. We can now see a clear pattern forming, the AB=CD pattern, which is likely what others are also seeing.
Good luck and trade safely!
Team Setupsfx_

ElDoradoFx – BTCUSD WEEKEND ANALYSIS (01/11/2025)
🧭 1️⃣ Market Overview
Bitcoin has entered a consolidation phase following rejection near 111,600. Despite the weekly bearish close, price remains above key structural support around 108,600 and the long-term 50 EMA. The medium-term trend is corrective but still sits within a larger macro uptrend. Bulls must defend 109,600–109,900 and break 111,000 to regain control, while bears look for continuation below 109,500.
⸻
📊 2️⃣ Technical Breakdown
✅ Weekly (W1)
• Structure: Macro bullish, currently retracing within an ascending channel.
• Support zone: 108,000–105,000 (major demand + EMA confluence).
• RSI: 51 – neutral midrange; momentum slightly cooling.
• MACD: Weak bearish histogram, suggesting temporary correction.
→ Interpretation: Still structurally bullish unless 108,000 breaks.
✅ 1-Hour (H1)
• Price consolidating between 111,000 resistance and 109,600 support.
• EMAs (20–50–200) compressing — breakout imminent.
• RSI hovering near 54; momentum neutral.
→ Interpretation: Breakout from triangle formation expected; direction depends on 111,000 or 109,600 break.
✅ 15M–5M (Intraday)
• Multiple BOS events show mixed order-flow.
• RSI showing mild bullish divergence from 109,800 lows.
• MACD flattening – low volatility phase before expansion.
→ Interpretation: Expect liquidity sweep before directional push.
⸻
📐 3️⃣ Fibonacci Analysis
Swing Range: 108,605 → 111,611
Level Price Observation
38.2% 110,493 EMA alignment + intraday support
50.0% 110,108 Structural midpoint
61.8% 109,723 Trendline + liquidity pool
✅ Golden Zone: 110,493 – 109,723
→ High-probability buy zone aligned with EMA50 (H1).
⸻
🎯 4️⃣ High-Probability Trade Scenarios
🟢 BUY SCENARIOS (Primary Bias)
Scenario A – Breakout Continuation
• Trigger: Break & retest above 111,000–111,100
🎯 TP1 → 111,600 TP2 → 112,000 TP3 → 112,500
🛑 SL → Below 110,400
Scenario B – Golden Zone Dip Entry
• Trigger: Bullish rejection inside 110,493–109,723
🎯 TP1 → 111,000 TP2 → 111,600 TP3 → 112,000
🛑 SL → Below 109,300
⸻
🔻 SELL SCENARIOS (Alternative)
Scenario A – Breakdown Confirmation
• Trigger: Break & retest below 109,600–109,900
🎯 TP1 → 108,900 TP2 → 108,200 TP3 → 107,600
🛑 SL → Above 110,200
Scenario B – Rejection from Resistance
• Trigger: Bearish engulfing at 111,600–111,800
🎯 TP1 → 110,500 TP2 → 109,800
🛑 SL → Above 112,000
⸻
🕐 5️⃣ Fundamental Watch
• DXY stable near 104.9; neutral macro tone.
• US equities consolidating; crypto sentiment balanced.
• No major weekend news – expect liquidity-driven volatility.
• ETF and halving expectations continue to support long-term bullish bias.
⸻
⚙️ 6️⃣ Key Technical Levels
Type Levels
Resistance 111,000 / 111,600 / 112,000
Support 110,100 / 109,600 / 108,600
Golden Zone 110,493 – 109,723
Breakout Confirmation Above 111,100 or Below 109,600
⸻
🧾 7️⃣ Analyst Summary
BTC remains within a corrective structure but is positioned near equilibrium. Bulls retain the advantage above 110,000, targeting a clean breakout toward 112,000+, while sellers only gain momentum on a confirmed close below 109,600. The Golden Zone (110,493–109,723) is the highest-probability buy area, providing both trendline and EMA confluence.
⸻
📈 8️⃣ Final Bias Summary
🟢 Bullish above 110,000 → Targets 111,600 / 112,000
🔻 Bearish below 109,600 → Targets 108,800 / 108,000
⸻
🥇 ElDoradoFx PREMIUM 3.0 – PERFORMANCE 31/10/2025 🥇
📅 Closing the month with precision and momentum.
━━━━━━━━━━━━━━━
❌ ASIA SELL LIMIT -60 PIPS (SL)
🟢 BUY +150 PIPS
🟢 BUY RE-ENTRY +150 PIPS
🟢 BUY +320 PIPS
🔻 SELL +30 PIPS
🟢 BUY +100 PIPS
🟢 BUY +150 PIPS
━━━━━━━━━━━━━━━
💰 GOLD TOTAL PIPS WON: +840 PIPS
📊 7 Trades → 6 Wins | 1 SL
🎯 Accuracy: 86%
━━━━━━━━━━━━━━━
🔥 Strong finish to the month — bullish follow-throughs and precise timing on entries delivered another profitable session!
👏 Congratulations if you profited! ✅✅✅🚀🚀🚀

#BTCUSDT(BITCOIN): Swing Buy, Price Heading Towards Previous HH!Bitcoin is nearing a previous high of 126K. As of the latest data, it trades around 112K, with a 24-hour volume of $38 billion and a market capitalisation of $2.1 trillion. However, before reaching that level, it’s likely to correct towards our entry zone between 108K and 110K. This level is significant because we anticipate a substantial increase in market volume. Historical data shows that similar corrections have led to a 15–20% increase in trading activity.
On-chain metrics indicate a 7% rise in active wallets over the past week, and institutional inflows totalled approximately $1.3 billion in the last seven days. The Bitcoin dominance index currently sits at 54%, suggesting continued interest despite broader market fluctuations.
This short-term view allows us to observe the price accumulating and on the verge of distribution. Based on your trading style, you can select one of three targets:
- Target 1: 118K (conservative)
- Target 2: 122K (moderate)
- Target 3: 126K (aggressive)
We wish you the best of luck and trade safely. If you find our work helpful, please like and comment on our ideas.
Team Setupsfx_
