High-level fluctuations, BTC short-term trading arrangements#BTCUSD
After BTC started to rise from 113500, it continued to fluctuate and consolidate at a high level, and is also waiting for the specific basis point of the Federal Reserve's interest rate cut. In the short term, BTC is experiencing a retracement. Aggressive traders can consider trying to arrange long orders at 115500-115000. Once it falls below 115000, SL is carried out in time, with the target looking at 116500-117500.
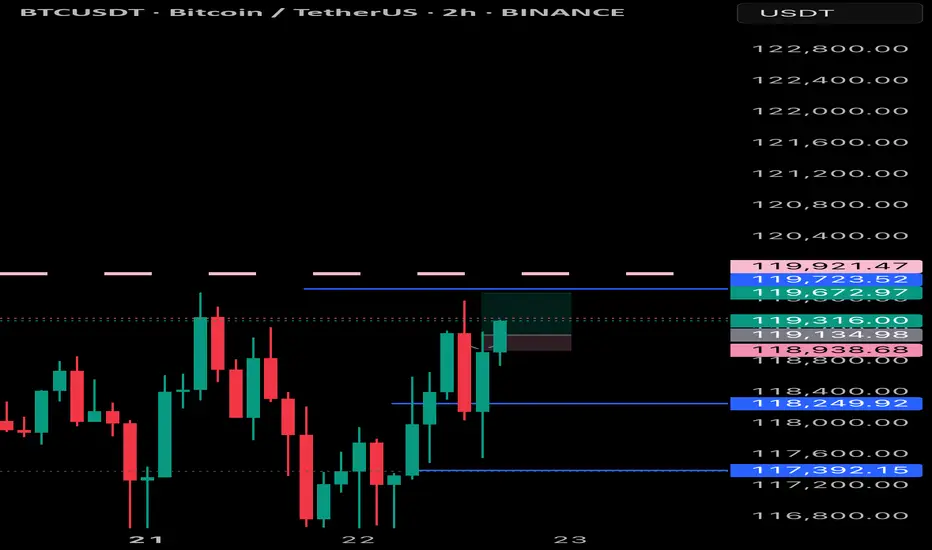
Btcusdtrading

BTC/USD 15/09/2025: Bullish Setup Awaits Fed DecisionHey TradingView traders! On September 15, 2025, Bitcoin is chilling around 115,491 - 116,009 USD with slight volatility (+0.11% to +0.25% in the last 24 hours). The market vibe is neutral, but could this be the calm before the storm as we await the Fed’s interest rate decision this week? Let’s dive into a detailed analysis to help you seize the opportunity! 💰
Market Overview: Stable but Packed with Potential
BTC continues to dominate with a market cap of 2.31 trillion USD, ruling the crypto space. 24-hour trading volume hits 33.29 billion USD (+4.72%), signaling steady investor participation but not enough for a strong bullish push yet. Circulating supply stands at 19.92 million BTC (94.86% of the 21 million total), easing internal inflationary pressure and supporting long-term value. What do you think—can BTC maintain its 92.27% yearly gain? Drop your thoughts in the comments! 📊
Technical Analysis: Double Bottom and Bullish Channel Heating Up
Support & Resistance Levels: Solid support at 114,000 - 115,000 USD (holding strong since early September). Nearest resistance at 116,000 - 116,500 USD—if broken, the next target is 120,000 USD! Failure to break could lead to a retest of 114,000 USD. Don’t miss a potential breakout! ⚠️
Trend: The market is forming a double bottom pattern from September’s low, with the bullish channel still intact. The Fear & Greed Index at 53-55 (Neutral) shows balanced investor sentiment—no excessive FOMO or panic. RSI is neutral, MACD slightly weakening, but the overall signal is “Buy” for the daily timeframe! 📉
Macro Factors & News: Is the Fed the Final Boss?
The market is holding its breath for the Fed’s expected 0.25% rate cut this week—if it happens, risk-on capital could flood into BTC like a waterfall! 🌊 On the bullish side: Billionaire Tim Draper is pushing for wider BTC adoption, predicting 250,000 USD by the end of 2025; Capital Group turned a 1 billion USD investment into 6 billion USD in profits. But watch out for whale dumps and weak altcoins (e.g., SHIB down 3.22%)—these could drag BTC down. Are you ready for the volatility? 🔥
Forecast & Trading Plan: Action Time for Traders
Short-Term (1-7 Days): Expect a range of 114,000 - 117,000 USD, with the Fed decision as the key catalyst. If rates are cut, BTC could test 120,000 USD; otherwise, there’s a risk of dropping to 114,000 USD. Probability of a rise: 60% if it holds above 115,000 USD—perfect time to go long! 📈
Long-Term (2025-2030): Strongly bullish! Changelly predicts 116,220 USD today, climbing to 117,978 USD tomorrow; Investing Haven sees stability around 116,087 USD. With the previous halving and institutional accumulation, BTC could surpass 200,000 USD by year-end. Diversify your portfolio to manage risks, though! 💡
Traders, it’s time to act! Keep an eye on the BTC/USD chart on TradingView and share your thoughts in the comments. DYOR and trade safely! 👍
#Bitcoin #BTCUSD #CryptoAnalysis #TradingView #FedRateCut #BullishBTC #Crypto2025 #Altcoins #WhaleWatch #FearAndGreed

BTC/USD Bullish Order Block Setup – Targeting 114,328BTC/USD (1H) Analysis
Trend & Structure: Price has been respecting a rising channel with clear support and rejection lines. After testing the support line, it rebounded and is now consolidating.
EMA Strategy: Price is fluctuating around the 70 EMA (111,081) and 200 EMA (110,902), showing short-term consolidation. A bullish crossover above 70 EMA may confirm further upside momentum.
Order Block (OB) Zone: The marked OB Buying Zone (109,261 – 110,252) is a strong demand area where buyers are expected to step in.
Support & Resistance: Support lies at 109,261, while the next resistance/target is 114,328.
Risk-Reward Strategy: A potential long entry from the OB zone offers a favorable R:R ratio toward the 114,328 target point. Stop loss ideally below 109,246.
Price Action: Recent wicks suggest rejection of lower levels, strengthening the bullish bias.
✅ Signal: Buy from OB Buying Zone (109,261 – 110,252)
🎯 Target: 114,328
🛑 Stop Loss: Below 109,246
Overall Bias: Bullish continuation if price respects the OB buying zone and EMA support.

Precise Prediction and Forecast for BTCUSD MarketYesterday, we accurately predicted that BTC would rally to around 116,000 USD and face certain resistance. Today, after breaking through 116,000 USD as expected, the price retraced to hover around 115,000 USD.
Looking ahead, if BTC can stabilize near the 115,000 USD level, it is highly likely to continue its upward trajectory, with the potential to retest the 120,000 USD mark. For upper resistance, the focus remains on the 117,000–118,000 USD range
Buy 114000-114500
TP 115000-116000-1175000
Daily-updated accurate signals are at your disposal. If you run into any problems while trading, these signals serve as a reliable reference—don’t hesitate to use them! I truly hope they bring you significant assistance

BTC/USD – FVG Buy Zone Setup Targeting $113KChart Overview (BTC/USD 30m)
Price is currently trading at $110,517.
EMA 70 (111,276) above price → short-term bearish.
EMA 200 (110,598) acting as immediate support zone.
📐 Trend & Channel Strategy
Market is moving inside an ascending channel (support & projection line).
Price recently retraced to the support line → potential bullish continuation.
🎯 Supply & Demand / FVG Strategy
FVG Buying Zone: $109,583 – $110,217 highlighted (strong demand zone).
Entry around this zone expected to trigger a bullish reaction.
📊 EMA Crossover Strategy
EMA70 > EMA200 previously → bullish structure.
Current retest of EMA200 is key → holding above signals continuation to upside.
💎 Price Action Strategy
After strong drop, price tapped into support + FVG zone.
Wick rejection suggests buyers stepping in.
🎯 Target & Risk Management
Target Point: $113,053 – $113,064.
Stop Loss: Below $109,583 (to protect against breakdown).
Risk/Reward ratio looks favorable (approx. 1:3).
✅ Conclusion:
BTC is in an uptrend channel. After retesting the FVG buying zone & EMA200, buyers are likely to push price back toward $113,000 target 🚀📈. A break below $109,583 would invalidate this bullish setup.

#BTC/USDT Bullish Divergence on 1H, Low Risk Trade#BTC
The price is moving within a descending channel on the 1-hour frame, adhering well to it, and is poised to break it strongly upwards and retest it.
We have a bearish trend on the RSI indicator that is about to be broken and retested, supporting the upside.
There is a major support area in green at 108062, which represents a strong basis for the upside.
For inquiries, please leave a comment.
We are in a consolidation trend above the 100 Moving Average.
Entry price: 108450
First target: 108959
Second target: 109541
Third target: 110325
Don't forget a simple matter: capital management.
When you reach the first target, save some money and then change your stop-loss order to an entry order.
For inquiries, please leave a comment.
Thank you.

BTCUSDBTCUSD is about to get ready for an upside, wait for a setup before you jump in.
Disclosure: We are part of Trade Nation's Influencer program and receive a monthly fee for using their TradingView charts in our analysis.

BTC/USD Supply Zone Rejection Setup This BTC/USD 30-min chart shows price climbing within a rising channel toward a POI Supply Zone (114,201 – 114,940 USD). The market is respecting both the support line and rejection line while trading above the EMA 70 (111,733) and EMA 200 (112,102), indicating bullish momentum in the short term.
Key Analysis Using Strategies:
Trend/EMA Strategy: Price is above both EMAs, signaling bullish continuation until the supply zone.
Channel Strategy: Price is moving inside an ascending channel; upper channel resistance aligns with the supply zone, suggesting potential reversal.
Supply & Demand: Strong supply zone at 114,201–114,940 is the key resistance area to watch for rejection.
Price Action: After breakout from EMA and minor consolidation, price shows bullish structure with higher highs and lows.
Risk Management: Possible short entry at supply zone (114,201–114,940) with stop-loss above 114,940, and targets near 112,100 and 109,000.
📌 Summary: Short-term bullish toward supply zone, but a potential bearish reversal setup forms at 114,201–114,940 if rejection occurs, with downside targets around 112,100 → 109,000.

Bitcoin - The magical $1.000.000 level!🚀Bitcoin ( CRYPTO:BTCUSD ) is not done yet:
🔎Analysis summary:
Over the course of the past couple of months, we have been witnessing a bullish continuation on Bitcoin. After the all time high breakout, there is a high chance that this bullrun will continue and Bitcoin might even retest the resistance trendline at seven digits in the near future.
📝Levels to watch:
$1.000.000
SwingTraderPhil
SwingTrading.Simplified. | Investing.Simplified. | #LONGTERMVISION

BTC/USD Bearish Retest Setup – Eye on 106.6K TargetTrend: BTC is in a downtrend channel (rejection line above, support line below).
EMA Signals: Price is trading below EMA 70 & EMA 200 → bearish bias remains strong.
Supply & Demand:
Support zone: around 112,000 – 112,500 (price just bounced).
RBR Supply zone: 114,300 – 116,000 where sellers are likely waiting.
📊 Strategies in play
Support–Resistance: Bounce at support, retest expected at supply zone.
EMA Strategy: Bearish since candles trade under 200 EMA.
Break & Retest: Price could retest supply before resuming drop.
Target Projection: If rejection at supply holds, target = 106,600 zone (chart target point).
⚖️ Risks
A clean break above 116,000 would invalidate bearish setup and open room for reversal.
Range trading possible between 112k–116k before breakout.
✅ Summary: BTC short-term bias remains bearish. Expect retest of 114.3k–116k supply before continuation lower toward 106.6k target. Only a strong breakout above 116k flips the trend bullish.

BTC recently broke through the descending channel Market picture and sentiment
The price is trading around $114,942, down slightly by about -0.65% on the day. Daily range: high - $115,833, low - $114,583.
The medium-term and long-term trend remains bullish, supported by large capital infusions (ETFs, institutional purchases).
Bernstein analysts suggest that the current bull rally could last until 2027, which is significantly different from the usual four-year cycles.
Support and resistance levels
Resistance:
The nearest zone is $120K-121K, where growth was expected to slow and consolidation.
The long-term target is $135K, and even $150K by 2026, according to analysts' forecasts.
Support:
Multiple bounce point at $110K–112K is critical to maintain bullish momentum.
Nearest technical support at $111.9K, followed by $107.4K and $105.2K.
Technical Momentum and Structure
Consolidation is seen around $113.8K, with volumes rising (to $48B), signaling pent-up interest despite short-term fatigue.
BTC recently broke out of its downward channel, a positive sign. RSI remains favorable, and declining balances on platforms indicate institutional accumulation.
A breakout of $114K could trigger upside potential to $143K (25%) and further to $200K, according to Rosenberg Research.

BTC/USD Bullish Breakout Toward 124K🔎 Chart Analysis
1. Support & Resistance Zones
Support Zone: Around 113,600 – 115,000, holding price from further downside.
Resistance Zone: Around 116,000, where price faced rejection previously.
2. Trend Structure
The price has broken out of the descending channel (rejection line & support line).
This breakout suggests a bullish reversal signal.
3. Moving Averages (EMA)
EMA 70 (~115,080) and EMA 200 (~116,182) are converging.
If the price sustains above EMA 200, it will confirm a bullish continuation.
4. Candlestick Price Action
Recent bullish engulfing from support zone strengthens the case for upward momentum.
Consolidation near resistance indicates accumulation before a breakout.
5. Target Projection
If breakout above resistance is successful, target lies around 124,449 – 124,484 (next major resistance level).
📌 Trading Plan (Example)
Entry: Around 115,260 – 115,600 (after confirmation above EMA 200).
Stop Loss: Below 113,600 (support zone).
Target: 124,449 – 124,484.
⚡ Summary
Bitcoin is showing signs of a bullish breakout from a descending channel. If price sustains above the resistance and EMA 200, a strong move toward 124K is likely. The support at 113,600 remains a critical invalidation level.

Bitcoin: Confident Breakout of $120K — Targets of $125–$135K!• The trend remains bullish: Bitcoin is trading above $117K–118K, has updated its maximum to $124K. Steady growth is supported by growing institutional investments and a softening regulatory environment.
• Key levels:
- Support: $110K–112K — fundamental holding zone. :contentReference
- Resistance*: $120K–123K. A breakout with volume will open the way to $125–134K.
• Technical signals:
- Short-term consolidation after growth of almost 4% — natural rest before the next rebound.
- If BTC consolidates above $125K, there is potential up to $150K.
Bottom line: Bitcoin is demonstrating a consistently bullish sentiment. Holding above $110-112K is critical, a breakout of $120-123K is a signal for growth to $125-134K, and with strong dynamics - to $150K.
Recommendations:
- Buy on dip around $112-115K with targets of $125K+
- Breakout entry** when consolidating above $123K, targets $125-134K
- Stop-loss: slightly below $110K

BTCUSD:The meeting will likely impact further declines.Amidst uncertain news, BTCUSD is less favored than XAUUSD. After the Asian market opened, BTCUSD experienced a significant drop, exceeding 3000p. Assuming the meeting has not concluded, uncertainty will cause BTCUSD to fall further. Short-term short selling is likely to continue.

Bitcoin Setup: Long Entry Around $115-116K Area | 5:1 R/R Trade📊 If price drops into the white boxed area, I'm looking for a long entry.
But… there's a chance we sweep the lows near $115,555 first before moving up — so avoid blind limit buys. I'll wait for a reaction at the yellow line before entering.
🎯 I'm expecting price to hunt for liquidity around the white box area — essentially targeting stop losses from less experienced traders — before making its move higher.
This isn't necessarily based on strict technical logic, but rather from years of trading experience watching how these patterns typically unfold.
⚠️ **Setup is invalid if:**
• Move happens before this week's weekly candle closes
• Price breaks below the white box
• Price pumps without returning to the box
🚀 If we get this move early next week, I'm targeting at least the blue circled zone.
ATH is possible, but conservatively I'll take profits there.
📈 This trade setup offers a risk-to-reward ratio of 5:1. Without including fees, the breakeven win rate for this trade would be approximately 16.67%.
Knowing these figures in advance helps me avoid emotional trading.
💡 If you often find yourself trading based on emotions, I recommend doing this type of pre-planning and quantifying your setups before execution — it can be a simple yet highly effective improvement.
---
**Trading is simple.** You don't need multiple indicators or dozens of lines on your chart. A clean and simple chart often works best — it keeps your decisions consistent and reduces uncertainty.
Sure, it might not look flashy, and my analysis may seem a bit "plain" compared to others… but that's how I like it.
If you find this analysis useful, feel free to follow me for more updates.
---
*Disclaimer: This post is for general informational and educational purposes only. It does not constitute financial advice, investment recommendation, or a service targeting specific investors, and should not be considered illegal or restricted information in any jurisdiction.*

BTCUSD: buyBTCUSD's performance is consistent with my expectations. It has rebounded slightly from the bottom and is currently trading at 118,200, representing an overall rebound of approximately 1,000p. Based on the trend, it's still at the bottom. It's still a safe bet to buy.
There was no major news in the market over the weekend that had an impact on trading products. While the meeting news wasn't clearly positive or negative, there was some progress in increasing holdings in the world's largest gold ETF, increasing by approximately 4 tons compared to the previous day. Furthermore, the Federal Reserve's interest rate decision will be announced next week. These two factors appear to be influencing gold prices and warrant our attention.
BTCUSD traders can choose to take some long positions during the holiday. Gold traders can enjoy the holiday and revisit more trading opportunities next week.

BTCUSD: BUYBTCUSD's performance over the weekend was very weak, with fluctuations of only about 1,000p. However, it is currently in the process of bottoming out, and a rebound is possible at any time. Therefore, despite the sluggish market over the weekend, investors who want to trade can still choose to buy BTCUSD and profit.

BTCUSD declined. What's next?BTCUSD declined. What's next?
Since the last report, bitcoin experienced significant decline on 3% from 122,000.00 without any significant reasons. Highly possible, that it is connected with profit-taking, as the price surpassed significant resistance level of 120,000.00. However, the asset reversed from the upper border of the descending channel (red color) and made another attempt to break through 120,000.00 level. Currently, the price just consolidates slightly below this level and above the average horizontal volume, according to a volume profile. In the mid-term the rise towards 130,000.00 is still expected.

Bitcoin - The cycles are playing out!⚔️Bitcoin ( CRYPTO:BTCUSD ) just repeats another cycle:
🔎Analysis summary:
Following all of the previous all time high breakouts, Bitcoin will now further extend the rally. After some simple calculation, we can see that Bitcoin will rally another +50% in order to reach the overall price target. However there will be volatility along the way so make sure to remain calm.
📝Levels to watch:
$200.000
SwingTraderPhil
SwingTrading.Simplified. | Investing.Simplified. | #LONGTERMVISION

"Bitcoin’s Big Heist – Are You In or Out?"🚨 BTC/USDT HEIST MISSION – SWIPE THE BULL RUN BEFORE THE BEARS WAKE UP 💰💣
🌟Hi! Hola! Ola! Bonjour! Hallo! Marhaba!🌟
Money Makers & Robbers, assemble! 🤑💰✈️💸
Here’s your decoded BTC/USDT “Bitcoin vs Tether” Crypto Market Heist Plan, fully loaded with Thief Trading Style 🔥 TA + FA combo. We’re prepping for a bullish breakout loot – eyes on the vault, ignore the noise.
🎯 PLAN OF ATTACK:
🎯 ENTRY (BUY ZONE):
💥 “The vault’s open—time to sweep!”
DCA/Layer your buy limit orders near the 15–30 min swing lows/highs for sniper pullback entries.
Use multi-entry method to stack positions (layering / DCA) as per your ammo (capital 💵).
🛑 STOP LOSS:
Set SL at the nearest swing low wick (4H TF) — around 115000.00, adjust based on your risk/load.
SL = insurance. Not optional.
🏁 TARGET:
Lock sights on 125000.00
🎉 Or… vanish with profits before the bear cops arrive.
🔎 MARKET BACKDROP & ANALYSIS:
📈 BTC/USDT currently signals bullish vibes on the swing/day horizon — fueled by:
Macro Fuel & Fundamentals
Sentiment Radar
COT Reports
On-Chain Pulse
Intermarket Clues
🚀 Connect the dots. The smart money's already prepping a breakout move.
🧲 Scalpers Note:
Stick to the long side only. No shorting the beast — unless you’re made of diamonds.
Secure your bag with trailing SLs.
⚠️ NEWS TRIGGER ZONE – TRADE WITH TACT:
📢 Upcoming high-volatility news events can spike charts.
Avoid new entries during releases and guard open trades with trailing SLs.
Protect the loot. Always.
💖 SUPPORT THE HEIST GANG: BOOST IT!
Smash that ❤️ to boost our thief squad’s momentum!
Every click powers this underground mission – making money with style, one pip at a time. 🎯💣💵
🚀 See you in the next heist drop.
Until then – Stay stealthy. Stay profitable. Stay legendary. 🐱👤💸🏆

BTC sounded the alarm, 115,000 became the key point#BTCUSD
Last week, as global risk sentiment deteriorated, the cryptocurrency market came under pressure, pushing BTC back from its recent highs. This correction was significant, and while BTC has subsequently rebounded, technically, the bearish divergence signaled by the daily MACD indicates weakening short-term rebound momentum. The Bollinger Bands on the 4-hour chart are trending downward, indicating that the market remains in a period of volatile correction.
If BTC cannot effectively break through the upper resistance of 115,000 in the short term, the bears may continue to exert their strength. You can consider shorting with the target at 114,000-113,000.
🚀 SELL 115,000-116,000
🚀 TP 114,000-113,000

BTCUSD IdeaWe are waiting for our asset to reach our action zone, and based on the reaction, we’ll decide on our next moves.ALWAYS WAIT FOR A CONFIRMATION TO SEE IF THE PRICE VALIDATES THE ZONE.and you what is your vision of the EURUSD its interests me! i wait you in the commentary

BTCUSD BTCUSD still expecting some good run within to the up side as there’s a new higher price that’s not been touched