#BTC/USDT is currently strongly bullish#BTC
The price is moving in a descending channel on the 1-hour timeframe. It has reached the lower boundary and is heading towards breaking above it, with a retest of the upper boundary expected.
We have a downtrend on the RSI indicator, which has reached near the lower boundary, and an upward rebound is expected.
There is a key support zone in green at 86900. The price has bounced from this level multiple times and is expected to bounce again.
We have a trend towards stability above the 100-period moving average, as we are moving close to it, which supports the upward movement.
Entry price: 87844
First target: 88166
Second target: 88596
Third target: 89133
Stop loss: Below the support zone in green.
Don't forget a simple thing: capital management.
For inquiries, please leave a comment.
Thank you.
Btcusdtshort

BTC/USD Analysis – December 24, 2025HI!
Bitcoin is showing signs of potential bearish pressure, but confirmation will depend on how price behaves around the critical support zone.
Key Observations:
Critical Support Zone: The blue area on the chart (~$78k–$79k) represents a major support level. A breakdown below this zone could trigger further downside, with the first target around $72k and a final target near $66k. Until this support is decisively broken, the bearish scenario remains unconfirmed.
Recent Price Action: A strong drop occurred recently, followed by only a 33% corrective retracement, indicating limited bullish momentum.
Bearish Patterns:
Cup Formation: The chart shows a clear cup pattern, which historically can precede further consolidation or downside in a bearish context.
Weekly Trendline Break: On the weekly timeframe, the trendline has been broken down, suggesting a potential shift in overall market sentiment.
Conclusion:
BTC appears poised for further downside, but traders should wait for a confirmed break below the critical blue zone before entering bearish positions. If this support fails, we could see the next targets around $72k and $66k. Until then, the market remains in a cautious state.
Trading Plan:
Bearish Confirmation: Only if $78k–$79k support is broken.
Targets on Breakdown: $72k (first), $66k (final).
Disclaimer: As part of ThinkMarkets’ Influencer Program, I am sponsored to share and publish their charts in my analysis.

BTCUSD:Bearish Bias with ConsolidationToday, BTCUSD is in a downtrend - dominated consolidation pattern, trading sideways after failing to hold gains above 89000 and dropping to test the 85000 key support zone. The price dipped to a low of 85055 in the early session then rebounded, with upside momentum curbed by persistent selling pressure and weak risk appetite. Key drivers include EMA50 dynamic resistance, RSI still in a weak range, and institutional caution (ETF outflows), pushing the market into a technical defensive phase where 85000 acts as the bull’s critical short - term lifeline.
Core Price Zones:
Resistance:88500 - 89000 (intraday first resistance), 90000 (psychological + trend - line resistance), 92000-94000 (mid - term target)
Support:85000 - 85500 (Fibonacci 0.786 retracement + dense trading zone), 84000 (intraday low), 80000-82000 (major support cluster)
Trading Strategy:
Buy 85000 - 85500
SL 84300
TP 86500 - 87500 - 88500
Sell 88500 - 89000
SL 89700
TP 87000 - 86000 - 85000

BTCUSDT 30M Analysis – Liquidity, Reversal & Retest AnalysisBTCUSDT (Bitcoin Perpetual) – 30M Liquidity, Reversal & Retest Analysis
This 30-minute BTCUSDT perpetual chart presents a clean smart-money narrative, showing how price reacted from a discount reversal zone and is now approaching a major supply / decision area where the next directional move will be defined.
Strong Sell-Off & Liquidity Flush
On the left side of the chart, Bitcoin experiences a sharp bearish impulse, breaking market structure and accelerating to the downside. This move is aggressive, emotional, and volume-driven — a classic liquidity flush designed to trigger panic selling and stop-losses from late buyers.
This impulsive drop sets the stage for a potential mean reversion rather than continuation.
Discount Reversal Zone Reaction
Price taps into a clearly marked Reversal Zone near the lows. This area aligns with:
Discount pricing
Prior demand
Sell-side liquidity being fully taken
The reaction is immediate and strong, confirming institutional buying interest. Long wicks and strong bullish candles indicate absorption of selling pressure and the beginning of a controlled recovery.
Shift in Market Structure (Internal BOS)
Following the bounce, BTC prints a clean bullish impulse, breaking internal lower highs. This suggests a short-term shift in structure, transitioning from bearish continuation to bullish corrective or reversal mode.
This move is not random — it is technically supported by liquidity and structure alignment.
Approach Into Supply / Premium Zone
Price is now rallying directly into a previous supply / resistance zone, highlighted in green. This area previously caused strong selling pressure and is considered a premium zone where smart money typically looks for shorts, not fresh longs.
The chart clearly notes:
Volume Burst expected on first touch
Retesting phase inside the zone
Need for a bearish confirmation pattern
This means buyers are likely pushing price up to distribute positions, while sellers wait for confirmation to enter.
Key Scenario Expectations
At current levels, BTC is at a make-or-break zone:
Bearish Scenario (High Probability):
If price forms rejection wicks, bearish engulfing, or lower timeframe structure breaks, this zone can act as a distribution area, leading to a pullback or deeper correction.
Bullish Continuation Scenario:
A strong 30M close above the supply zone with sustained volume would invalidate the short idea and open the path toward higher liquidity targets.
Until confirmation appears, patience is critical.
Trading Psychology Insight
This chart reflects a common trap:
Retail traders chase the bullish move after a strong bounce, while smart money waits at premium levels to fade the rally. The note “Need Any Bearish Pattern” reinforces the importance of confirmation over prediction.
Overall Bias
Short-term: Bullish correction
Current zone: High-risk longs / potential short setup
Best strategy: Wait for bearish confirmation inside supply
Market behavior: Liquidity-driven, not trend-driven
Final Thought
This BTCUSDT setup is a textbook example of buying fear at discount and selling strength at premium. The next move will not come from guessing — it will come from reaction and confirmation at this key zone.
⚠️ Always manage risk and wait for confirmation. This is a technical perspective, not financial advice.

BTCUSD: weak oscillating patternToday, BTCUSD has extended its correction trend that started in October, exhibiting a weak oscillating pattern. Prices have been range-bound around the core zone of $85,000–$86,000. Following the flash crash after the price challenged the $90,000 level, the pair is now lingering near the critical support at $85,000, with bears firmly in control of the market.
Support Levels:
$85,000 serves as the current core lifeline. This level corresponds to the 0.786 Fibonacci retracement of the uptrend that began in April. A daily close below this threshold will most likely trigger a new round of panic selling, opening the door to the next support zone of $78,000–$80,000. In the short term, a weak support has formed around $86,000, though its effectiveness has already been undermined. From the perspective of the daily EMA indicator, $85,000 also coincides with the EMA 400 level, further underscoring its significance as a support level.
Resistance Levels:
For any short-term rebound, the primary resistance zone lies at $87,000–$88,000, with $87,200 and $87,500 as key intraday resistance points. Stronger resistance is concentrated at $91,000 (the midpoint of the previous consolidation phase) and $94,700. Additionally, the descending trend line from the October high has formed a robust resistance barrier. Without the support of large-scale spot buying, it will be difficult for any rebound to break through these levels.
Trading Strategy:
Sell 86500–87000
SL 87500
TP 85000 - 84000 - 83000
Buy 85000 - 85200
SL 84500
TP 86000 - 86500 - 87000

BTCUSDT: Bearish Wave 5, Setting a Path to Under 70,000?Hey Realistic Traders!
“Bitcoin Is Riding Bearish Reversal Momentum, Is a New Lower Low on the Horizon?”
Let’s dive into the technical analysis to answer this question and see what the chart is really telling us.
Technical Analysis
On the daily chart, BINANCE:BTCUSDT has moved below the EMA200 line. Each rebound has failed to break above, and price has rarely even touched the EMA200, reinforcing the strength of the broader bearish trend.
During the Wave 4 formation, BTCUSDT consolidated within a rising wedge pattern, a corrective structure that typically appears as upside momentum weakens within a larger downtrend. A decisive breakdown from this pattern signals renewed bearish pressure and often marks the beginning of Wave 5 in Elliott Wave theory.
Following the breakdown, a bearish MACD crossover occurred, adding confirmation to the bearish bias. Together, these signals strengthen the view that momentum is shifting back in favor of the bears.
Based on Fibonacci projections, Wave 5 may extend toward the 0.786 Fibonacci ratio, aligning with the second downside target near 66,450. Before reaching that level, price may encounter a historical support zone around the first target at 72,464, where a temporary pullback could occur.
This bearish wave count remains valid as long as price stays below the stop-loss level at 95,596 . A move above this level would invalidate the potential Wave 5 formation and shift the outlook back to neutral.
Support the channel by engaging with the content, using the rocket button, and sharing your opinions in the comments below 🚀
Disclaimer:
Please note that this analysis is solely for educational purposes and should not be considered a recommendation to take a long or short position on Bitcoin.

BTCUSD Rebound & ConsolidationToday, BTCUSD is experiencing a narrow-range consolidation following a oversold rebound. Despite bouncing roughly 3% from its overnight low, the bearish structure on the daily timeframe remains intact. Market sentiment stays cautious, and the short-term trend will still hinge on the defense of key price levels and upcoming macroeconomic data releases.
The November U.S. nonfarm payroll data delivered a strong headline but weak internals outcome. It neither altered market expectations for the Federal Reserve’s monetary policy nor provided clear unilateral guidance. Meanwhile, year-end institutional settlements have triggered liquidity tightening, coupled with a slowdown in stablecoin growth, which has weighed on Bitcoin’s short-term risk appetite. Additionally, expectations surrounding the Bank of Japan’s interest rate hike remain uncertain—an unexpected 50-basis-point rate hike could spark a fresh round of correction in Bitcoin prices.
On the support front, the $85,000–$86,000 zone serves as the core support range. This level not only marks the early November low but also encompasses the average cost basis of U.S. spot Bitcoin ETFs. Approximately 400,000 BTC were purchased within this range, making it a robust structural support for the year. A breakdown below this zone would open the door to a further decline toward $80,000–$82,000.
For resistance, the initial hurdle lies at $88,000–$88,500 (yesterday’s rebound peak), with further resistance at $89,700–$90,500. A decisive breakout above this upper resistance band would pave the way for a potential rally toward $94,000.
In summary, BTCUSD is likely to trade within the $85,000–$94,000 range in the short term. Going forward, focus should be placed on the U.S. inflation data and remarks from Federal Reserve officials scheduled for Thursday. Ahead of the release of these key data points and policy signals, the market will most likely adopt a wait-and-see stance, with prices lacking a clear directional bias.
Trading Strategy:
Buy 86000 - 86500
SL 85500
TP 87500 - 88000
Sell 88000 - 88500
SL 89000
TP 86000 - 85500

BTCUSDT Analysis: Support Turns Resistance + Next Move LoadingBTCUSDT (Bitcoin) – Intraday Price Action Analysis
This chart presents a clear intraday structure shift on Bitcoin, highlighting how price is currently reacting around a major Support–Resistance Interchange (SR Flip) zone. The overall behavior suggests that the market is no longer trending aggressively and has entered a decision phase, where confirmation becomes more important than prediction.
Higher-Timeframe Context & Structure
From the left side of the chart, Bitcoin shows volatile, two-sided price action, with strong impulsive moves followed by sharp rejections. This tells us that liquidity is being actively hunted on both sides of the range rather than a clean trend being established.
As price progressed, we can observe multiple failed breakouts and fake pushes, which often occur near important institutional levels. These failures weaken directional confidence and prepare the market for a structural flip.
Support–Resistance Interchange Zone
The grey highlighted area marks a key SR Interchange zone. Historically, this level has acted as:
Support during previous bullish attempts
Resistance after breakdowns
Price is now reacting inside this zone, which makes it a high-risk area for impulsive entries. Markets often pause here to absorb liquidity before the next expansion.
The presence of multiple candle rejections around this zone confirms that buyers and sellers are equally active, creating compression.
Recent Breakdown & Pullback
A strong bearish impulse pushed price below the SR zone, indicating temporary bearish control. However, instead of immediate continuation, price pulled back toward the same SR level, showing that sellers are now defending this area.
This pullback is critical. If the zone holds as resistance, it strengthens the bearish case. If price reclaims and holds above it, the breakdown becomes a false move.
Entry Logic: Pattern Before Trade
The marked note “Need Pattern Then Entry” is key. At this location, blind buying or selling is not justified. Traders should wait for:
Clear rejection patterns for short setups
Or strong bullish confirmation (engulfing / structure break) for long setups
This approach protects against whipsaws that are common near SR flips.
Projected Price Scenarios
Bearish Continuation Scenario:
If price rejects from the SR zone with strong bearish candles, continuation toward the lower liquidity area becomes likely. This move would align with the recent impulsive sell-off and trend continuation logic.
Bullish Recovery Scenario:
A strong reclaim and hold above the SR zone could trigger a short squeeze and push price back into the previous range, invalidating the bearish breakdown.
Trading Psychology & Risk Insight
This is a classic patience zone. Many traders lose money here by anticipating instead of reacting. The chart clearly suggests that confirmation is the edge, not early entries.
Conclusion
Bitcoin is currently trading at a make-or-break level. The SR Interchange zone will decide whether price continues lower or transitions into a recovery phase. Until a clean pattern forms, waiting is the most professional decision.

BTCUSDT: Bearish Drop to 84000?BINANCE:BTCUSDT is eyeing a bearish reversal on the 4-hour chart , with price forming lower highs within an upward channel, approaching resistance near cumulative long liquidation zones that could trigger downside momentum if sellers defend the levels amid recent volatility. This setup suggests a pullback opportunity after the rally, targeting lower support levels with overall risk-reward exceeding 1:4.
Entry between 91400–92700 for a short position. Targets at 87900 (first), 84000 (second). Set a stop loss at a close above 93180 , yielding a risk-reward ratio of more than 1:3.5 in total. Monitor for confirmation via a bearish candle close below entry with rising volume, leveraging the pair's channel dynamics.🌟
Fundamentally , Bitcoin has plunged below $90,000 on December 12, 2025, amid AI-related jitters dragging down Nasdaq and crypto stocks, with prices consolidating around $89,978 after a sharp fall from its $126,000 peak earlier this year. Despite a 1.9% daily crypto market cap increase to $3.23 trillion, sentiment remains cautious with fears of a price crash, as the asset oscillates in the $88,000–$93,000 range on Fed outlook but shows hourly downside after failing $92,735 resistance. Long-term forecasts eye drops to $80,000 by end-2026, with prediction markets skeptical of hitting $100,000 in 2025, though bulls maintain the uptrend for now. Bitcoin correlates with the S&P 500, which slipped today alongside Nasdaq due to AI bubble fears from Broadcom's results, potentially adding downward pressure on BTC. 💡
📝 Trade Setup
🎯 Entry (Short):
91,400 – 92,700
(Entries inside this zone remain valid with proper risk & capital management.)
🎯 Targets:
• 87,900 (first)
• 84,000 (second)
❌ Stop Loss:
A daily close above 93,180
⚖️ Risk-to-Reward:
More than 1:4 overall
💡 Your view?
Will BTC reject the 92K zone and unwind toward 84,000, or does crypto surprise with a squeeze first? 👇

#BTC/USDT is currently strongly bullish#BTC
The price is moving in a descending channel on the 1-hour timeframe. It has reached the lower boundary and is heading towards breaking above it, with a retest of the upper boundary expected.
We have a downtrend on the RSI indicator, which has reached near the lower boundary, and an upward rebound is expected.
There is a key support zone in green at 89300. The price has bounced from this level multiple times and is expected to bounce again.
We have a trend towards consolidation above the 100-period moving average, as we are moving close to it, which supports the upward movement.
Entry price: 90200
First target: 90600
Second target: 91256
Third target: 92000
Don't forget a simple principle: money management.
Place your stop-loss below the support zone in green.
For any questions, please leave a comment.
Thank you.

BTCUSD Stabilizes Near 92,000 – Key Entry Zones & TargetsBitcoin prices kicked off a sharp unilateral rally from around 90,000 yesterday. The upward momentum was extremely strong, as prices not only broke through the key 94,000 level smoothly but also hit a short-term high near 94,550. This move successfully broke the previous consolidation range of 88,000–91,000, setting a new price high in nearly three weeks and reflecting robust short-term bullish momentum.
However, facing heavy pressure from strong resistance near 95,000, prices subsequently entered a phase of sustained pullback. Hourly charts saw a string of consecutive bearish candles, with a marked retracement magnitude that drove prices gradually down to around 92,000. Today, BTCUSD trended with an oscillating pullback after breaking the key level, and it is currently stabilizing around the 92,000 mark without further sharp declines.
Resistance Levels:
The immediate strong resistance remains in the 94,000–94,550 range, which was the short-term high established in the early hours of today. For bulls to reignite an upward move in the near term, a breakout above this range is essential to unlock further upside potential. Further up, the 95,000 round-number level acts as a major psychological resistance, which exerted significant suppression and triggered the pullback during the previous rally.
Support Levels:
92,000 serves as the most immediate support level, which has already been tested during the morning pullback and is currently showing effective support. Below that, the core support band lies in the 91,000–91,500 range—a zone that was the upper edge of the previous consolidation platform and acts as a critical bullish defense line. If this support fails to hold, the next major support zone will be 88,000–90,000, which has withstood multiple market tests in the past and boasts relatively strong support strength.
Trading Strategy:
Buy 92000 - 92500
SL 91000
TP 94000 - 94500 - 95000
Sell 94000 - 94500
SL 95000
TP 92000 - 91000 - 90000

BTC : REVERSAL or FAKEOUT ?? Hello Bitcoin Watchers 📈
BTC is looking promising with a price recovery towards the upside, currently trading just over $90k.
📢But let's not forget, a higher high was observed here as well.
A further -30% drop followed after this pullback to the upside:
If we have to follow a similar trend, over the next two months we could end up at around $65K:
Conclusion - I'm leaning towards more drop to follow after a period of sideways trading here. We could see this zone hold for two or three weeks up until after Xmas, at which point longs could be liquidated again if the optimism goes too high.
If you've been following my previous BTC updates, you would have seen that it's not uncommon for the price to recover to the basis of the Bollinger bands, or mid-level moving average. And the only way that can be considered a reversal, is if the WEEKLY starts closing above the 50day moving average, which we are no where near close to seeing.
BINANCE:BTCUSDT

$BTC/USDT ANALYSISBitcoin on the 8-hour chart is consolidating within an ascending triangle formation, showing clear higher-low structure support near the rising trendline. The price is currently trading below both the 50-period moving average and the Ichimoku Cloud, which are acting as strong dynamic resistance levels. The highlighted red zone around 92,000–93,500 USDT represents a heavy supply area where previous rejections occurred.
As long as Bitcoin holds above the ascending trendline support near 86,000–86,500 USDT, the structure remains intact, suggesting buyers are still defending this zone. A clear breakout above the 50 MA and the 92,000 USDT resistance region would confirm a bullish continuation toward 95,000 USDT and beyond. However, failure to hold the rising support trendline could trigger a short-term correction toward 84,000 USDT before any recovery attempt.

104k Moonshot or Brutal 96k Rejection? Bitcoin’s Final Bull TrapFriends, Bitcoin has played out exactly as outlined in my previous idea.
As I mentioned last time, that drop could have either been:
1. The start of a deeper bearish continuation after a minor correction, or
2. Wave B of a larger ABC correction — in which case BTC had to reclaim above 93k.
The chart has confirmed the second option — it was wave B.
Therefore, we are now building wave C upwards, and Bitcoin has already broken above 93k.
On the current chart I still have two active scenarios:
🟠 Orange arrow scenario:
A quick push toward ~96k followed by a reversal and drop back to the recent lows.
In this case, the entire three-wave move we’ve seen so far could become wave A of a larger corrective structure.
🟢 Green arrow scenario (my preferred one for now):
Continuation higher to the 102–104k zone, completing wave C of this correction, and only AFTER that we finally update the recent lows.
My ultimate downside target remains 60k and below, but first let’s see which path Bitcoin chooses in the coming days.
Which scenario do you think will play out — orange or green?
Drop your thoughts in the comments! 👇
Like, comment, follow if you find this helpful — really appreciate your feedback and reactions! 🚀

BTCUSD: Reversal From Target & Demand Zone Liquidity Sweep Setup📊 BTCUSD – 30-Minute Smart Money Analysis + MMC Concept Used
Demand Zone Reaction | Volume Burst | QFL Strategy
🔍 1. Market Overview
Bitcoin on the 30-minute chart is currently pulling back after failing to break above the recent intraday high. Price is slowly drifting downward, showing signs of controlled seller pressure. This decline is driving BTC toward a key demand + target zone, marked in blue, with deeper liquidity resting in the green “Volume Burst” zone.
This setup suggests a potential reversal opportunity, but only with confirmed price action.
📉 2. Structure Breakdown
A. Decline After Swing High
BTC rejected the upper levels and started forming:
Lower highs
Lower lows
Weak bullish candles
This shows sellers are still in control until price touches a stronger demand pool.
B. QFL Level Marked
The "QFL" marking on the chart reflects:
A base level where price previously formed
A zone that held liquidity and triggered a bullish bounce last time
A zone that smart money may revisit to collect liquidity again
If no pattern forms at the first demand box, BTC may double the QFL, meaning price can dip into the deeper liquidity pool before reversing.
🎯 3. Key Zones to Watch
🟦 Target + Demand Zone (Upper Zone)
This is the first area where buyers may step in.
Expect:
A possible micro reversal pattern
Short-term bounce opportunity
Scalping potential
However, you must wait for a clean bullish pattern here (engulfing, pin bar, break of minor structure).
The chart clearly states:
“Pattern Needed Otherwise Double The QFL”
Meaning: No pattern = price moves lower.
🟩 Volume Burst Zone (Lower Liquidity Pool)
This deeper zone is stronger because:
It represents the previous area where a volume spike occurred
Smart money positioned aggressively here before
Liquidity is highly concentrated
If price reaches this zone, the reversal probability becomes significantly higher.
This area is ideal for high-probability long entries.
📌 4. Smart Money Logic
The price movement aligns with institutional behavior:
The current drop is likely a liquidity hunt
BTC is moving toward unfilled demand
Buyers may re-enter strongly once the market taps the liquidity pockets shown
Institutions often engineer these dips before the next bullish impulse.
📈 5. Professional Trading Plan
1. Let price fall into the demand zone.
Do not enter early.
2. Look for confirmation:
Bullish engulfing
Market structure shift
Large volume candle
Clean rejection wick
3. If no pattern forms in the first zone:
Expect price to dip toward the lower Volume Burst Zone.
4. Main long entry interest:
Lower (green) zone offers the best probability.
📝 Conclusion
BTC is heading toward a well-defined demand structure. The next move depends on how price reacts in the highlighted zones. A bullish reversal is possible, but confirmation is critical. Without a pattern, BTC may dip deeper to collect liquidity—exactly as marked on the chart.
This setup reflects precision-level smart money behavior, offering a clean high-probability trading opportunity for disciplined traders.

Elise | BTCUSD 4H — Break of Bearish Structure |BITSTAMP:BTCUSD
Price previously rejected from the major corrective zone and continued bearish until a final liquidity grab created imbalance and shift of character. The recent breakout from the bearish channel and bullish momentum suggests institutional repositioning, preparing for upside continuation toward higher correction levels.
Key Scenarios
🚀 Bullish Case (Primary Bias)
If price re-tests and holds above 93,500–95,300, upside continuation is expected:
🎯 Target 1: 100,500
🎯 Target 2: 105,800
🎯 Target 3: 116,200 (Major Correction Zone)
📉 Bearish Case (Invalidation)
A clean breakdown below 88,500 would shift bias back to bearish and may revisit the liquidity grab zone.
Current Levels to Watch
Entry Zone: 93,500–95,300
Support: 88,500
First Breakout Confirmation: Above 96,000
⚠️ Disclaimer: This analysis is for educational purposes only — not financial advice.

BTC pressure and downtrend continueBTC H4 Chart Analysis
Bitcoin on the H4 timeframe is currently showing a corrective pullback after reaching a key resistance zone around 95,500–96,300, which aligns with the descending trendline, previous supply zone, and EMA confluence (200 EMA + 300 EMA). This rejection indicates strong selling pressure and confirms the zone as a major resistance area.
Key Technical Points:
🔹 Strong Rejection at Major Resistance:
Price reacted sharply from the supply zone and failed to break above the descending structure, signaling sellers are still active.
🔹 Break of Short-Term Bullish Structure:
The recent drop has broken the ascending trendline, showing weakness from buyers and a potential shift back to a bearish correction.
🔹 EMA Dynamic Resistance:
Price remains below the 200 EMA (red) and the long-term moving average (white) — suggesting bulls still lack full control and the broader trend remains under pressure.
🔹 Volume Profile Confirmation:
Most liquidity sits below current price levels, hinting the market may revisit demand zones before attempting another move higher.

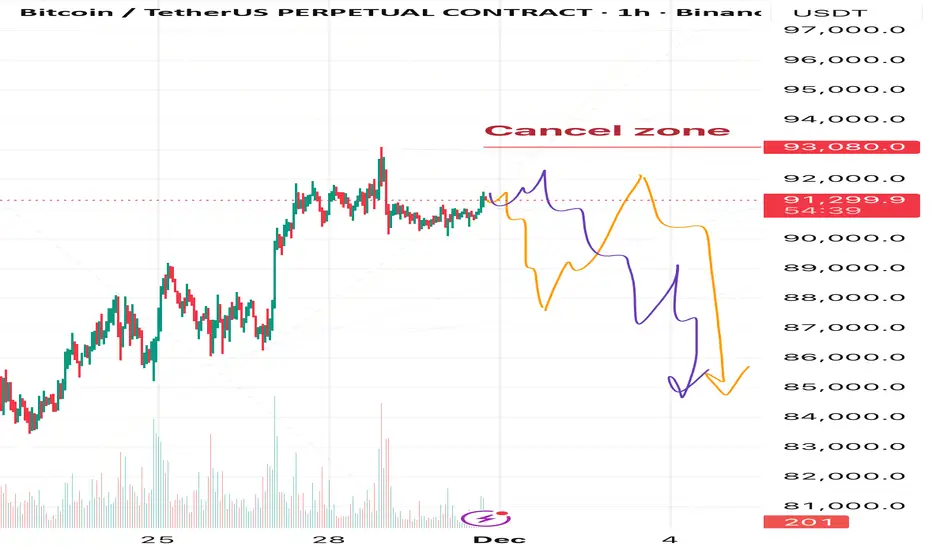
Bitcoin: Next Move = Drop to $85K (Then Either Moon or Doom)Hey everyone! 👋
How was your trading week? Hope it was green and profitable! 💰
Sharing my current Bitcoin view with you.
In my opinion, the recent rally we’ve seen was either part of an ongoing correction or the final leg of a correction after the previous sharp drop.
Either way, I expect the next meaningful move to be to the downside.
Right now I see two possible scenarios, but both lead to the same outcome in the near term:
→ A decline toward the $85,000 area
🟠either straight from the current price
🟣or after one more push higher toward ~$92,000–$92,500
This coming drop can be interpreted in two ways:
1. As wave B of the ABC correction from the recent crash → after $85K is reached we can expect a strong recovery and new highs above $93K (and likely much higher).
2. If the correction from the crash is already fully complete, then the drop to $85K will mark the start of a new bearish trend continuation.
We’ll watch the internal structure of the upcoming decline — it will give us the clues which of the two bigger pictures is playing out.
❌Invalidation level for the entire bearish scenario: $93,080
Any clear touch and break above this level cancels the idea completely.
Of course, I’ll keep posting fresh updates and chart markups as the price action unfolds, so make sure to hit that
Follow button and turn on notifications — you don’t want to miss the next posts! 🔔
Stay sharp and trade safe, friends! 🚀
See you in the charts! 📊
BTCUSD: Wave rhythm on the verge of impulseBased on the current structure, Bitcoin is completing its corrective phase and is preparing to form a new impulse. The chart shows a transition from sideways movement to a more dynamic wave, which could set the direction for the near term.
Primary scenario: after the correction ends, a downward impulse sequence is expected to develop. Alternative scenario: if the market consolidates above recent highs, it could continue to rise, delaying the start of a new downward wave.
Idea for traders: watch for confirmation of the structure on lower timeframes and enter only after clear reversal signals appear.
Friends, more wave analysis is available in our profile.
Subscribe to stay up to date with wave analysis!

BTCUSD: Wave Pendulum on the Verge of ReversalBTCUSD: Wave Pendulum on the Verge of Reversal
BTCUSD Wave Overview (H4/D1)
According to its wave structure, Bitcoin is completing its corrective phase and preparing to form a new impulse. Current dynamics indicate a possible end to the sideways movement and a transition to the final wave of a larger cycle.
Primary scenario: A downward impulse sequence is expected to develop after the correction is complete. Alternative scenario: If the market consolidates above recent highs, it could continue to rise, delaying the start of a new downward wave.
Idea for traders: watch for confirmation of the structure on lower timeframes and enter only after clear reversal signals appear.

BTC: Bullish Trend, 900000 Breakout AheadFollowing Black Friday’s plunge, BTC’s uptrend is now confirmed—holding firmly above 85000 and awaiting a direct breakout above 90000
Buy 86500 - 87500
TP 88500 - 89000
Accurate signals updated daily. They serve as a reliable guide for trading issues – feel free to refer to them. Hope they help!

BTCUSDT Liquidity Grab at Resistance – Bearish Reversal SetupBitcoin is currently ranging between a well-defined resistance zone near 88,000–88,400 and a support zone around 86,700–86,300. Price action shows repeated rejections at the top of the range, suggesting strong selling interest.
🔵 Resistance Zone (88,000–88,400)
This blue block has acted as a major supply area. Each time price taps into this zone, sellers quickly push the market back down.
The circle on the chart highlights a potential final liquidity grab before a move lower.
• Expectation: Price may spike back into the resistance block to collect liquidity before reversing.
🟡 Support Zone (86,700–86,300)
This area has held multiple times and remains the primary demand zone of the range.
However, the reactions here are becoming weaker, suggesting buyers are losing strength with each test.
📉 Bearish Scenario (Most Probable)
• Price likely moves back into the 88,000–88,400 resistance to fill liquidity.
• From there, a rejection is expected as sellers dominate.
• A break below the support zone opens the path toward your target area around 86,400.
This aligns perfectly with the downward arrow drawn on your chart.
📌 What Confirms Bearish Continuation?
• Bearish rejection candles inside the resistance zone
• Break of structure below 86,700
• Increased sell volume on the push down
❌ Bullish Invalidations
The bearish outlook is invalidated only if price:
• Breaks and closes above 88,400,
• Sustains new higher highs on the 15m.
Until then, the setup remains bearish within a range-bound market.

BTCUSDT - Signal#BTCUSDT - Signal
H4 - Formation of the 3rd wave + trendline breakout. Stop loss beyond the high of the 1st wave.
Entry: 86129.47
TP: 83947.38 - 81145.35 - 78858.86 - 75356.76
Stop: 89430.81
