BTC: Bottoming ConsolidationBTCUSD is staging a weak rebound from the lows and oscillating around the $90,000 mark today. Overall, it has yet to break free from the recent sharp correction trend. Meanwhile, technical indicators are showing oversold rebound signals, while pressures from the macroeconomic and capital sides are significantly restricting the upside potential.
Currently, the 90,000 level serves as a key battleground. Having acted as a crucial support level after the previous breakdown, this level has now become a critical psychological resistance during the ongoing rebound. The immediate resistance zone at 93,500 remains effective, with a further resistance level at 95,000. On the downside, the key support lies at 89,000. A break below this level will most likely trigger a new round of sell-offs, subsequently testing the support range between 80,000 and 85,000.
In the short term, BTCUSD is likely to continue its sideways consolidation to build a bottom. If it can hold firm at the 90,000 level and the macro environment eases—such as the Federal Reserve issuing dovish signals or the resumption of capital inflows into Bitcoin ETFs—the price is expected to rebound to the range of 95,000 - 100,000. However, if a black swan event like the Federal Reserve adopting a more hawkish stance occurs, the price may breach the 88,000 support level and slide further to test the 75,000 - 80,000 range.
Sell 93000 - 93500
SL 94000
TP 90000 - 89500 - 89000
Buy 89000 - 89500
SL 88000
TP 92000 - 92500 - 93000
Btcusdtshort

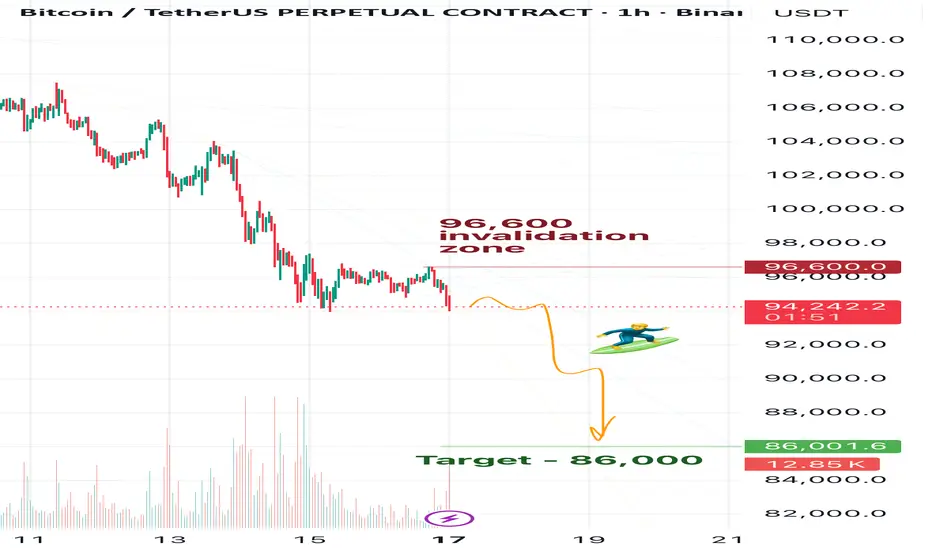
Bitcoin Downtrend UpdateAlright friends, Bitcoin has confirmed its intention to move toward 86,000 and lower.
My previous forecast with the invalidation zone at 96,600 is still valid, but I decided to make a fresh post.
At the moment, my new invalidation level is 96,012.5.
From a broader perspective, I’m still expecting Bitcoin to reach 83,000.
But as I mentioned earlier, we first need to see 86,000 tested — because once that level is hit, Bitcoin may go into a correction before continuing toward 83,000 and below.
Yes-yes, I do expect it even lower, but more on that in the upcoming updates.
Make sure to follow so you don’t miss them

Avoid chasing long positionsBTC has broken below the key level of 90000 today, with the downtrend becoming clear.
If the support around 87500 is broken, it may continue to decline
Accurate signals updated daily. They serve as a reliable guide for trading issues – feel free to refer to them. Hope they help!

Weak Recovery for BTCUSDBTC showed a trend of weak oscillatory recovery after hitting a low today. The price found support after breaking below the critical level of 90,000; however, the market remained in an extreme state of panic, which restricted the overall strength of the rebound.
From a technical perspective, the 85,000 - 90,000 range serves as a strong support zone, corresponding to the Fibonacci 0.618 retracement level. The price has demonstrated support near 89,000 today. On the flip side, the key resistance is concentrated in the 93,500 - 94,200 range. A breakout above this range may lead the price to test 95,000 subsequently, and if it can breach 95,000, it is expected to further move towards and challenge the 96,000 - 96,700 range.
Sell 93,500 - 94,000
SL 94,500
TP 92,000 - 91,500 - 91,000
Buy 89,500 - 90,000
SL 88,500
TP 92,500 - 93,000 - 93,500

BTCUSD - 3months : Is a 50% Correction toward 50K on the table?Bitcoin faces a potential three-month corrective phase after tapping 91K. Untested liquidity below 70K and 60K keeps the downside open, making a deeper move toward the 45K demand zone increasingly likely.

BitcoinBTCUSD
- Fair Value Gap
- Change of Characteristics
- Order Block
- Rising Wedge as an corrective pattern in Long Time Frame
- Demand Zone

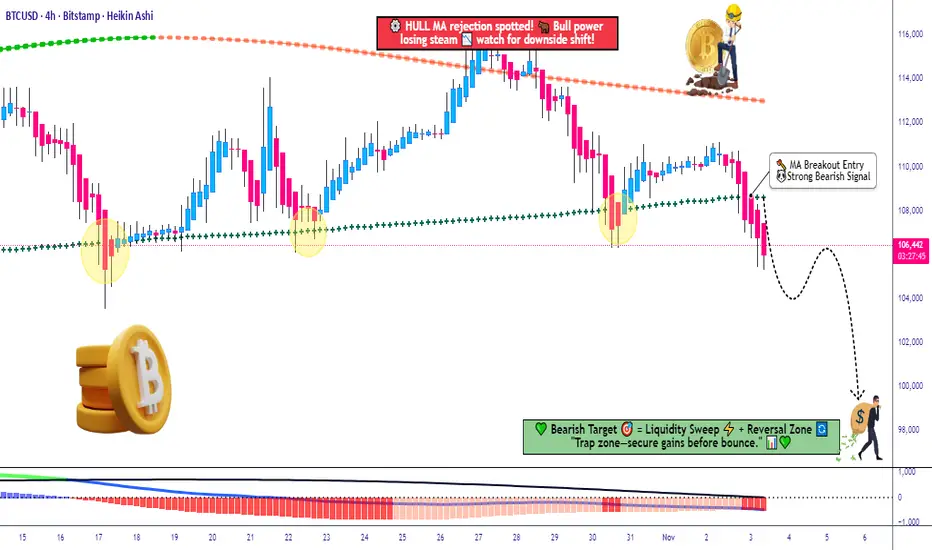
BTC market on fire, sharp dropBTC Daily Timeframe – Short Summary
BTC is forming a bearish 5-wave Elliott structure:
Wave (3) seems to have bottomed around 94,000.
Price is now expected to make a Wave (4) pullback toward 100,000–101,000 (major resistance).
After that, BTC is likely to drop again in Wave (5) toward the 80,000–82,000 zone (1.618 extension).
Technical signals:
BTC is below all EMAs (34/89/200) → trend still bearish.
200 EMA near 104,800 is strong resistance.
Key supports: 94k, then 80k.
Bias: Bearish while below 104k–105k.

BTC TO 94k BEFORE 140k TOP?I don't think the bull run is over, but I do see BTC going below 100k to 93-94K area.
Will look to add a buy limit in this area because I believe it will retest that area before creating the last leg up to ATH and top of the bull market, which I believe to be around 140k-160k BTC.
Regardless, BTC is the best asset class of this generation and I'll continue to DCA into it for my long term bags.

BTC Daily View 17.11Friends, as you may remember from my previous Bitcoin updates, I’m expecting BTC to reach 83k. At the moment, in my view, Bitcoin is already preparing for this move down.
However, for now my main target is 86k — I think BTC currently has enough momentum only to drop to that level. Before we see 83k, it will likely need to build more energy.
So after hitting 86k, I expect a correction — probably a prolonged one. But let’s see what the market gives us.
🎯For now, my target remains 86k.
❌Invalidation zone: 96,600
⚠️Disclaimer:
This is not financial advice. Please make your own decisions according to your own trading rules, and never trade without stop-losses.
🗯️If you find my ideas helpful, please leave a reaction and write a comment — your support really matters to me
BTC to break 110000 after support testBTC is set to rally back to around 100000, followed by another sharp pullback.
Focus on the support at 91000 – a break below this level will trigger a further drop to around 87500, where strong support is expected.
It will then stage a rebound and break above 110000 to resume the uptrend
Accurate signals updated daily. They serve as a reliable guide for trading issues – feel free to refer to them. Hope they help!

Bitcoin Daily — Correction Gone WavyHey everyone!
The correction in Bitcoin turned out bigger than I expected — it unfolded as a clear three-wave ABC, and wave A itself was a flat ABC.
Right now, I believe the correction has come to an end, and Bitcoin is already hinting at another leg down.
🎯 My downside targets:
• Target 1 — $102,000
• Target 2 — $98,000
• Target 3 — $94,000 (I’m placing Target-3 at $94K, but I don’t rule out a drop to $92K)
❌ Invalidation Zone — $107,100
Also, just to remind — globally I’m still expecting Bitcoin to reach around $83,000.
However, after a drop toward ~$94K, there might be corrective bounce, so BTC can gain some strength before continuing lower.
⚠️ As always — don’t trade without stop-losses!
If you enjoy my daily Bitcoin outlooks and want to see more of my market vision, don’t forget to like, comment, and follow — your feedback means a lot! 💬🔥
Stay tuned for what’s next! 🚀

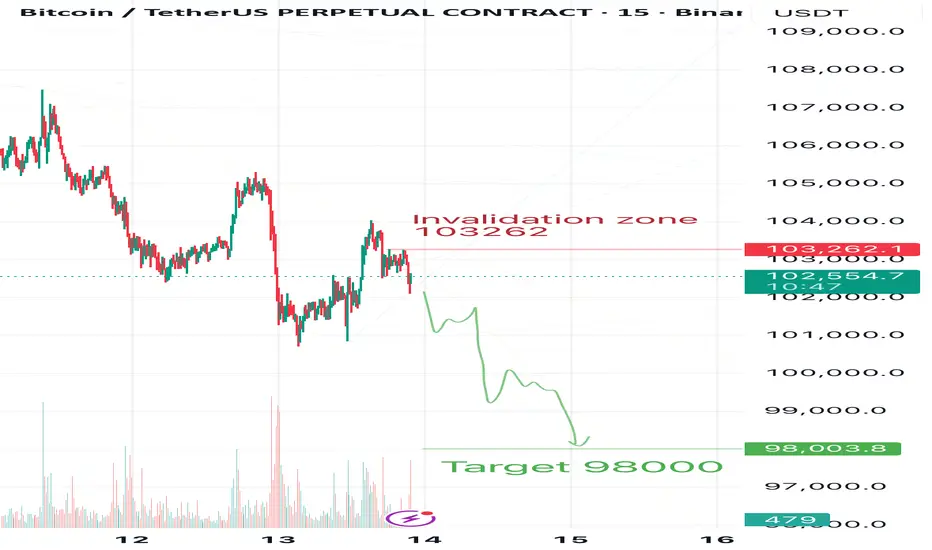
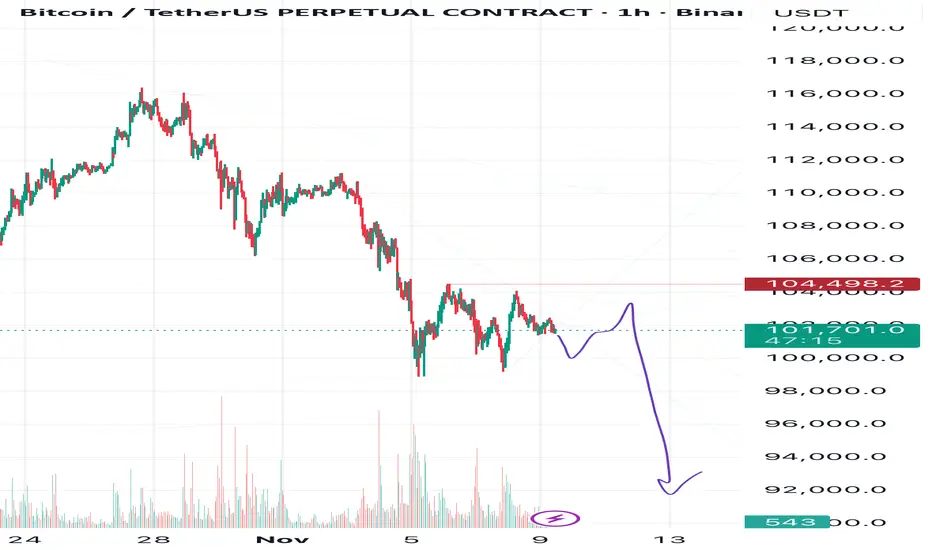
Bitcoin Daily — From 103 to 98k, MaybeI’m no longer waiting for Bitcoin to reach 100K, as I mentioned yesterday.
Now my target is 98K — and in my opinion, all the signs for this move are already in place.
In my previous posts, you can find my global target for Bitcoin at 83K, but that’s not the focus today.
❌The invalidation zone is marked on the chart — 103,262.
🎯Target: 98,000.
⚠️This is not a signal, just my personal view of the market.
Trade based on your own system and always use stop losses.
💬Share your thoughts in the comments, react if you agree, and follow me so you don’t miss my daily Bitcoin updates
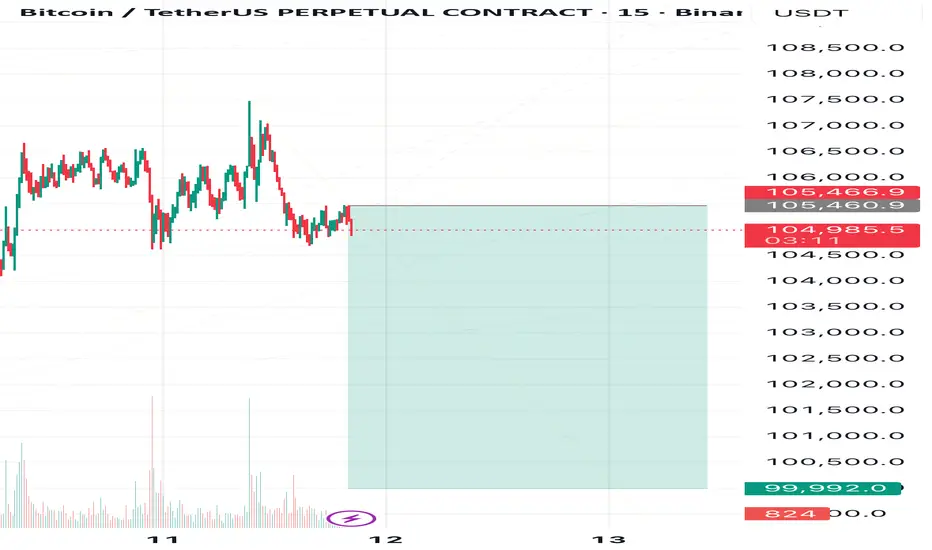
Bitcoin’s Slide to the 100K SideI expect Bitcoin to decline toward 99,999🎯
❌Invalidation Zone: above 105,565.
⚠️This is not a signal — make your own decisions and always trade with stop-losses!)
What’s your view on this setup?
💭Share your thoughts in the comments and follow to stay tuned for what’s next!
BTC/USD Breakdown Alert — MA Cross & MACD Flash Warning!💰 BTC/USD — “BITCOIN vs U.S. DOLLAR” | Crypto Market Capital Flow Blueprint (Swing Trade)
🧭 Market Overview
The king of crypto 👑, Bitcoin, is showing signs of fatigue at the top. After a solid bull sprint, we’re spotting bearish confirmation on multiple signals — a clean moving average breakout and a MACD divergence to the downside.
Looks like the market’s whispering, “It’s time for a cool-down, mate.” 😏
🎯 Trade Plan (Swing Setup)
Plan: ✅ Bearish plan confirmed — waiting for continuation pressure below structure zones.
Entry Strategy (Thief Layer Method 🕵️♂️):
Using layered limit sell orders — a signature “Thief Strategy” style of scaling in with patience, precision, and a bit of chaos theory.
Sell Limit Layers: 110,000 💸 → 108,000 💸 → 106,000 💸
(You can expand the layer grid as per your risk model.)
Stop Loss: 112,000 — positioned above the previous Higher High (HH) structure.
📝 Note: Dear Ladies & Gentlemen (Thief OG’s), I’m not recommending you to stick to my SL. Manage risk your way — you make money, you take money. 💼
Target: 98,000 — based on strong support, oversold confluence, and a potential liquidity trap zone below.
📝 Note: Same rule — take profits where it makes sense for you. The trap is the escape; don’t overstay the party. 🎭
🔍 Technical Confluence Highlights
📉 MA Breakout: Bears gaining control after crossover rejection.
📊 MACD Divergence: Weak momentum confirmed — watch histogram fade.
Structure Check: Market respecting descending trendline — sellers defending upper zone.
🧩 Momentum Flow: Smart money possibly rotating out of BTC into defensive assets.
🌍 Correlated Pairs to Watch
Keep an eye on these related assets for directional cues and correlation strength:
BITSTAMP:ETHUSD (Ethereum) — often mirrors BTC’s moves with higher beta.
TVC:DXY (U.S. Dollar Index) — rising DXY can pressure BTC.
PEPPERSTONE:NAS100 (NASDAQ 100) — tech sentiment affects BTC risk appetite.
CRYPTOCAP:BTC.D (Bitcoin Dominance) — watch if altcoins start outperforming.
✨ “If you find value in my analysis, a 👍 and 🚀 boost is much appreciated — it helps me share more setups with the community!”
#BTCUSD #Bitcoin #CryptoMarket #SwingTrade #TechnicalAnalysis #ThiefStrategy #BearishSetup #CryptoTrading #MarketFlow #LayeredEntries #SmartMoney #TradingView #EditorPickCandidate #BTCAnalysis
BTC Poised for Breakout or Pullback?BINANCE:BTCUSDT Poised for Breakout or Pullback?
BTC's current trend remains bullish on the 1H chart, firmly holding the key support at ~101.5k amid recent volatility.
We're testing resistance around 106.6k— a clean breakout here could spark a rally to 110k. However, watch for a deeper dip to 102k if volume fades and we slip below support.
Key indicators: RSI hovering near 60 (room to run), rising 50MA, and MACD bullish crossover.
Stay tuned! 🚀📈
#BTC #CryptoTrading #AltcoinPioneers

BTCUSD: Stabilize above 105,000BTC rose to break through and stabilizing above 105,000 today, surpassing last week's short-term resistance level. Next, we will focus on whether the key resistance level at 108,000 can be broken.
We predict that Bitcoin's movement today will fluctuate within the range of 104,000-108,000. If it can sustain a breakthrough above 108,000, we expect an upward trend to emerge this week.
Buy 103,000 - 103,500
SL 102,500
TP 104,500 - 105,000 - 105,500
Sell 105,500 - 106,000
SL 106,500
TP 104,500 - 104,000 - 103,500

Bitcoin Daily View — Triangle in Play, Bears May StayIn my view, Bitcoin is currently forming a corrective triangle (ABCDE), and the breakout seems more likely to occur to the downside.
🎯 Targets:
• 1️⃣ 98,000
• 2️⃣ 94,000
• 3️⃣ 92,000
❌ Invalidation Level: 104,500
In my previous posts, I mentioned that I expect Bitcoin to eventually reach 83,000, but for now, I’m setting my target at 92,000, as I don’t think it will drop that far immediately.
⚠️Disclaimer: This is just my personal market view, not financial advice. Always trade with stop-losses!
💬 Share your thoughts in the comments and follow for upcoming Bitcoin updates!
BTCUSD: The resistance level at 105,000 remains firmBTC rebounded above 104,000 on Friday but then came under pressure and pulled back. It traded in a narrow range between 101,400 and 104,000 throughout Saturday, which also confirms the accuracy of our prediction about the resistance level at 105,000. Bitcoin can only see sustained gains if it breaks through 105,000 and stands firmly above 108,000.

BTCUSD: Overall trend is moving downwardLooking at the candlestick chart, Bitcoin has formed a potential M-top or double top pattern, which is a typical top reversal signal. Currently, the price has broken below all short-term moving averages, indicating obvious weakness.
Yesterday, it is consistent with my analysis. BTC broke below the short-term support at 102,000, fell to around 100,000 where it found support and rebounded. However, this also showed an overall downward shift in the trend, with yesterday’s short-term support at 102,000 having turned into today’s resistance.
Overall, I predict that Bitcoin will continue its overall downward trend today. The short-term support is at 100,000, and a break below this level would target 98,000.
For resistance above, we still focus on 105,000 in the short term, with key attention on 108,000. Only a breakthrough and a firm hold above 108,000 could lead to sustained gains.
Buy 100,000 - 100,500
SL 99,000
TP 102,000 - 102,500 - 103,000
Sell 103,500 - 104,000
SL 104,500
TP 102,000 - 101,500 - 101,000

BTCUSD: Consolidation is the main theme todayYesterday, BTC saw intense battles around the psychological threshold of 100,000. During the session, it once broke below the key support at 99,500, then rebounded to around 104,000.
Today, it pulled back to around 102,000 at the opening of the Asian session and began to consolidate again.
On the upside, the 105,000-105,500 zone forms a crucial resistance range. Only a daily close firmly above this level can confirm the reversal of the short-term downtrend. For today's short-term support, we still focus on 100,000. If it breaks below 100,000, we need to pay key attention to the supporting role of 98,000.
Buy 100,500 - 101,000
SL 100,000
TP 102,000 - 102,500 - 103,000
Sell 103,000 - 103,500
SL 104,000
TP 101,500 - 101,000 - 100,500

Today's Bitcoin Trading StrategyThe funds on the blockchain have "massive exodus", and core holdings have loosened.
Chain data reveals a fatal risk: Over the past 7 days, the "super" addresses holding more than 1,000 BTC have decreased by 12, and have transferred a total of 23,000 BTC (approximately 24.15 billion US dollars) to exchanges. Among them, 80% have completed the sale. More importantly, "long-term addresses that have been locked for over 3 years" have for the first time experienced a large-scale unlocking, with a weekly unlocking volume of 18,000 BTC. After these "dead money" turned into "live money", it directly exacerbated market selling pressure. Historically, situations where super and long-term addresses simultaneously reduced holdings have occurred 3 times, each accompanied by at least a 15% price correction.
Today's Bitcoin Trading Strategy
buy:101000-102000
tp:103000-104000
sl:100000

No Rise in Sight — the Drop’s Still RightAs I mentioned before, I expect Bitcoin to decline toward 104K, and now the signs of this move are forming.
The invalidation zone is marked on the chart (and may be shifted closer to 110,445).
After reaching 104K, a sharp but limited rebound is possible, but I don’t expect a trend reversal at this stage.
⚠️ This is not financial advice or a trade signal. Please manage your risks and follow your own money management system.

Little Short Won’t Hurt a LotI’m opening a small short on Bitcoin.
You know that I’m expecting a decline toward 104K and possibly lower.
At the moment, I’m looking for a small move down — just a part of the bigger bearish trend.
Targets and stop are marked on the chart
