ElDoradoFx – BTCUSD ANALYSIS (25/12/2025, BANK HOLIDAY UPDATE)HI EVERYONE PLEASE SUBSCRIBE TO OUR YOUTUBE CHANNEL FOR FREE DAILY FORECAST.
LINK IN OUR BIO.
1. Market Overview
BTCUSD is in a higher-timeframe corrective phase inside a broader bullish macro structure.
After rejecting the HTF supply around 126k earlier in the year, price has been trending lower but is now stabilising above a major structural demand zone between 86.4k – 84.4k.
The current market state is:
• Macro: Bullish market → medium-term correction
• Structure: Range / compression after sell-off
• Liquidity: Sell-side has been partially taken, buy-side remains above 88.8k and 90.6k
• Momentum: Bearish impulse exhausted, bullish momentum building
This suggests we are transitioning from distribution → markdown → accumulation / rebalancing.
⸻
2. Technical Breakdown
🔹 Daily (D1)
• Market printed a full impulse down from ~116k → ~80.6k (clean bearish leg).
• Price is now holding above the D1 strong low (80,630) and forming higher lows.
• White 50 EMA is flattening; yellow 200 EMA still above price (bearish pressure remains).
• Daily structure is neutral → early recovery, not yet bullish.
Key read:
As long as 80.6k holds, this is a corrective leg — not a trend reversal.
⸻
🔹 H1
• Trendline break to the upside after the 80.6k low.
• BOS up toward 90.5k failed and created a lower high → rejection → pullback.
• Price now compressing between:
• Resistance: 88.0k – 88.6k
• Support: 86.4k – 87.0k
Structure: Range inside recovery channel.
⸻
🔹 30M
• Market swept below 86.4k liquidity, then reclaimed it.
• Internal BOS printed bullish, but price is now ranging under supply.
• Strong reaction every time price hits 86.4k demand.
This is accumulation behaviour.
⸻
🔹 15M
• Equal highs taken near 88.0k, but continuation failed.
• Price remains above trendline support and demand.
• CHoCH bullish → then sideways compression.
⸻
🔹 5M
• Micro structure alternating — no directional control.
• Liquidity sitting:
• Above: 88.4k – 88.8k
• Below: 86.8k – 86.4k
Market waiting for a liquidity trigger.
⸻
3. Fibonacci Analysis
Swing used:
Low → High = 80,630 → 90,588
Fib Level Price
38.2% 86,960
50.0% 85,609
61.8% 84,258
🟩 Golden Zone: 86.9k – 84.2k
(Current price is sitting at the top of the Golden Zone)
This is a classic re-accumulation zone after a sell-off.
⸻
4. High-Probability Trade Scenarios
📈 BUY Scenario (Primary Bias)
Zone: 86,900 – 84,300 (Golden Zone / HTF demand)
Confirmation:
• 5M or 15M bullish BOS from the zone
• Rejection wick + volume increase
Targets:
• 88,100
• 89,400
• 90,600
• 93,900 (if weekly breakout occurs)
Invalidation: Daily close below 84,000.
⸻
📈 BUY Breakout
Trigger: Break & hold above 88,800
Retest: 88,200–88,500 holding
Targets: 90,600 → 93,900 → 98,800
⸻
📉 SELL Scenario (Countertrend)
Only valid on rejection from 88.6k–90.6k.
Targets: 87,200 → 86,400 → 85,600
Invalidation: Break above 90.6k.
⸻
📉 SELL Breakdown
Trigger: Daily close below 84,000
Targets: 82,000 → 80,600 → 76,000
This would signal a deeper macro correction.
⸻
5. Fundamental Watch
• Bank holiday liquidity → false moves possible.
• No major crypto or macro catalysts scheduled.
• ETF flows + risk sentiment likely dominate next week.
⸻
6. Key Technical Levels
Resistance
• 88,100
• 88,800
• 90,600
• 93,900
Support
• 86,900
• 86,400
• 85,600
• 84,300
• 80,600
⸻
7. Analyst Summary
BTCUSD is not bearish — it is correcting inside a long-term bull market.
The sell-off has done its job. The market is now compressing above HTF demand and preparing for its next directional move.
This is a classic:
Sell-off → Stabilisation → Accumulation → Expansion structure.
⸻
8. Final Bias Summary
🟢 Short-term bias: Neutral → Bullish above 86.4k
🟢 Weekly bias: Bullish recovery unless 84k breaks
🔴 Bearish only if: Daily close < 84k
Primary expectation for next week:
👉 Range early → liquidity sweep → bullish continuation toward 90.6k+.
⸻
✅ Conclusion
• The downside is largely exhausted.
• Smart money is building positions in the 86k–84k zone.
• The next clean break is likely up, not down.
Patience + confirmation buys > aggressive sells.
⸻
🥇 ElDoradoFx PREMIUM 3.0 – PERFORMANCE 24/12/2025 🥇
⚡ Precision execution. Swing objectives completed.
📈 BUY +40 PIPS
⚖️ SELL – BE
❌ SELL −40 PIPS (SL)
📉 SELL +20 PIPS
📈 BUY +90 PIPS
📉 SELL +210 PIPS
📉 SELL +20 PIPS
━━━━━━━━━━━━━━━
💎 SWING TRADES – FULL TP HIT
• Entry 3959 ➤ +5,410 pips
• Entry 4000 ➤ +5,000 pips
• Entry 4124 ➤ +3,760 pips
• Entry 4275 ➤ +2,250 pips
• Entry 4293 ➤ +2,070 pips
• Entry 4325 ➤ +1,750 pips
• Entry 4406 ➤ +940 pips
📊 Swing Total: +21,180 pips
━━━━━━━━━━━━━━━
💰 DAY RESULT: +340 PIPS
(BE excluded, SL deducted)
🎯 6 Counted Signals → 5 Wins | 1 SL
🔥 Accuracy: 83%
━━━━━━━━━━━━━━━
Btcusdttrade

ElDoradoFx – BTCUSD WEEKEND ANALYSIS
1️⃣ Market Overview
BTCUSD remains in a medium-term corrective phase after rejecting the major supply zone near the prior highs. Price has stabilized above last week’s lows but continues to trade below key dynamic resistance, keeping the broader bias cautious into the new week.
Market structure suggests distribution → breakdown → consolidation, with liquidity still resting on both sides. Directional conviction is likely to return with the weekly open and increased institutional volume.
⸻
2️⃣ Technical Breakdown
🔹 Daily (D1)
• Market structure is bearish to neutral after a clear rejection from the upper supply zone.
• Price trades below the daily 50 & 200 EMA, confirming loss of bullish momentum.
• Last strong demand sits around 84,400 – 85,200 (weekly demand).
• As long as BTC remains below 90,300 – 92,000, upside is corrective only.
D1 Bias: Corrective bearish / range environment.
⸻
🔹 H1
• Clear bearish BOS sequence followed by range compression.
• Price is capped below descending trendline + EMA confluence.
• H1 structure only turns bullish above 89,900 – 90,300.
• Liquidity resting:
• Above: 89,400 → 90,350
• Below: 86,800 → 84,400
H1 Bias: Range → potential continuation lower.
⸻
🔹 15M – 5M
• Intraday structure is choppy with repeated CHoCHs.
• Momentum indicators show weak bullish divergence, but no BOS confirmation yet.
• Ideal entries require liquidity sweep + structure confirmation.
• Scalps only until higher timeframe break.
⸻
3️⃣ Fibonacci Analysis (Primary Swing)
Swing: 94,468 → 84,445
• 38.2% → 88,300
• 50.0% → 89,450
• 61.8% → 90,600
🟨 Golden Zone: 88,300 – 90,600
This zone aligns with:
• EMA resistance
• Prior breakdown area
• Trendline resistance
⸻
4️⃣ High-Probability Trade Scenarios
📉 SELL Scenario (Primary Bias)
Sell Zone: 88,800 – 90,300
Targets:
• 87,500
• 86,800
• 85,200
Stop: Above 91,200
Confirmation:
• H1 / 15M rejection
• Bearish BOS
• Weak high sweep
⸻
📈 BUY Scenario (Countertrend / Conditional)
Buy Zone: 84,800 – 84,400
Targets:
• 86,800
• 88,300
• 89,400
Stop: Below 83,900
Confirmation:
• Liquidity sweep
• Strong bullish BOS
• Momentum expansion
⸻
📈 BUY Breakout Setup (Trend Shift)
Trigger: Daily close above 90,600
Retest Zone: 89,800 – 90,300
Targets:
• 92,000
• 94,400
Invalidation: Close back below 89,400
⸻
5️⃣ Fundamental Watch
• No major crypto-specific events scheduled.
• Focus on US Dollar strength, equity sentiment, and ETF flows.
• Expect volatility expansion from Monday–Tuesday after weekend compression.
⸻
6️⃣ Key Technical Levels
Resistance:
• 88,300
• 89,450
• 90,300
• 92,000
Support:
• 86,800
• 85,200
• 84,400
• 80,600 (macro)
⸻
7️⃣ Analyst Summary
BTCUSD is in a corrective consolidation within a broader bearish structure. Until price reclaims 90,300+, rallies are considered selling opportunities. The higher-probability play remains sell-the-rallies, with buys only valid from deep weekly demand or on confirmed breakout.
⸻
8️⃣ Final Bias Summary
✅ Primary Bias: Bearish below 90,300
⚠️ Range Risk: High during early week
🚀 Bullish Shift Only If: Acceptance above 90,600
— ElDoradoFx Team 🚀
⸻
🥇 ElDoradoFx FREE / GRATIS – WEEKLY PERFORMANCE 🥇
📅 15/12/2025 – 19/12/2025
━━━━━━━━━━━━━━━
🟢 MONDAY
✅ BUY +60 PIPS
🔵 TUESDAY
❌ SELL −40 PIPS (SL)
✅ SELL +60 PIPS
🟣 WEDNESDAY
✅ BUY +210 PIPS
✅ SELL +40 PIPS
🟡 THURSDAY
⚖️ SELL − BE
✅ BUY +60 PIPS
🔴 FRIDAY
✅ BUY +210 PIPS
━━━━━━━━━━━━━━━
📊 WEEKLY RECAP
💰 GOLD NET PIPS: +600
🎯 7 Counted Trades → 6 Wins | 1 SL
🔥 Win Rate: 86%
━━━━━━━━━━━━━━━
🚀 Solid consistency even on FREE signals.
Join us and trade with structure, discipline, and precision.

Why is it a good time to consider short selling now?Macro policies suppress risky assets: Previously, the market had some expectations for the Fed's December interest rate cut, but officials such as the president of the Boston Federal Reserve, Collins, made hawkish remarks, explicitly opposing the continuation of the rate cut in December, reducing the probability of a rate cut to only 40%. The cooling of the expectation for rate cuts pushed the US dollar to strengthen, while Bitcoin, as a typical risky asset, lost its appeal significantly under the backdrop of a strong US dollar, and lacked macro policy support for its price increase, providing a basis for short selling.
Market enthusiasm has significantly cooled down: The institutional funds that previously drove the rise of Bitcoin are now withdrawing, and related funds have been flowing out of the market for several consecutive days, with a cumulative amount of 3.79 billion US dollars. Moreover, market trading volume is also decreasing, and the trading activity on major exchanges is not as active as before, indicating a decline in the enthusiasm of participants and a lack of momentum for the rise.
Policy risks persist: The regulatory rules for Bitcoin have been delayed for a long time, and related bills have been in deadlock in the parliament, and there is no clear direction in sight in the short term. This has made many large institutions reluctant to enter the market, resulting in a lack of market confidence. Meanwhile, although there are rumors of a rate cut by the Fed, officials have repeatedly stated that "it is not a certainty", this uncertainty makes high-risk assets like Bitcoin prone to decline.
Bitcoin trading strategy
sell:88000-89000
tp:87000-85000
sl:90000

ElDoradoFx – BTCUSD ANALYSIS (22/11/2025, WEEKEND)1. Market Overview
BTCUSD continues in a strong downtrend from the 113k top, now trading around 84,000 after a sharp selloff. Price is sitting near the lower side of the descending channel and just above the key support band 83,500–83,400, with momentum still bearish but short-term showing signs of exhaustion / potential corrective bounce.
⸻
2. Technical Breakdown
🕐 Daily (D1)
• Clear bearish structure: consecutive lower highs and lower lows from ~113k.
• Price trades well below 20/50/100/200 EMAs, confirming dominant downtrend.
• Current D1 candle sitting near the prior “Sweep” zone around 83–81k.
• RSI oversold (~22–25) and MACD deeply red → trend strong but stretched; space for corrective rally before next leg down.
🕐 H1
• Price moving inside a falling channel, last swing low near 81–82k, last swing high around 88–89k.
• EMAs (20/50) below 200 EMA, slightly flattening → trend still down, momentum slowing.
• Small BOS to the upside from the last swing low, but still capped under H1 supply 84.8–85.7k.
• MACD shows bullish divergence vs the recent low → supports idea of pullback toward Fib zone before possible continuation.
🕐 15M–5M
• Intraday price is ranging 83.7–84.3k, forming minor higher lows.
• MACD positive, RSI hovering around 50 → short-term neutral / corrective phase.
• Still trading inside H1 downtrend and below intraday supply 84.8–85.2k.
⸻
3. Fibonacci Analysis
Last clear swing on H1:
• Swing High ≈ 88,700
• Swing Low ≈ 81,300
Fibonacci retracement (bearish pullback):
• 38.2% ≈ 84,120
• 50.0% ≈ 84,990
• 61.8% ≈ 85,870
🎯 Fibonacci Golden Zone: 84,100 – 85,900
This aligns with H1 supply and descending trendline → high-interest sell zone for continuation.
⸻
4. High-Probability Trade Scenarios
📉 A. Trend SELL from Golden Zone (Main Setup)
• Sell Zone: 84,500 – 85,500 (Fib 0.5–0.618 + H1 supply / trendline)
• Initial Targets:
• TP1: 83,500
• TP2: 82,500
• TP3: 81,000
• Extended: 80,600 (prior strong low)
• Stop Loss: Above 86,200
• Confirmation:
• Rejection candle / bearish engulfing in zone
• RSI H1 staying below 55 and MACD crossing back bearish.
• Idea: Primary play is to sell the corrective rally back into the golden zone in line with the dominant downtrend.
⸻
💥 B. Breakout SELL Setup (Continuation)
• Break Sell Trigger (Breaking Price):
• Clean H1 close below 83,450
• Retest Sell Zone: 83,450 – 83,800
• Targets:
• TP1: 82,500
• TP2: 81,000
• TP3: 80,600
• Stop Loss: Above 84,300
• Note: Use if price fails to reach the golden zone and instead breaks the current base directly.
⸻
📈 C. Countertrend BUY from Support (Scalp / Secondary)
• Buy Zone: 83,500 – 83,400 (top of strong support / range low)
• Targets:
• TP1: 84,500
• TP2: 85,500
• TP3: 86,800 (toward top of golden zone / trendline)
• Stop Loss: Below 82,800
• Confirmation:
• Bullish divergence on 15M/5M
• Strong wick rejection from 83.4–83.5k.
• ⚠️ Countertrend only – use reduced risk; objective is to catch corrective leg back into the golden zone.
⸻
🚀 D. Breakout BUY Setup (Structure Shift)
• Break Buy Trigger (Breaking Price):
• H1 close above 85,800 (clear break of Fib 0.618 + channel / supply)
• Retest Buy Zone: 85,800 – 86,000
• Targets:
• TP1: 87,500
• TP2: 89,500
• TP3: 91,300
• Stop Loss: Below 85,000
• Idea: This would be an early trend-change signal; only valid if volume and momentum (RSI > 60 on H1) confirm the break.
⸻
5. Fundamental Watch
• Weekend conditions → thin liquidity & gap risk between Sunday open and Monday session.
• BTC remains highly sensitive to US macro data and risk sentiment (equities, DXY, yields). Any upcoming high-impact USD events next week (CPI, PCE, Fed speakers, etc.) can accelerate either continuation or reversal.
• For swing positions, plan size so you can hold across potential gaps, or close before the weekend if uncomfortable with risk.
⸻
6. Key Technical Levels
• Resistance:
• 84,800
• 85,500–85,900 (Golden Zone upper)
• 87,500
• 90,000
• Support:
• 83,450
• 82,500
• 81,000
• 80,600 (major prior low)
• Golden Zone (Short): 84,100 – 85,900
• Break Buy Trigger: > 85,800 (H1 close)
• Break Sell Trigger: < 83,450 (H1 close)
⸻
7. Analyst Summary
• Structure from D1 to H1 is decisively bearish.
• Current consolidation around 84k looks like a pause within the downtrend, not yet a confirmed bottom.
• The highest-probability play remains selling rallies into the Fib Golden Zone (84.5–85.5k), aiming for new lows towards 82.5–81k → 80.6k.
• Countertrend buys are possible off 83.5–83.4k, but only for quick scalps with tight risk.
⸻
8. Final Bias Summary
• Bearish Bias (Primary):
• Valid while price stays below 85.7–86k.
• Prefer Sell Golden Zone and Breakout Sell < 83,450 setups.
• Bullish Bias (Alternative / Reversal):
• Consider only if H1 closes above 85,800 and retest holds.
• Then target 87.5k → 89.5k → 91.3k with higher-timeframe confirmation.
Manage risk: fixed % per trade, no over-leveraging, and be careful holding full size over the weekend gaps. 🚨
⸻
🥇 ElDoradoFx PREMIUM 3.0 – PERFORMANCE 21/11/2025 🥇
🔥 Precision • Momentum • Profit
━━━━━━━━━━━━━━━
📊 XAU/USD – DAILY RESULTS
🟢 BUY +50 PIPS
🔻 SELL +20 PIPS
🟢 BUY +210 PIPS
🟢 BUY +210 PIPS
🟢 BUY +20 PIPS
❌ SELL -40 PIPS (SL)
🟢 BUY +220 PIPS
🔻 SELL LIMIT +210 PIPS
━━━━━━━━━━━━━━━
🔝 SWING TRADES – STILL RUNNING
📈 BUY → +2,850 PIPS
📈 BUY → +1,320 PIPS
━━━━━━━━━━━━━━━
💰 TOTAL PIPS GAIN: +900 PIPS
🎯 8 Signals → 7 Wins (1 SL)
🔥 Win Accuracy: 88%
━━━━━━━━━━━━━━━
Strong close to the week — perfect blend of scalps, intraday setups, and powerful swing continuation!
Congrats if you profited — PREMIUM 3.0 keeps delivering results! 🚀💰
— ElDoradoFx PREMIUM 3.0 Team 🚀

ElDoradoFx – BTCUSD WEEKEND ANALYSIS (15/11/2025)1️⃣ Market Overview
BTC ends the week around 95,700, continuing its strong bearish structure after the previous breakdown below 98,000. Price remains trapped inside a clear descending channel, forming consistent lower highs and lower lows on all timeframes.
The market attempted a recovery but was rejected again at 95,900–96,200, confirming ongoing seller control. Volume remains low heading into the weekend, increasing the risk of liquidity sweeps.
Bias remains bearish while BTC trades below 96,800.
⸻
2️⃣ Technical Breakdown
🔹 Daily (D1)
• Market remains in a sustained downtrend.
• Price rejected from the daily 20EMA and 50EMA zone.
• MACD continues deep in red, no bullish crossover yet.
• RSI ≈ 32–40 → still bearish, pointing toward deeper downside liquidity.
D1 Structure:
Lower high → lower low → continuation towards 94,000 and 93,000 liquidity.
⸻
🔹 H1 (1H)
• Bearish order flow intact.
• Every bullish pullback has been rejected at the 20/50EMA cluster.
• Trendline resistance near 96,200 holds perfectly.
• BOS confirmed to the downside at 95,600.
H1 Bias:
Bearish continuation unless a 1H close above 96,200–96,600.
⸻
🔹 15M–5M (Intraday)
• Micro pullbacks forming lower highs around 95,900.
• Supply zone between 95,900–96,150 producing multiple rejections.
• MACD shows short-lived bullish pushes with no follow-through.
• RSI capped under 50.
Intraday Bias:
Sell pullbacks into supply; avoid buying unless bullish confirmation appears.
⸻
3️⃣ Fibonacci Analysis (Last Swing)
Swing High → 96,800
Swing Low → 94,000
• 38.2% = 95,450
• 50.0% = 95,400
• 61.8% = 95,950
🎯 Golden Zone (Key Rejection Area): 95,400 – 95,950
This zone has already produced strong bearish reactions → high-probability sell zone.
⸻
4️⃣ High-Probability Trade Scenarios
📉 SELL SETUP (Primary Bias – HIGH PROBABILITY)
Sell Zone: 95,400 – 95,950 (Golden Zone)
Entry: Wait for rejection candle or bearish engulfing.
🎯 Targets:
• TP1: 94,800
• TP2: 94,000
• TP3: 93,200 (liquidity zone)
• TP4: 92,500
🛑 Stop Loss: Above 96,250
Why?
Golden Zone retest + downtrend + EMA alignment + channel resistance.
⸻
📉 Breakout Sell Setup (Continuation)
Trigger: Break & close below 94,800
Retest: 94,900–95,050
🎯 Targets:
• 94,000
• 93,200
• 92,500
🛑 Stop Loss: Above 95,400
⸻
📈 BUY SETUP (Countertrend – Lower Probability)
Buy Zone: 94,000 – 93,200
🎯 Targets:
• 95,000
• 95,800
• 96,200
🛑 Stop Loss: Below 92,800
⚠️ Note: Structure remains bearish → buy setups require bullish divergence.
⸻
5️⃣ Fundamental Watch
• Weekend liquidity low → expect stop hunts and fakeouts.
• No major news until early next week (US retail, FOMC speakers).
• DXY remains strong → pressures BTC further.
• Risk markets soft overall → crypto remains vulnerable.
⸻
6️⃣ Key Technical Levels
🔺 Resistance:
• 95,950
• 96,200
• 96,800 (bullish breakout level)
• 97,500
🔻 Support:
• 94,800
• 94,000
• 93,200
• 92,500 (liquidity + structure)
🌟 Golden Zone:
95,400 – 95,950
Breakout Triggers:
• Bullish Breakout: Above 96,800
• Bearish Breakout: Below 94,800
⸻
7️⃣ Analyst Summary
BTC maintains a strong bearish structure across all timeframes. Every bounce is corrective, and sellers remain dominant below 96,800.
The market is gravitating toward 94,000 and possibly 93,200 liquidity.
Best trade:
Sell the Golden Zone 95,400–95,950
or
Sell the breakdown 94,800.
Buying only makes sense at 94,000–93,200 with strong confirmation.
⸻
8️⃣ Final Bias Summary
Overall Bias: Bearish
• Below 96,800 → Sell rallies (preferred).
• Below 94,800 → Continuation to downside.
• Above 96,800 → Bullish shift begins.
⸻
🥇 ElDoradoFx PREMIUM 3.0 – PERFORMANCE 14/11/2025 🥇
📅 High-volatility day with mixed conditions, but strong recoveries and powerful live-session results.
━━━━━━━━━━━━━━━
🪙 XAU/USD (GOLD) Trades
❌ BUY –60 PIPS (SL)
🟢 BUY +110 PIPS
🟢 BUY LIMIT +60 PIPS
🟢 SELL +110 PIPS
❌ BUY –70 PIPS (SL)
🟢 BUY +110 PIPS
---
🎥 LIVE TRADING SESSION
🟡 BUY – BE
🟢 SELL +250 PIPS
❌ BUY –40 PIPS (SL)
🟢 BUY +60 PIPS
🟡 SELL – BE
🟢 SELL +180 PIPS
---
📈 SWING POSITION (From 05/11)
🟩 Floating: +2,850 PIPS
Still running strong.
━━━━━━━━━━━━━━━
💰 TOTAL PIPS GAIN: +710 PIPS
━━━━━━━━━━━━━━━
📊 12 Signals → 7 Wins | 3 SL | 2 BE
🎯 Accuracy: 70%
━━━━━━━━━━━━━━━
🔥 Another profitable day locked in.
👏 Congratulations if you profited!
✅✅✅🚀🚀🚀
— ElDoradoFx PREMIUM 3.0 Team 💼📈

BUY BUY BUYExpectation of interest rate cut + Dollar under pressure and falling
The probability of the Federal Reserve cutting interest rates in December remains at 60%, and the downward trend of real interest rates has not changed. This reduces the opportunity cost of holding Bitcoin. The US Dollar Index has dropped from the 101 level to the 99.8 range, reducing the valuation pressure on non-US assets. And the high correlation of Bitcoin with the Nasdaq 100 Index at 0.75 will benefit from the return of funds from the technology sector simultaneously. At the same time, the uncertainty of global geopolitical situations still exists, and the resonance effect of the hedging attributes of gold and Bitcoin is gradually emerging.
Bitcoin trading strategy
buy:101500-102500
tp:103500-104500
sl:100500

Bitcoin trading strategyThe sentiment in the capital market has bottomed out and is on the rise. ETFs and institutional movements now show positive signals.
The capital side presents a "short-term return + long-term layout" dual support: ① The outflow trend of Bitcoin ETF has slowed down. On November 7th, the transaction amount rebounded to 6.386 billion US dollars, an increase of 23% compared to 5.195 billion US dollars on November 5th. Although BlackRock had short-term redemptions, it simultaneously pushed forward the listing plan of the Australian ETF, indicating that the long-term layout of institutions has not changed; ② The deleveraging in the futures market is approaching its end. The amount of short positions that collapsed in the past 24 hours dropped to 89 million US dollars, a significant contraction of 78% compared to 403 million US dollars on November 4th. The unexercised contracts stopped falling and rebounded to 69.5 billion US dollars, the ratio of long to short positions recovered from 0.9:1 to 1.1:1, and the risk of short squeeze emerged;
③ The stablecoin market has stopped falling and stabilized. The market value of USDT saw a 0.8% minor increase in a single week. The trading volume of stablecoins for BTC below 100,000 US dollars increased by 35% compared to the previous day. The signal of new funds entering the market has begun to appear.
Bitcoin trading strategy
buy:101000-102000
tp:103500-104500
sl:100000

ElDoradoFx – BTCUSD ANALYSIS (08/11/2025, ASIA SESSION)1. Market Overview
BTCUSD is trading around $103,800, posting a strong rebound from the $99,200 liquidity sweep earlier in the week. The bullish momentum is driven by the reclaim of short-term structure and EMA crossovers on intraday charts. While the recovery is technically healthy, BTC now approaches critical resistance between $104,800–$105,400, where rejection or liquidity grabs could occur before continuation.
⸻
2. Technical Breakdown
🔹 Daily (D1):
• The daily structure shows a bullish CHoCH from the 99K demand sweep.
• RSI has recovered from oversold (now 41.2), signaling early trend recovery.
• MACD histogram tightening — selling momentum fading.
• Price is still below the 100EMA (~108K), so overall macro bias remains neutral until 105K–108K is cleared.
🔹 H1:
• Clear BOS confirmed with a sequence of higher highs and higher lows.
• EMAs aligned bullish (20 > 50 > 200).
• RSI near 66, showing strong intraday bullish strength.
• MACD positive, confirming momentum favoring the upside.
🔹 15M–5M:
• Strong intraday trend channel formed with consistent BOS toward 103,800.
• RSI approaching 70 — minor exhaustion likely.
• Pullback to 102,200–101,900 expected before next impulsive wave.
⸻
3. Fibonacci Analysis (Last Swing: 99,249 → 103,895)
Level Price (USD) Note
38.2% 102,200 First retracement area
50.0% 101,570 Mid-zone equilibrium
61.8% 100,940 Strong support confluence
🎯 Golden Zone: 102,200 – 100,940 → Potential re-entry area for continuation buys.
⸻
4. High-Probability Trade Scenarios
📈 Bullish Continuation Setup (Main Bias)
• Entry Zone: 102,200 – 100,940 (Fibonacci Golden Zone)
• TPs: 103,800 → 104,800 → 105,400 → 106,000
• SL: Below 100,600
• Confirmation: Bullish engulfing candle or RSI bounce from 50–55
• Rationale: Break of structure + bullish EMA alignment + increasing volume.
💥 Breakout BUY Setup
• Trigger: 1H close above 104,000
• Retest Zone: 103,800–103,600
• TPs: 104,800 → 105,400 → 106,500
• SL: Below 103,200
📉 Bearish Countertrend Setup
• Entry Zone: 104,800 – 105,400 (Major resistance)
• TPs: 103,800 → 103,000 → 102,200
• SL: Above 105,600
• Confirmation: RSI divergence or bearish engulfing candle on H1/H4
• Rationale: Liquidity trap possible at 105K; short-term overextension.
⸻
5. Fundamental Watch
• Weekend sessions = low liquidity → prone to manipulation and stop hunts.
• DXY holding above 105, limiting BTC upside in the medium term.
• No major US macro data releases until early next week (CPI & PPI).
• Expect Asian session volatility spikes between 1 AM–5 AM UTC.
⸻
6. Key Technical Levels
Type Levels (USD)
Resistance 104,000 / 104,800 / 105,400 / 106,000
Support 103,000 / 102,200 / 100,940 / 99,200
Golden Zone 102,200 – 100,940
Break Buy Trigger > 104,000
Break Sell Trigger < 101,000
⸻
7. Analyst Summary
BTC shows a clean short-term bullish reversal from the 99K base, supported by strong momentum and structure recovery. However, traders should watch closely the 104,800–105,400 zone — a key liquidity cluster where potential profit-taking or rejection could occur.
Pullbacks into 102,200–100,940 remain ideal buy-the-dip zones, targeting 105K+ extension. A confirmed H1 close below 101K would invalidate this bullish bias and reintroduce downside risk.
⸻
8. Final Bias Summary
✅ Primary Bias: Bullish above 102K (Buy dips toward 102,200–100,940)
⚠️ Secondary Bias: Bearish only if rejection forms at 105,400 or break below 101K
⸻
🥇 ElDoradoFx PREMIUM 3.0 – PERFORMANCE 07/11/2025 🥇
📅 Precision. Profit. Live Execution.
━━━━━━━━━━━━━━━
🪙 XAU/USD (GOLD)
🔻 SELL +60 PIPS
🟢 BUY +40 PIPS
🟢 BUY +90 PIPS
❌ BUY -40 PIPS (SL)
🟢 BUY +120 PIPS
---
▶ LIVE TRADING SESSION RESULTS
💥 BUY +100 PIPS
💥 BUY +125 PIPS
💥 BUY +150 PIPS
🧠 Our live sessions continue to deliver consistent profits — traders learned in real-time how to identify clean entries, scale in safely, and secure profits like pros.
━━━━━━━━━━━━━━━
💰 TOTAL PIPS GAIN: +645 PIPS
📊 8 Trades → 7 Wins | 1 SL
🎯 Accuracy: 87%
━━━━━━━━━━━━━━━
🔥 Another powerful day for ElDoradoFx Premium 3.0 — combining analysis, education, and execution all in one live environment.
📈 If you’re not joining the live sessions yet, you’re missing real-time profitable setups every day.
👏 Congratulations if you profited! ✅✅✅🚀🚀🚀
— ElDoradoFx PREMIUM 3.0 Team 💼📊
Today's Bitcoin Trading StrategyThe sector is showing signs of recovery, with major cryptocurrencies leading the way in stabilizing.
The cryptocurrency sector has demonstrated a "leader stabilizing + followers following up" pattern:
① Ethereum led the rebound, with an intraday increase of 2.3% and breaking through the $18,000 mark. As a "leading indicator" of Bitcoin, its rebound strength exceeded that of Bitcoin, confirming the sector's sentiment recovery.
② The correlation with technology stocks has strengthened. Nvidia's market capitalization remains stable at around $3.8 trillion. The risk appetite of technology stocks has not completely reversed, while the correlation between Bitcoin and the Nasdaq index is 0.69. It is expected to rise synchronously with the recovery of technology stocks in the future.
③ Historical patterns show that after Bitcoin's decline exceeds 20% within the year, there is a 92% probability of a rebound in the following 3 months, with an average increase of over 35%. Currently, it has dropped from $12.6 million to nearly 20%, entering a historical rebound window.
Today's Bitcoin Trading Strategy
buy:103000
tp:104000
sl:102000

Today's Bitcoin Trading StrategyThe funds on the blockchain have "massive exodus", and core holdings have loosened.
Chain data reveals a fatal risk: Over the past 7 days, the "super" addresses holding more than 1,000 BTC have decreased by 12, and have transferred a total of 23,000 BTC (approximately 24.15 billion US dollars) to exchanges. Among them, 80% have completed the sale. More importantly, "long-term addresses that have been locked for over 3 years" have for the first time experienced a large-scale unlocking, with a weekly unlocking volume of 18,000 BTC. After these "dead money" turned into "live money", it directly exacerbated market selling pressure. Historically, situations where super and long-term addresses simultaneously reduced holdings have occurred 3 times, each accompanied by at least a 15% price correction.
Today's Bitcoin Trading Strategy
buy:101000-102000
tp:103000-104000
sl:100000

Today's Bitcoin Trading StrategyThe long-term moving average has held firm, and the bottoming-out characteristics are obvious.
The current price of $10,1776 is closely aligned with the 365-day long-term moving average of $10,0367 - this moving average has only been breached twice in the past three years, and each time it was breached, there was a rapid rebound, with the rebounding amplitude being at least 10% or more. More importantly, the price has been in a sideways movement at this level for two days, and has not continued to decline further, just like a ball hitting the ground and starting to bounce without stopping, indicating that there is buying pressure below, and the support level is becoming increasingly stable.
The bull short selling is coming to an end, and selling pressure is running out.
The continuous bull short selling wave in the past has significantly cooled down: the total amount of bull short selling across the network in the past 24 hours has dropped from $60 million to $12 million, with the short selling scale reduced by 80%, and the bull positions in mainstream exchanges have begun to slightly recover (from 38% to 42%). This is like "cutting the" reaching the root, the remaining bulls are either those who are firmly holding or those who are new investors who are buying bottoming, and those who continue to sell are becoming fewer, so the price cannot fall further and there is naturally a rebound space.
Bottoming-out funds are entering the market, and ETF and stablecoins are active.
Although the Bitcoin ETF did not experience a significant inflow in the past 24 hours, the outflow amount has dropped from $50 million per day to $12 million, and the selling pace of institutions has significantly slowed down; at the same time, stablecoins have begun to quietly grow, with the market value of USDT increasing by $320 million in two days. These "pocket money for buying coins" have increased, indicating that someone is preparing to bottom out. Moreover, the chain data shows that more than 100 BTC whale addresses have begun to withdraw coins from exchanges (80 coins were withdrawn in 1 hour), not selling but depositing, which is a typical bottoming-in buying signal.
Today's Bitcoin Trading Strategy
buy:101000-102000
tp:103000-104000
sl:100000

ElDoradoFx – BTCUSD WEEKEND ANALYSIS (02/11/2025, US SESSION)
🧭 1️⃣ Market Overview
Bitcoin retraced after testing the intraday resistance near 111,238, facing rejection at the upper boundary of the descending channel. Price remains supported above 110,000, respecting both the dynamic ascending trendline and 200 EMA on intraday charts. Momentum has cooled but the market still holds a mildly bullish structure unless 109,700 breaks. Volatility is expected to remain moderate heading into early-week sessions.
⸻
📊 2️⃣ Technical Breakdown
✅ Daily (D1)
• Structure: Rangebound between 108,300 and 111,800.
• EMAs: Price hovering between 50 and 200 EMA, equilibrium zone.
• RSI (47): Neutral – no divergence.
• MACD: Histogram flattening; momentum loss after prior bullish impulse.
→ Interpretation: Consolidation phase, waiting for directional breakout.
✅ 1-Hour (H1)
• Clean BOS from 109,600 led to impulsive rise to 111,200.
• Currently retracing toward the 50 EMA and trendline support.
• Key support: 110,100–109,900.
→ Interpretation: Market retesting support after profit-taking; potential bullish re-entry if structure holds.
✅ 15M–5M (Intraday)
• Price rejecting 111,238 and forming short-term lower highs.
• RSI rebounding from 35 – possible micro bullish correction.
• MACD showing first red bars, indicating short-term retracement nearing exhaustion.
→ Interpretation: Possible liquidity sweep around 110,000 before upward continuation.
⸻
📐 3️⃣ Fibonacci Analysis
Swing Range: 109,703 → 111,238
Level Price Observation
38.2% 110,671 Minor support zone
50.0% 110,470 Golden mid-level + EMA confluence
61.8% 110,268 Trendline & structural confluence
✅ Golden Zone: 110,671 – 110,268 (high-probability buy zone)
⸻
🎯 4️⃣ High-Probability Trade Scenarios
🟢 BUY SCENARIOS (Primary Bias)
Scenario A – Golden Zone Reversal (Ideal Setup)
• Entry Zone: 110,671 – 110,268
🎯 TP1 → 111,000 TP2 → 111,238 TP3 → 111,800
🛑 SL → Below 109,900
Scenario B – Breakout Continuation
• Trigger: Break & retest above 111,238
🎯 TP1 → 111,800 TP2 → 112,200 TP3 → 112,800
🛑 SL → Below 110,800
⸻
🔻 SELL SCENARIOS (Alternative)
Scenario A – Breakdown from Structure
• Trigger: Break & retest below 109,700
🎯 TP1 → 109,200 TP2 → 108,600 TP3 → 108,000
🛑 SL → Above 110,200
Scenario B – Rejection from 111,200–111,400 Zone
• Trigger: Bearish engulfing candle rejection.
🎯 TP1 → 110,600 TP2 → 110,000
🛑 SL → Above 111,500
⸻
🕐 5️⃣ Fundamental Watch
• Weekend volatility lower than average; price reactive to liquidity sweeps.
• DXY steady near 104.8 – neutral macro tone.
• ETF accumulation flows remain supportive for mid-term trend.
• Watch US macro data midweek (PMI & NFP) for volatility spikes.
⸻
⚙️ 6️⃣ Key Technical Levels
Type Levels
Resistance 111,238 / 111,800 / 112,200
Support 110,268 / 109,900 / 109,700
Golden Zone 110,671 – 110,268
Breakout Confirmation Above 111,238 or Below 109,700
⸻
🧾 7️⃣ Analyst Summary
BTC continues consolidating within a controlled retracement phase, currently resting in the Golden Zone (110,671–110,268) that aligns with the ascending trendline. Holding above this range favors bullish continuation, while a confirmed break below 109,700 would open downside space. Short-term trades favor long positions within the zone, targeting 111,200–111,800.
⸻
📈 8️⃣ Final Bias Summary
🟢 Bullish bias above 110,200 → Targets 111,200 / 111,800
🔻 Bearish bias below 109,700 → Targets 108,800 / 108,000
⸻

The buying opportunity is clearerThe current price of $111,286 is in a stage of oscillation and accumulation. On the surface, it seems to be fluctuating without direction, but in reality, there is a solid support below. The bulls have sufficient confidence. The main reasons are two:
The "supporting force" below is very stable: After Bitcoin dropped from $12.6 million to over $10.4 million recently, it quickly rebounded. This indicates that there is a strong support at around $10.5 million. Around $110,000 is the "transitional station" of the recent correction, and when it drops to this level multiple times, there will be funds entering to take over, and the selling pressure has been released to a large extent. In addition, 80% of Bitcoin is held for more than one year, and holders are reluctant to sell easily, further strengthening the bottom.
Institutions are still continuously "purchasing": The Bitcoin ETFs of giants like BlackRock have been accumulating shares. The highest weekly inflow can reach $324 million. Currently, the Bitcoin held by these ETFs already accounts for 6.74% of the total supply. More importantly, the amount of Bitcoin purchased by institutions each day is far more than the new Bitcoin mined by miners. There are fewer and fewer Bitcoin available for trading in the market. As long as the buying pressure slightly increases, the price is likely to rise.
Today's Bitcoin Trading Strategy
BTC @ BUY109000-111000
tp:112000-113000
sl:107000

Bitcoin - Looking To Sell Pullbacks In The Short TermH1 - Strong bearish move.
Currently it looks like a pullback is happening.
No opposite signs.
Expecting bearish continuation until the two Fibonacci resistance zones hold.
If you enjoy this idea, don’t forget to LIKE 👍, FOLLOW ✅, SHARE 🙌, and COMMENT ✍! Drop your thoughts and charts below to keep the discussion going. Your support helps keep this content free and reach more people! 🚀

BTCUSD SHORT OPPORTUTY FOR THE WEEKENDBITCOIN SUPPLY ZONE TARGETED - SELL LIMIT SET 🔥
BTC/USD has made a strong move upward but is now approaching a major supply zone, where a Sell Limit is placed at 110997. This level aligns with previous highs and signs of distribution, signaling a potential reversal ahead.
With current price action consolidating around 109034, we are watching for rejection and a possible drop towards the next demand zones at 108551 and 106178.
This setup is ideal for smart traders looking to short the top and ride the retracement. As always, risk management is key. Let’s see how the market reacts.
Precision over prediction. Strategy over emotions.
#BTCUSD #BitcoinAnalysis #CryptoTrading #SellLimit #SmartMoneyConcepts #SupplyAndDemand #TechnicalAnalysis #DayTrading #CryptoSetup #BTCTrade #BearishSetup #PriceAction #CryptoSniper #BitcoinReversal #TradingStrategy #CryptoTraders #MarketStructure #XAUkingCharts

Shorting Analysis on Bitcoin - Fxdollars- {15/04/2025}Educational Analysis says that BTCUSD may give countertrend opportunities from this range, according to my technical analysis.
Broker - BITSTAMP
So, my analysis is based on a top-down approach from weekly to trend range to internal trend range.
So my analysis comprises of two structures: 1) Break of structure on weekly range and 2) External pushback to fill the remaining fair value gap
Let's see what this pair brings to the table for us in the future.
Please check the comment section to see how this turned out.
DISCLAIMER:-
This is not an entry signal. THIS IS ONLY EDUCATIONAL PURPOSE ANALYSIS.
I have no concerns with your profit and loss from this analysis.
I HAVE NO CONCERNS WITH YOUR PROFIT OR LOSS,
Happy Trading, Fx Dollars.

"Bitcoin vs Tether" Crypto Market Heist Plan (Scalping/Day)🌟Hi! Hola! Ola! Bonjour! Hallo! Marhaba!🌟
Dear Money Makers & Robbers, 🤑💰✈️
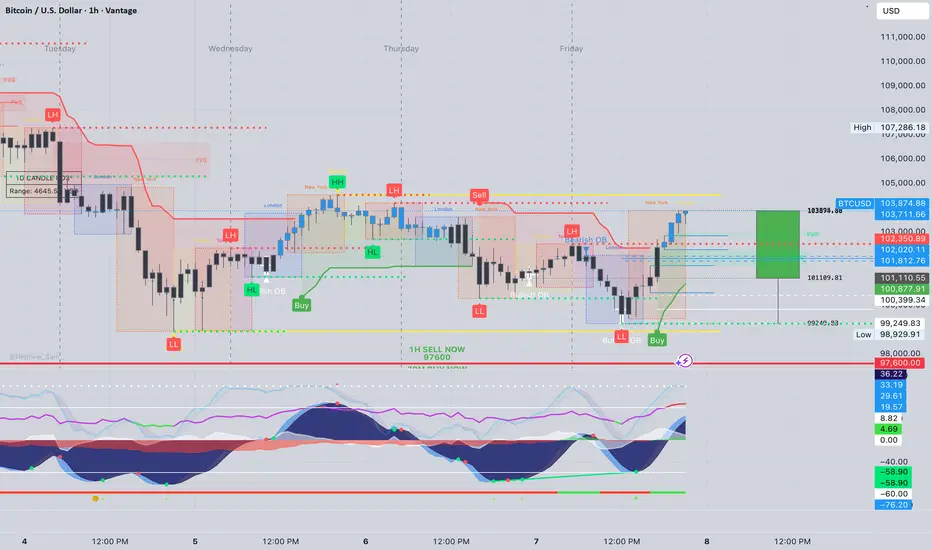
Based on 🔥Thief Trading style technical and fundamental analysis🔥, here is our master plan to heist the "Bitcoin vs Tether" Crypto Market. Please adhere to the strategy I've outlined in the chart, which emphasizes short entry. Our aim is the high-risk Green MA Zone. Risky level, oversold market, consolidation, trend reversal, trap at the level where traders and bullish robbers are stronger. 🏆💸"Take profit and treat yourself, traders. You deserve it!💪🏆🎉
Entry 📈 : "The vault is wide open! Swipe the Bearish loot at any price - the heist is on!
however I advise to Place sell limit orders within a 15 or 30 minute timeframe most nearest or swing, low or high level for Pullback Entries.
Stop Loss 🛑:
📌Thief SL placed at the nearest/swing High or Low level Using the 4H timeframe (81000) Day/Scalping trade basis.
📌SL is based on your risk of the trade, lot size and how many multiple orders you have to take.
Target 🎯: 70000 (or) Escape Before the Target
"Bitcoin vs Tether" Crypto Market Heist Plan (Scalping/Day Trade) is currently experiencing a Bearish trend.., driven by several key factors.👇👇👇
📰🗞️Get & Read the Fundamental, Macro, COT Report, On Chain Analysis, Sentimental Outlook, Intermarket Analysis, Future trend targets... go ahead to check 👉👉👉🔗🔗
Detailed Point Recap 📋
Fundamentals 📊: Strong network + adoption ✅ offset regulatory risks ⚠️—moderately bullish 📈.
Macro 🌍: Inflation aids BTC 🥇, but tight policy/USD weigh ⚖️—mixed 🤔.
COT 📈: Institutional longs 📈 vs. leverage risks ⚡—cautiously bullish ✅.
On-Chain 🔗: LTH bullishness 📈 vs. STH selling 📉—leans positive but capped ⚖️.
Intermarket 🔄: Short-term bearish (equity/USD) 📉, long-term hedging 📈—mixed ⚖️.
Sentiment 😊: Neutral across cohorts ⚖️—lacking conviction 🤷.
Trends 🎯: Short-term downside ($70K) 📉 vs. long-term upside ($129K) 📈—context-driven 🔮.
Outlook 🌟: Neutral now ⚖️, tilting bearish short-term 📉, bullish long-term 📈.
⚠️Trading Alert : News Releases and Position Management 📰 🗞️ 🚫🚏
As a reminder, news releases can have a significant impact on market prices and volatility. To minimize potential losses and protect your running positions,
we recommend the following:
Avoid taking new trades during news releases
Use trailing stop-loss orders to protect your running positions and lock in profits
💖Supporting our robbery plan 💥Hit the Boost Button💥 will enable us to effortlessly make and steal money 💰💵. Boost the strength of our robbery team. Every day in this market make money with ease by using the Thief Trading Style.🏆💪🤝❤️🎉🚀
I'll see you soon with another heist plan, so stay tuned 🤑🐱👤🤗🤩

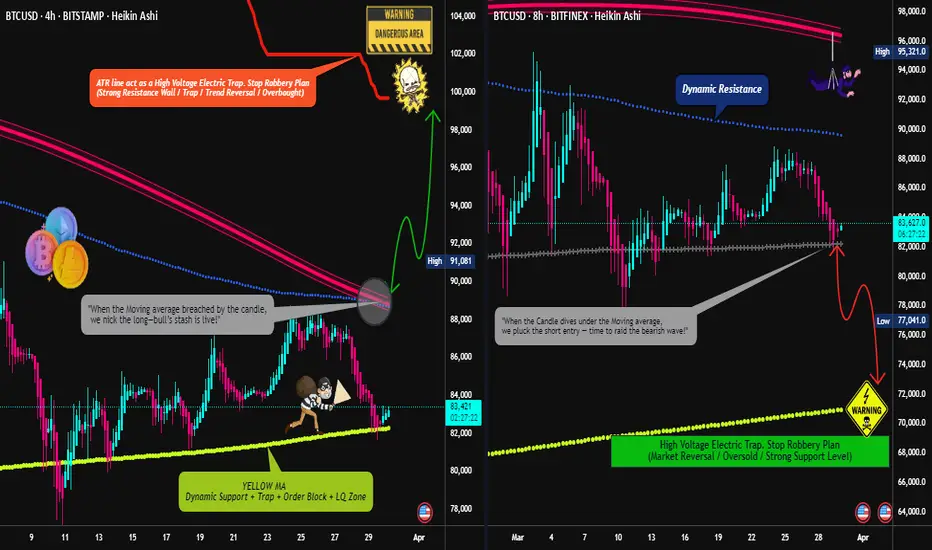
BTC/USD "Bitcoin vs U.S.Dollar" Crypto Market Heist (Swing/Day)🌟Hi! Hola! Ola! Bonjour! Hallo! Marhaba!🌟
Dear Money Makers & Robbers, 🤑💰✈️
Based on 🔥Thief Trading style technical and fundamental analysis🔥, here is our master plan to heist the BTC/USD "Bitcoin vs U.S.Dollar" Crypto Market. Please adhere to the strategy I've outlined in the chart, which emphasizes long entry and short entry. 🏆💸Be wealthy and safe trade.💪🏆🎉
Entry 📈 :
"The loot's within reach! Wait for the breakout, then grab your share - whether you're a Bullish thief or a Bearish bandit!"
🏁Buy entry above 89000
🏁Sell Entry below 81000
📌However, I recommended to place buy stop for bullish side and sell stop for bearish side.
Stop Loss 🛑:
🚩Thief SL placed at 84000 for Bullish Trade
🚩Thief SL placed at 88000 for Bearish Trade
Using the 4H period, the recent / swing low or high level.
SL is based on your risk of the trade, lot size and how many multiple orders you have to take.
Target 🎯:
🏴☠️Bullish Robbers TP 99000 (or) Escape Before the Target
🏴☠️Bearish Robbers TP 72000 (or) Escape Before the Target
BTC/USD "Bitcoin vs U.S.Dollar" Crypto Market Heist Plan is currently experiencing a neutral trend,., driven by several key factors.
📰🗞️Get & Read the Fundamental, Macro, COT Report, On Chain Analysis, Sentimental Outlook, Intermarket Analysis, Future trend targets.. go ahead to check 👉👉👉🔗
⚠️Trading Alert : News Releases and Position Management 📰 🗞️ 🚫🚏
As a reminder, news releases can have a significant impact on market prices and volatility. To minimize potential losses and protect your running positions,
we recommend the following:
Avoid taking new trades during news releases
Use trailing stop-loss orders to protect your running positions and lock in profits
💖Supporting our robbery plan 💥Hit the Boost Button💥 will enable us to effortlessly make and steal money 💰💵. Boost the strength of our robbery team. Every day in this market make money with ease by using the Thief Trading Style.🏆💪🤝❤️🎉🚀
I'll see you soon with another heist plan, so stay tuned 🤑🐱👤🤗🤩
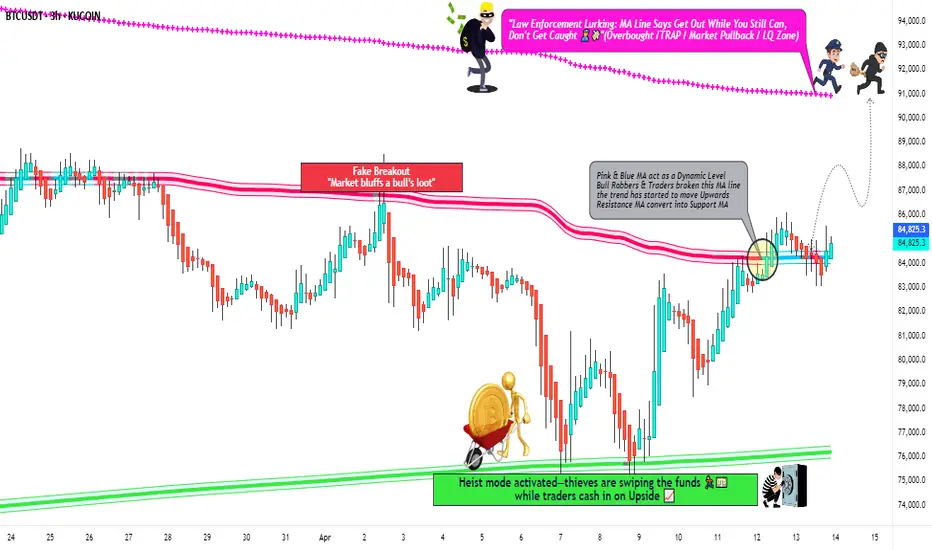
"Bitcoin vs Tether" Crypto Market Heist Plan (Swing/Day)🌟Hi! Hola! Ola! Bonjour! Hallo! Marhaba!🌟
Dear Money Makers & Robbers, 🤑 💰💸✈️
Based on 🔥Thief Trading style technical and fundamental analysis🔥, here is our master plan to heist the BTC/USDT "Bitcoin vs Tether" Crypto Market. Please adhere to the strategy I've outlined in the chart, which emphasizes long entry. Our aim is the high-risk MA Zone. Risky level, overbought market, consolidation, trend reversal, trap at the level where traders and bearish robbers are stronger. 🏆💸"Take profit and treat yourself, traders. You deserve it!💪🏆🎉
Entry 📈 : "The vault is wide open! Swipe the Bullish loot at any price - the heist is on!
however I advise to Place buy limit orders within a 15 or 30 minute timeframe nearest or swing low or high level for pullback entries.
Stop Loss 🛑:
Thief SL placed at the recent/swing low level Using the 30mins timeframe (81000) Day trade basis.
SL is based on your risk of the trade, lot size and how many multiple orders you have to take.
🏴☠️Target 🎯: 91000 (or) Escape Before the Target
🧲Scalpers, take note 👀 : only scalp on the Long side. If you have a lot of money, you can go straight away; if not, you can join swing traders and carry out the robbery plan. Use trailing SL to safeguard your money 💰.
BTC/USDT "Bitcoin vs Tether" Crypto Market Heist Plan (Swing/Day) is currently experiencing a bullishness,., driven by several key factors. 👇👇👇
📰🗞️Get & Read the Fundamental, Macro, COT Report, On Chain Analysis, Sentimental Outlook, Intermarket Analysis, Future trend targets... go ahead to check 👉👉👉🔗
⚠️Trading Alert : News Releases and Position Management 📰 🗞️ 🚫🚏
As a reminder, news releases can have a significant impact on market prices and volatility. To minimize potential losses and protect your running positions,
we recommend the following:
Avoid taking new trades during news releases
Use trailing stop-loss orders to protect your running positions and lock in profits
💖Supporting our robbery plan 💥Hit the Boost Button💥 will enable us to effortlessly make and steal money 💰💵. Boost the strength of our robbery team. Every day in this market make money with ease by using the Thief Trading Style.🏆💪🤝❤️🎉🚀
I'll see you soon with another heist plan, so stay tuned 🤑🐱👤🤗🤩
"Bitcoin vs Tether" Crypto Market Heist Plan (Swing Trade)🌟Hi! Hola! Ola! Bonjour! Hallo! Marhaba!🌟
Dear Money Makers & Robbers, 🤑 💰💸✈️
Based on 🔥Thief Trading style technical and fundamental analysis🔥, here is our master plan to heist the BTC/USDT "Bitcoin vs Tether" Crypto Market. Please adhere to the strategy I've outlined in the chart, which emphasizes long entry. Our aim is the high-risk Red Zone. Risky level, overbought market, consolidation, trend reversal, trap at the level where traders and bearish robbers are stronger. 🏆💸"Take profit and treat yourself, traders. You deserve it!💪🏆🎉
Entry 📈 : "The heist is on! Wait for the MA breakout (87000) then make your move - Bullish profits await!"
however I advise to Place Buy stop orders above the Moving average (or) Place buy limit orders within a 15 or 30 minute timeframe most recent or swing, low or high level.
📌I strongly advise you to set an alert on your chart so you can see when the breakout entry occurs.
Stop Loss 🛑:
Thief SL placed at the recent/swing low level Using the 2H timeframe (83000) swing trade basis.
SL is based on your risk of the trade, lot size and how many multiple orders you have to take.
🏴☠️Target 🎯: 93000 (or) Escape Before the Target
🧲Scalpers, take note 👀 : only scalp on the Long side. If you have a lot of money, you can go straight away; if not, you can join swing traders and carry out the robbery plan. Use trailing SL to safeguard your money 💰.
BTC/USDT "Bitcoin vs Tether" Crypto Market Heist Plan (Swing Trade) is currently experiencing a bullishness,., driven by several key factors.
📰🗞️Get & Read the Fundamental, Macro, COT Report, On Chain Analysis, Sentimental Outlook, Intermarket Analysis, Future trend targets.. go ahead to check 👉👉👉
📌Keep in mind that these factors can change rapidly, and it's essential to stay up-to-date with market developments and adjust your analysis accordingly.
⚠️Trading Alert : News Releases and Position Management 📰 🗞️ 🚫🚏
As a reminder, news releases can have a significant impact on market prices and volatility. To minimize potential losses and protect your running positions,
we recommend the following:
Avoid taking new trades during news releases
Use trailing stop-loss orders to protect your running positions and lock in profits
💖Supporting our robbery plan 💥Hit the Boost Button💥 will enable us to effortlessly make and steal money 💰💵. Boost the strength of our robbery team. Every day in this market make money with ease by using the Thief Trading Style.🏆💪🤝❤️🎉🚀
I'll see you soon with another heist plan, so stay tuned 🤑🐱👤🤗🤩

BTC:Today's trading strategyBitcoin is currently in a continuous fluctuating situation. Yesterday's temporary rally also indicates that it is still unable to break through the resistance level of 89,000 for the time being, and there is a downward extension trend.
The strategy of shorting at the high level yesterday has already yielded profits. Today, on the rebound at a high level, continue to take short positions.
BTC Trading strategy:
Sell@88000-88500
TP1:85500
TP2:84000
Get daily trading signals that ensure continuous profits! With an astonishing 90% accuracy rate, I'm the record - holder of an 800% monthly return. Click the link below the article to obtain accurate signals now!

BTC/USD "Bitcoin vs Tether" Crypto Market Heist Plan🌟Hi! Hola! Ola! Bonjour! Hallo! Marhaba!🌟
Dear Money Makers & Robbers, 🤑💰✈️
Based on 🔥Thief Trading style technical and fundamental analysis🔥, here is our master plan to heist the BTC/USD "Bitcoin vs Tether" Crypto market. Please adhere to the strategy I've outlined in the chart, which emphasizes long entry and short entry. 🏆💸Be wealthy and safe trade.💪🏆🎉
Entry 📈 :
"The loot's within reach! Wait for the breakout, then grab your share - whether you're a Bullish thief or a Bearish bandit!"
🏁Buy entry above 93000
🏁Sell Entry below 84000
📌However, I recommended to place buy stop for bullish side and sell stop for bearish side.
Stop Loss 🛑:
🚩Thief SL placed at 88000 (swing Trade Basis) for Bullish Trade
🚩Thief SL placed at 92000 (swing Trade Basis) for Bearish Trade
Using the 4H period, the recent / swing low or high level.
SL is based on your risk of the trade, lot size and how many multiple orders you have to take.
Target 🎯:
🏴☠️Bullish Robbers TP 11000 (or) Escape Before the Target
🏴☠️Bearish Robbers TP 68000 (or) Escape Before the Target
📰🗞️Fundamental, Macro, COT Report, On Chain Analysis, Sentimental Outlook, Intermarket Analysis, Future Prediction:
BTC/USD "Bitcoin vs Tether" Crypto market is currently experiencing a Neutral Trend (slightly Bearish🐼),., driven by several key factors.
1. Fundamental Analysis⭐⚡🌟
Fundamental analysis evaluates Bitcoin’s intrinsic drivers:
Adoption Trends:
Institutional inflows via Bitcoin ETFs remain strong, with $1.5 billion added in Q1 2025. MicroStrategy holds 300,000 BTC, reinforcing corporate adoption—bullish.
Regulatory Environment:
The U.S. signals a pro-crypto stance with talks of a strategic Bitcoin reserve, boosting confidence—bullish. However, global regulatory uncertainty (e.g., EU tax proposals) adds mild bearish pressure.
Halving Impact:
Post-2024 halving (April), supply issuance dropped to 450 BTC/day. Historical patterns suggest price appreciation 12-18 months later, supporting a bullish outlook for 2025.
Network Usage:
Transaction volume is up 10% year-over-year, driven by Layer 2 solutions (e.g., Lightning Network)—bullish for utility and value.
Inflation Hedge Narrative:
With U.S. inflation at 3.0%, Bitcoin’s appeal as a store of value grows—bullish, though tempered by short-term risk-off sentiment.
Detailed Explanation: Fundamentals are strongly bullish long-term due to adoption, supply scarcity, and macro trends. Short-term bearish pressures from regulatory uncertainty and profit-taking explain the current dip to 87,000.
2. Macroeconomic Factors⭐⚡🌟
Macroeconomic conditions influencing BTC/USD:
U.S. Economy:
Fed rates at 3.0% with no immediate cuts signal tighter conditions—bearish short-term as capital favors yield-bearing assets.
Unemployment steady at 4.2% supports economic stability—neutral.
Global Growth:
China’s GDP growth slows to 4.2%, reducing demand for risk assets like Bitcoin—bearish.
Eurozone PMI at 47.8 indicates contraction, pressuring global markets—bearish.
Currency Markets:
USD strength (DXY at 106) weighs on BTC/USD, as a stronger dollar reduces Bitcoin’s appeal—bearish short-term.
Commodity Prices:
Oil at $68/bbl and gold at $2,950 reflect a mixed risk environment—neutral for Bitcoin.
Geopolitical Risk:
Middle East tensions elevate safe-haven demand, but Bitcoin’s correlation with gold is weakening—neutral to mildly bearish.
Detailed Explanation: Macro factors tilt bearish short-term due to USD strength and global slowdown, countering Bitcoin’s long-term bullish fundamentals. This tension explains the current downward trend from higher levels.
3. Commitments of Traders (COT) Data⭐⚡🌟
COT data reflects futures positioning:
Speculative Traders:
Net long positions at 15,000 contracts, down from 25,000 at the 95,000 peak. Reduced bullishness suggests caution—bearish signal.
Commercial Hedgers:
Net short at 20,000 contracts, stable. Hedgers locking in gains indicate no panic—neutral.
Open Interest:
45,000 contracts, down 10% from February highs. Declining participation hints at fading momentum—bearish.
Detailed Explanation: COT data supports a bearish short-term view. Speculators unwinding longs and falling open interest align with the downward trend, though hedgers’ stability prevents a sharper collapse.
4. On-Chain Analysis⭐⚡🌟
On-chain metrics provide insights into Bitcoin’s network activity:
Exchange Balances:
2.6 million BTC on exchanges, up 5% in March. Rising supply suggests selling pressure—bearish.
Transaction Volume:
Daily volume at $10 billion, flat month-over-month. Lack of growth signals reduced buying interest—neutral to bearish.
HODLing Behavior:
70% of BTC unmoved for over a year (13.8 million coins). Strong holder conviction limits downside—bullish long-term.
Miner Activity:
Miners hold 1.8 million BTC, with minimal outflows. Stable miner behavior supports price floors—mildly bullish.
Realized Price Levels:
Realized cap indicates a cost basis of 78,000 for recent buyers, acting as support—bullish if held.
Detailed Explanation: On-chain data is mixed. Short-term bearish signals from exchange inflows contrast with long-term bullishness from HODLing and miner stability, suggesting a correction rather than a collapse.
5. Intermarket Analysis⭐⚡🌟
Correlations with other markets:
USD Strength:
DXY at 106 pressures BTC/USD inversely—bearish short-term.
S&P 500:
At 5,900, down 2% this week, reflecting risk-off sentiment. Bitcoin’s 0.6 correlation with equities adds downward pressure—bearish.
Gold:
At $2,950, gold rises as a safe haven, decoupling from Bitcoin—neutral to bearish.
Bond Yields:
U.S. 10-year yields at 3.8% attract capital away from risk assets—bearish.
Altcoins:
ETH/BTC ratio at 0.035, with altcoins underperforming Bitcoin, reinforcing BTC’s relative strength—mildly bullish.
Detailed Explanation: Intermarket signals are bearish short-term due to USD strength, equity declines, and yield competition. Bitcoin’s resilience versus altcoins offers some support, but broader risk-off trends dominate.
6. Market Sentiment Analysis⭐⚡🌟
Investor and trader mood:
Retail Sentiment:
Social media analysis shows 45% bullish sentiment, down from 60% at 95,000. Fear of further drops prevails—bearish.
Analyst Views:
Consensus targets range from 80,000 (short-term support) to 100,000 (Q3 2025), reflecting uncertainty—mixed.
Options Market:
Call/put ratio at 0.9, with balanced positioning. No strong directional bias—neutral.
Fear & Greed Index:
At 40 (neutral), down from 70 (greed) in February, indicating cooling enthusiasm—bearish shift.
Detailed Explanation: Sentiment has turned bearish short-term as retail investors react to the decline from 95,000. Analysts’ mixed views and neutral options activity suggest a wait-and-see approach, aligning with the current trend.
7. Next Trend Move and Future Trend Prediction⭐⚡🌟
Price projections across timeframes:
Short-Term (1-2 Weeks):
Range: 84,000 - 88,500
Likely to test support at 86,000-84,000 if selling persists; a bounce to 88,500 possible on relief rally.
Catalysts: U.S. economic data (e.g., CPI on March 12), ETF flows.
Medium-Term (1-3 Months):
Range: 80,000 - 92,000
Below 84,000 targets 80,000 (realized price support); above 88,500 aims for 92,000 if risk appetite returns.
Catalysts: BOJ policy update, institutional buying.
Long-Term (6-12 Months):
Bullish Target: 100,000 - 110,000
Driven by halving cycle, adoption, and inflation hedging—65% probability.
Bearish Target: 70,000 - 75,000
Triggered by global recession or regulatory crackdown—35% probability.
Catalysts: U.S. strategic reserve decision, Q3 GDP data.
Detailed Explanation: Short-term downside to 84,000 aligns with current bearish momentum. Medium-term consolidation reflects macro uncertainty, while long-term upside to 100,000+ hinges on fundamentals prevailing over temporary setbacks.
8. Overall Summary Outlook⭐⚡🌟
BTC/USD at 87,000 is in a short-term bearish correction within a broader bullish cycle. Fundamentals (adoption, halving) and on-chain HODLing support long-term gains, but macro headwinds (USD strength, global slowdown), COT unwinding, and risk-off sentiment drive the current downward trend. Exchange inflows and declining sentiment reinforce near-term weakness, with support at 84,000-80,000 likely to hold. Medium-term recovery to 92,000 and long-term growth to 100,000+ remain plausible if catalysts align.
📌Keep in mind that these factors can change rapidly, and it's essential to stay up-to-date with market developments and adjust your analysis accordingly.
⚠️Trading Alert : News Releases and Position Management 📰 🗞️ 🚫🚏
As a reminder, news releases can have a significant impact on market prices and volatility. To minimize potential losses and protect your running positions,
we recommend the following:
Avoid taking new trades during news releases
Use trailing stop-loss orders to protect your running positions and lock in profits
💖Supporting our robbery plan 💥Hit the Boost Button💥 will enable us to effortlessly make and steal money 💰💵. Boost the strength of our robbery team. Every day in this market make money with ease by using the Thief Trading Style.🏆💪🤝❤️🎉🚀
I'll see you soon with another heist plan, so stay tuned 🤑🐱👤🤗🤩

BTC/USDT "Bitcoin vs Tether" Crypto Market Heist Plan🌟Hi! Hola! Ola! Bonjour! Hallo! Marhaba!🌟
Dear Money Makers & Robbers, 🤑💰✈️
Based on 🔥Thief Trading style technical and fundamental analysis🔥, here is our master plan to heist the BTC/USDT "Bitcoin vs Tether" Crypto market. Please adhere to the strategy I've outlined in the chart, which emphasizes long entry and short entry. 🏆💸Be wealthy and safe trade.💪🏆🎉
Entry 📈 :
"The loot's within reach! Wait for the breakout, then grab your share - whether you're a Bullish thief or a Bearish bandit!"
🏁Buy entry above 89000
🏁Sell Entry below 78000
📌However, I recommended to place buy stop for bullish side and sell stop for bearish side.
Stop Loss 🛑:
🚩Thief SL placed at 84000 (swing Trade Basis) for Bullish Trade
🚩Thief SL placed at 92000 (swing Trade Basis) for Bearish Trade
Using the 4H period, the recent / swing low or high level.
SL is based on your risk of the trade, lot size and how many multiple orders you have to take.
Target 🎯:
🏴☠️Bullish Robbers TP 110000 (or) Escape Before the Target
🏴☠️Bearish Robbers TP 62000 (or) Escape Before the Target
📰🗞️Fundamental, Macro, COT Report, On Chain Analysis, Sentimental Outlook, Intermarket Analysis, Future Prediction:
BTC/USDT "Bitcoin vs Tether" Crypto market is currently experiencing a 🐼Bearish Trend in short term (Trend will expect to move on 🐂Bullish in future),., driven by several key factors.
⭐⚡🌟Fundamental Analysis⭐⚡🌟
Fundamental analysis for BTC involves assessing its intrinsic value based on adoption, utility, network security, and regulatory developments.
Adoption & Utility: By March 2025, Bitcoin adoption has likely continued to grow, with more institutions (e.g., ETFs, corporate treasuries) and countries (e.g., El Salvador-style experiments) integrating BTC. The Lightning Network and other scaling solutions may have matured, enhancing transaction speed and reducing costs, boosting its use case as a payment system.
Network Security: Bitcoin’s hash rate is likely at an all-time high, reflecting robust miner participation despite rising energy costs. Halving cycles (last one in 2024) reduce issuance, reinforcing scarcity at $84,000.
Regulatory Environment: Global regulation remains mixed—some nations embrace BTC (e.g., pro-crypto U.S. policies under a potentially favorable administration), while others (e.g., China) maintain bans. Regulatory clarity in major markets could be a tailwind.
Development Activity: Ongoing upgrades (e.g., Taproot enhancements) signal a healthy ecosystem.
Conclusion: Fundamentals are strong, with scarcity and adoption supporting a bullish outlook, though regulatory risks linger.
⭐⚡🌟Macro Economics⭐⚡🌟
Macro factors influence BTC as both a risk asset and a "digital gold" hedge.
Inflation & Monetary Policy: By 2025, inflation may have moderated from 2022 peaks, but persistent debt levels (e.g., U.S. debt-to-GDP >130%) and money printing could bolster BTC’s appeal as an inflation hedge. If central banks (e.g., Fed) maintain loose policies or cut rates, BTC benefits.
Interest Rates: Higher rates in 2025 (e.g., 3-4%) could pressure risk assets, but BTC’s decoupling from equities (observed in prior cycles) suggests resilience.
Geopolitical Tensions: Ongoing conflicts (e.g., Russia-Ukraine, U.S.-China trade wars) and sanctions drive capital flight to decentralized assets like BTC.
Dollar Strength: A weakening USD (DXY potentially below 100) supports BTC’s rise as an alternative store of value.
Conclusion: Macro conditions lean bullish, with BTC thriving amid uncertainty and dollar erosion.
⭐⚡🌟COT Data (Commitment of Traders)⭐⚡🌟
COT reports from futures markets (e.g., CME Bitcoin futures) provide insight into institutional positioning.
Commercial Hedgers: Likely net short at $84,000, locking in profits after a rally from 2024 lows.
Large Speculators: Net long, reflecting bullish bets by hedge funds and institutions anticipating further upside post-halving.
Small Traders: Overly long and crowded, a contrarian signal of potential short-term exhaustion.
Open Interest: Rising OI at $84,000 suggests strong conviction, but a spike could signal an overleveraged market ripe for a pullback.
Conclusion: Mixed signals—bullish institutional bias with short-term caution due to retail crowding.
⭐⚡🌟On-Chain Analysis⭐⚡🌟
On-chain data reflects real-time network activity.
HODLing Behavior: High percentage of BTC unmoved for 1+ years (e.g., 65%+ of supply) indicates strong holder conviction at $84,000.
Exchange Reserves: Declining BTC on exchanges (e.g., 1.8M BTC vs. 2.5M in 2021) signals reduced selling pressure.
Transaction Volume: Stable or rising volume supports price legitimacy, though a drop could hint at waning momentum.
Realized Cap: Likely near all-time highs, reflecting long-term holders’ profits and new capital inflows.
MVRV Ratio: If above 3 (market value significantly exceeds realized value), BTC may be overbought short-term.
Conclusion: On-chain metrics are bullish, with accumulation outweighing distribution, though overbought risks emerge.
⭐⚡🌟Intermarket Analysis⭐⚡🌟
BTC’s correlation with other markets shapes its trajectory.
Equities (S&P 500): Correlation may have weakened by 2025, but a tech-led rally (e.g., AI stocks) could spill over to BTC.
Gold: Inverse correlation strengthens as BTC gains "digital gold" status—gold at $2,500/oz could coincide with BTC at $84,000.
USD: A declining DXY (e.g., 95) supports BTC’s rise.
Bonds: Rising yields (e.g., 10-year Treasury at 4%) pressure risk assets, but BTC’s safe-haven narrative mitigates this.
Altcoins: If ETH/BTC or other pairs are strong, altcoin outperformance could cap BTC dominance (e.g., 45% vs. 60% historically).
Conclusion: Intermarket trends favor BTC, with selective decoupling from risk assets.
⭐⚡🌟Market Sentiment Analysis (All Investor Types)⭐⚡🌟
Sentiment varies by cohort.
Retail Investors: Euphoric at $84,000 (e.g., X posts screaming "to the moon"), a contrarian sell signal.
Institutional Investors: Optimistic but cautious—ETF inflows (e.g., BlackRock’s BTC ETF) remain steady but not parabolic.
Whales: Accumulating dips (per on-chain data), signaling long-term confidence.
Miners: Selling pressure eases post-halving as higher prices offset lower rewards.
Social Media Trend: Search reveals polarized views—bullish memes dominate, but bearish "bubble" warnings grow louder.
Conclusion: Sentiment is overheated short-term (retail FOMO) but structurally bullish (institutional/whale support).
⭐⚡🌟Next Trend Move Prediction (Short, Medium, Long Term Targets)⭐⚡🌟
Based on technicals, cycles, and above factors:
Short-Term
Target: $92,000 (potential upside) or $78,000 (potential downside)
Prediction: A moderate level of buying pressure could push BTC towards the $92,000 level. However, if selling pressure increases, BTC could drop to $78,000.
Medium-Term
Target: $110,000 (potential upside) or $60,000 (potential downside)
Prediction: A sustained level of buying pressure could push BTC towards the $110,000 level. However, if macroeconomic conditions deteriorate, BTC could drop to $60,000.
Long-Term
Target: $140,000 (potential upside) or $40,000 (potential downside)
Prediction: A strong level of adoption and favorable regulatory environment could push BTC towards the $140,000 level. However, if the global economic outlook worsens, BTC could drop to $40,000.
⭐⚡🌟Overall Summary Outlook⭐⚡🌟
Current State: BTC at $84,000 reflects a strong rally, likely post-2024 halving, supported by fundamentals and macro conditions.
Risks: Regulatory crackdowns, overleverage, or a macro shock (e.g., recession) could trigger sharp declines.
Opportunities: Institutional adoption, dollar weakness, and scarcity drive upside.
Final Call: Short-term Bearish (correction imminent), Medium/Long-term Bullish (uptrend intact).
📌Keep in mind that these factors can change rapidly, and it's essential to stay up-to-date with market developments and adjust your analysis accordingly.
⚠️Trading Alert : News Releases and Position Management 📰 🗞️ 🚫🚏
As a reminder, news releases can have a significant impact on market prices and volatility. To minimize potential losses and protect your running positions,
we recommend the following:
Avoid taking new trades during news releases
Use trailing stop-loss orders to protect your running positions and lock in profits
💖Supporting our robbery plan 💥Hit the Boost Button💥 will enable us to effortlessly make and steal money 💰💵. Boost the strength of our robbery team. Every day in this market make money with ease by using the Thief Trading Style.🏆💪🤝❤️🎉🚀
I'll see you soon with another heist plan, so stay tuned 🤑🐱👤🤗🤩
