BTCUSD 1HOUR SETUUP BUYING TARGET POINT 900001. Price movement: The recent candlesticks indicate a downward trend that’s reversing, highlighted by the blue arrow pointing to an expected upward move.
2. Target point: A horizontal blue line marks a target price around 90,442.29 USD, suggesting the next bullish objective if the breakout succeeds.
3. Support & resistance: The red line traces a smoothing curve (possibly an EMA) that acted as dynamic resistance during the decline and is now being broken, signaling potential bullish momentum.
4. Pattern: The shaded blue area on the left hints at a prior bullish breakout that’s being mirrored in the current setup, implying a similar upward swing could follow.
5. Current price: Bitcoin is trading near 86,794.16 USD, with the immediate resistance at the recent high of 88,363.01 USD.
Overall, the analysis suggests a bullish outlook if the price sustains above the red curve and pushes toward the TARGET POINT of ~90.4k USD.
📈👊
Btcusdupdate

BTC/USD (4H timeframe) ....BTC/USD (4H timeframe) on Bitstamp, and the chart shows:
A downtrend breakout from a descending trendline.
Ichimoku Cloud turning bullish (price breaking into or above the cloud).
A support zone around $100,000 – $101,000.
Two target points already drawn on my chart.
Based on the structure:
📈 Bullish Scenario
If BTC confirms the breakout and stays above the descending trendline and cloud:
First Target: around $110,000 – $111,000
Second Target: around $116,000 – $118,000
These match the levels marked on my chart and align with:
Cloud breakout projection
Prior supply/resistance zones
Fibonacci 0.618–1.0 retracement zone (rough estimate)
⚠ Invalidation / Stop-Loss
If BTC closes below the grey support box (~$100,000), it would invalidate the bullish setup — likely signaling more downside.

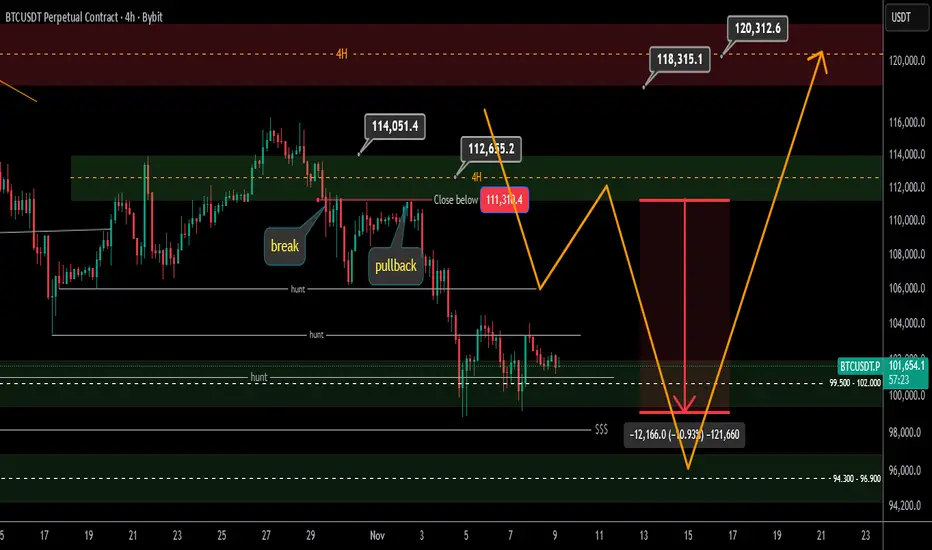
Bitcoin Update Time Frame 4 Hours
Hi Traders
Bitcoin Update Time Frame 4 Hours So far, according to the analysis, we have had losses and profits above $12,000, and as expected, three of the four liquidity levels we are considering have been hunted, and only the liquidity level of 98,000 remains, which, with the hunt of this fourth level at the support of 94,000 to 96,000 (more precise number on the chart), was looking for a trigger buy for high liquidity. I hope you are also in profit
Analysis link:
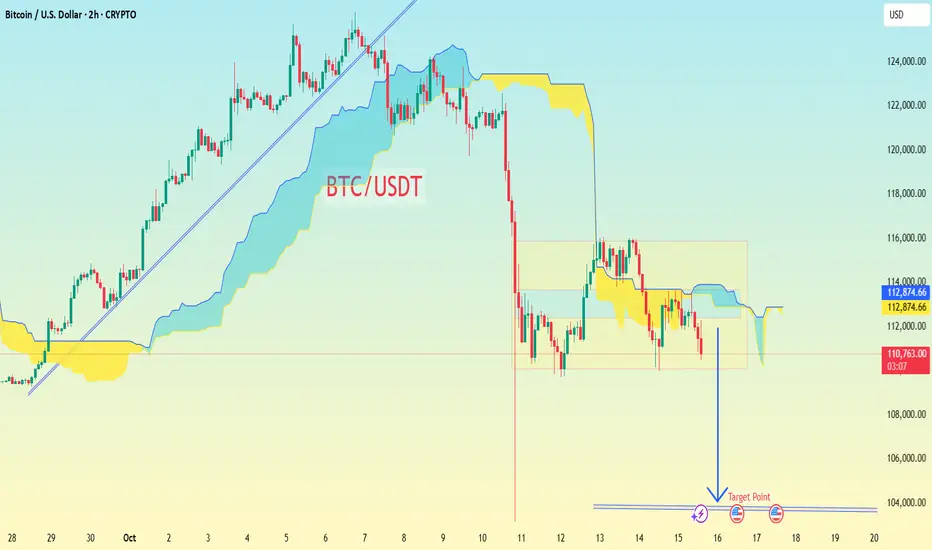
BTC/USDT chart 2-hour timeframe...BTC/USDT chart 2-hour timeframe with Ichimoku Cloud and some support/resistance levels drawn.
Here’s what I can observe from the chart:
Current price: ≈ $110,520
Price structure: Clear break below support after a consolidation box (yellow rectangle).
There’s a downward arrow pointing to a “Target Point” around the price level 103,828 USDT.
This level appears to be the next major support zone based on my drawing.
📉 Short-term downside target
Based on the chart:
Primary target: $103,828 (as marked on my chart)
This target aligns with a measured move after breaking out of the consolidation range.
Next strong support zone is likely around the $103K–$105K area.
⚠ Important Note:
This is not financial advice — crypto markets are highly volatile. Targets can change quickly with volume spikes or fakeouts. Always use stop losses and manage risk appropriately.
BTC/USD (Bitcoin) chart on the 1D (Daily) timeframe..BTC/USD (Bitcoin) chart on the 1D (Daily) timeframe 👇
✅ Current Price: around $115,000
✅ Structure: Price bounced perfectly from the ascending trendline and cloud support zone.
✅ Trend: Bullish recovery forming after correction.
---
🎯 Target Levels
1. Primary Target: $122,000 – $124,000
This matches my marked “Target Point” area on the chart.
It’s also near the previous swing high and upper resistance zone.
2. Extended Target (if breakout continues): $126,000 – $128,000
Possible if daily candle closes above $124,000 with strong momentum.
---
🛡 Support / Stop-Loss
Strong support zone: $112,000 – $113,000 (trendline + Ichimoku cloud base).
Stop-loss (swing setup): below $111,000 — a clean invalidation of bullish structure.
---
🔍 Summary
Trend bias: Bullish
Buy zone: $114,000 – $116,000
Target 1: $122,000 – $124,000
Target 2: $126,000 – $128,000
Stop-loss: below $111,000

BTC/USD (1H timeframe).BTC/USD (1H timeframe).
Price is around 121,470 after breaking down from support near 123,300 and trading below the Ichimoku cloud.
Bearish Targets:
1. First Target Zone → 117,500 – 117,000
(this is the first marked target in my chart, a strong support zone).
2. Second Target Zone → 114,500 – 114,000
(deeper bearish target, second marked point).
📉 As long as BTC stays under 123,300, downside continuation toward 117,500 → 114,500 looks possible.

BTC/USD Supply Zone Rejection – Short Setup Towards 111,450Pair & Timeframe
BTC/USD on the 1-hour chart.
The chart is showing intraday to short-term trading levels.
2. Current Market Structure
Price has been moving in a downward channel (bearish trend).
Multiple lower highs and lower lows confirm the downtrend.
Recently, price broke a bit above the channel but got rejected in the supply zone.
3. Supply Zone
Marked between 115,318 – 116,118 USD.
This is an area where sellers are expected to step in (previous breakdown zone).
Price reacted from this zone and is showing bearish continuation.
4. Trade Setup
Entry Point: ~115,337 USD
Stop Loss: 116,118 USD (just above supply zone to protect against false breakout)
Target Point: 111,468 USD
This gives:
Risk (SL – Entry) ≈ 781 USD
Reward (Entry – Target) ≈ 3,869 USD
Risk-to-Reward Ratio (RRR) ≈ 1:5, which is very favorable.
5. Current Price Action
BTC currently trading around 114,614 USD (below entry).
If price retests supply zone again but fails to break above, bearish continuation is likely.
If BTC breaks and closes above 116,118 USD, this short setup becomes invalid.
6. Outlook
Bearish bias as long as BTC stays under 116,118 USD.
High probability move toward 111,450 – 111,468 USD support zone.
If price holds above 116,118 USD, it could flip bullish and retest 117k+ levels.
✅ Summary:
This is a short setup based on supply zone rejection within a broader downtrend. The risk-to-reward is excellent (1:5), but watch for a false breakout above 116,118 USD.

BTC/USD Bullish Order Block Setup – Targeting 114,328BTC/USD (1H) Analysis
Trend & Structure: Price has been respecting a rising channel with clear support and rejection lines. After testing the support line, it rebounded and is now consolidating.
EMA Strategy: Price is fluctuating around the 70 EMA (111,081) and 200 EMA (110,902), showing short-term consolidation. A bullish crossover above 70 EMA may confirm further upside momentum.
Order Block (OB) Zone: The marked OB Buying Zone (109,261 – 110,252) is a strong demand area where buyers are expected to step in.
Support & Resistance: Support lies at 109,261, while the next resistance/target is 114,328.
Risk-Reward Strategy: A potential long entry from the OB zone offers a favorable R:R ratio toward the 114,328 target point. Stop loss ideally below 109,246.
Price Action: Recent wicks suggest rejection of lower levels, strengthening the bullish bias.
✅ Signal: Buy from OB Buying Zone (109,261 – 110,252)
🎯 Target: 114,328
🛑 Stop Loss: Below 109,246
Overall Bias: Bullish continuation if price respects the OB buying zone and EMA support.

BTC/USD – FVG Buy Zone Setup Targeting $113KChart Overview (BTC/USD 30m)
Price is currently trading at $110,517.
EMA 70 (111,276) above price → short-term bearish.
EMA 200 (110,598) acting as immediate support zone.
📐 Trend & Channel Strategy
Market is moving inside an ascending channel (support & projection line).
Price recently retraced to the support line → potential bullish continuation.
🎯 Supply & Demand / FVG Strategy
FVG Buying Zone: $109,583 – $110,217 highlighted (strong demand zone).
Entry around this zone expected to trigger a bullish reaction.
📊 EMA Crossover Strategy
EMA70 > EMA200 previously → bullish structure.
Current retest of EMA200 is key → holding above signals continuation to upside.
💎 Price Action Strategy
After strong drop, price tapped into support + FVG zone.
Wick rejection suggests buyers stepping in.
🎯 Target & Risk Management
Target Point: $113,053 – $113,064.
Stop Loss: Below $109,583 (to protect against breakdown).
Risk/Reward ratio looks favorable (approx. 1:3).
✅ Conclusion:
BTC is in an uptrend channel. After retesting the FVG buying zone & EMA200, buyers are likely to push price back toward $113,000 target 🚀📈. A break below $109,583 would invalidate this bullish setup.

BTC/USD (Bitcoin – 4h).BTC/USD (Bitcoin – 4h, Bitstamp). It’s showing a bearish structure after breaking trendline support and multiple ChoCH (Change of Character) signals.
Key Levels on my Chart:
Current Price: ~110,716
Broken Support Zone: ~112,725 – 113,394
Target Point 1: ~106,000
Target Point 2 (extended): ~98,000
Technical Outlook:
Price has broken below the upward trendline and is now retesting lower levels.
The rejection from ~113K adds strength to the bearish momentum.
The Ichimoku cloud is bearish, with price trading below it.
My chart suggests a downside continuation, with first target ~106K, and if momentum continues, the next downside target is ~98K.
👉 Targets:
Short-term target: 106,000
Extended target: 98,000

Summary of the Bitcoin Market This WeekThis week, the Bitcoin market showed a trend of steady increase and broke through the key resistance level.👉👉👉
Technically, the MACD indicator on the daily chart shows a strong bullish signal, and the price has also held above the key moving average, confirming the short - to medium - term upward trend. Overall, market sentiment is relatively optimistic, and investors' expectations for it to break through the psychological barrier of $100,000 have increased. However, when Bitcoin approaches the $98,000 level, it may form a short - term resistance, and as the price gets closer to the $100,000 mark, the overly optimistic market sentiment also increases the risk of a pullback.
The better than expected performance of the US job market has alleviated recession concerns, boosted the sentiment of risky assets, and provided support for Bitcoin. Meanwhile, the signs of easing in US - China trade relations have had a positive impact on the global financial markets, including the cryptocurrency market.
This week, the Bitcoin market has performed strongly driven by various factors. Both on-chain data and market indicators have shown positive signals. However, during the process of price increase, it's also necessary to pay attention to the potential risk of a pullback.

BTC/USD Moving In Range,Best Place To Buy And To Sell Very ClearThis Is An Educational + Analytic Content That Will Teach Why And How To Enter A Trade
Make Sure You Watch The Price Action Closely In Each Analysis As This Is A Very Important Part Of Our Method
Disclaimer : This Analysis Can Change At Anytime Without Notice And It Is Only For The Purpose Of Assisting Traders To Make Independent Investments Decisions.

$BTCUSDT (NEXT MOVE?)Following our previous target of the 54,400 zone. BINANCE:BTCUSDT is at a key pivotal point where falls below could spell doom for the crypto giant however if price maintains above this zone by this month's end, we're poised to see new highs

BTCUSD trading idea is ready ✅✅Hi Traders BTCUSD price is ready to fly
BTCUSD currently experiencing worldwide
Up trend has reached its highest price ever
I predict that the market will bounce back
From the resistance level move towards the Nearby support level
BTCUSD BUY FROM 66324
TARGET ZONE. 70307
If this post is useful for you
You can support me with like
And advice comments

BTCUSD Trading idea Hi Traders BTCUSD price is ready to fly
BTCUSD is currently experiencing a worldwide
Up trend and has reached its highest price ever
I predict that the market will bounce back
From the resistance level move towards the Nearby support level
BTCUSD Trade From 89824
Target zone. 76324
Give us like and advice comments

BTCUSD Pushed From Strong Res , Hit 58K Soon Before Going Up ?This Is An Educational + Analytic Content That Will Teach Why And How To Enter A Trade
Make Sure You Watch The Price Action Closely In Each Analysis As This Is A Very Important Part Of Our Method
Disclaimer : This Analysis Can Change At Anytime Without Notice And It Is Only For The Purpose Of Assisting Traders To Make Independent Investments Decisions.

Bitcoin IdeaBitcoin Idea | BTCUSD |
BINANCE:BTCUSDT INDEX:BTCUSD
✅ ✅ Risk warning, disclaimer: the above is a personal market judgment and analysis based on published information and historical chart data on The trading view,
And only some of these analyzes are my actual real trades.
I hope Traders consider I am Not responsible for your trades and investment decision.

BTC/USD Long Setup After Perfect Bullish Price Action,40000.0 ?This is an educational + analytic content that will teach why and how to enter a trade
Make sure you watch the price action closely in each analysis as this is a very important part of our method
Disclaimer : this analysis can change at anytime without notice and it is only for the purpose of assisting traders to make independent investments decisions

BTC/USD Making Double Bottom ,2 Long Setups After Confirmation !This is an educational + analytic content that will teach why and how to enter a trade
Make sure you watch the price action closely in each analysis as this is a very important part of our method
Disclaimer : this analysis can change at anytime without notice and it is only for the purpose of assisting traders to make independent investments decisions

BTC/USD New Long Setup To Get At Least 500 Pips For Free !This is an educational + analytic content that will teach why and how to enter a trade
Make sure you watch the price action closely in each analysis as this is a very important part of our method
Disclaimer : this analysis can change at anytime without notice and it is only for the purpose of assisting traders to make independent investments decisions

BTCUSD Hit All Targets +350 Pips , New Update In This VideoThis is an educational + analytic content that will teach why and how to enter a trade
Make sure you watch the price action closely in each analysis as this is a very important part of our method
Disclaimer : this analysis can change at anytime without notice and it is only for the purpose of assisting traders to make independent investments decisions

BTCUSD Running In 300 Pips Profits , New Entry After 4h ClosureThis is an educational + analytic content that will teach why and how to enter a trade
Make sure you watch the price action closely in each analysis as this is a very important part of our method
Disclaimer : this analysis can change at anytime without notice and it is only for the purpose of assisting traders to make independent investments decisions

BTCUSD Made Double Top Pattern,Short Entry After D Confirmation This is an educational + analytic content that will teach why and how to enter a trade
Make sure you watch the price action closely in each analysis as this is a very important part of our method
Disclaimer : this analysis can change at anytime without notice and it is only for the purpose of assisting traders to make independent investments decisions
