Bitcoin Breakout: $112.4K → $117.4K Target in PlayMarket context & structure
BTC has shown a steady climb into the current area: the market printed a sequence of higher lows through the first days of September and just produced a strong impulse leg into the 112k zone. That move carried price above a short-term trendline and absorbed nearby selling interest, which is bullish structure on the 1-hour timeframe. The recent pullback is shallow and looks like a classic retest of breakout area rather than a failure — buyers keep stepping in around the 107–109k region historically, which supports further upside attempts.
Technical reasons to be bullish (justification)
• Higher lows / higher highs pattern on the 1H — the structure favors continuation while this remains intact.
• Break & retest behavior: price cleared the minor resistance area near 110–112k and is holding above that band after the retest. That suggests a higher-probability long opportunity rather than a fresh breakout-fail.
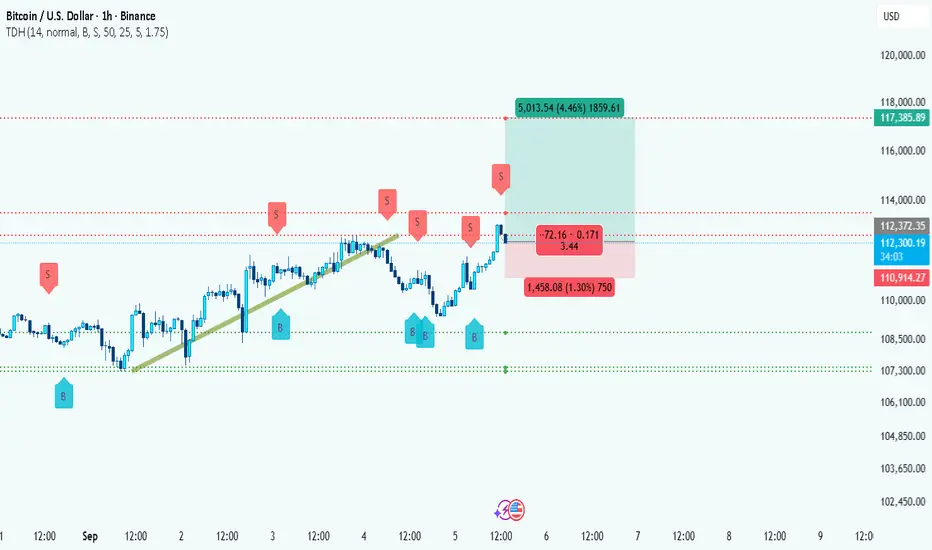
• Clear targets and measured move: the chart’s long setup projects an upside objective near ~117,385, which aligns with a visible supply cluster and a logical liquidity magnet above current price.
• Healthy R:R on the plan: the trade on the chart shows a relatively small stop compared with the upside objective, producing a favorable reward-to-risk.
Key chart levels (visible on your image)
• Entry area: ~112,350 – 112,400 (current price zone).
• Stop (chart): 110,914 (invalidation below recent control).
• Primary target (T1 / chart): 117,385 (main upside objective / supply cluster).
• Lower support band to watch: ~107,300 – 108,800 (previous demand area; if price returns here buyers typically reappear).
________________________________________
Trade setup (clear, bullet format)
• Entry: Long around 112,350 – 112,400.
• Stop-loss: 110,914 (≈1,445 points below entry; ~1.3% risk).
• Take Profit (T1): 117,385 (~5,026 points above entry; ~4.5% upside).
• Risk : Reward: ≈ 3.5 : 1 (T1 vs SL).
________________________________________
Trade management & partial-profit rules
• Partial profit booking (recommended): take 30–40% off the position once the trade is ~+2% to +2.5% in profit (roughly 114,500 – 115,000 on this setup). Locking a portion early secures gains and reduces emotional pressure.
• After partials: move the stop on the remaining position to breakeven (entry) once the partial is taken — this converts the remaining position into a free trade.
• Trailing: for the rest, trail the stop under each 1H higher low as price advances (or use a volatility-based trail, e.g., 1.5× ATR(14,1H)). This captures extended upside while protecting profits.
• Second take profit: scale out another 30–40% near the charted target 117,385; leave a small runner if you want exposure to an extended move above that level.
• If price falls to SL: accept the loss and re-evaluate structure — a clean hourly close below 110,914 invalidates the bullish plan.
Risk and event notes
• Keep position sizing so the trade risk stays within your rule (commonly 1–2% of account).
• Be cautious around macro windows (FOMC, US data, high-impact crypto news) — these can cause slippage and sharp volatility on the 1H. Consider reducing size or tighter management near scheduled events.
• Watch for false breakouts: if price stalls and fails to hold the breakout band for several hourly closes, avoid scaling in further.
________________________________________
Short summary
The 1H structure favors a bullish continuation as long as price holds above the breakout/control band and 110,914. The charted plan offers a high R:R (~3.5:1) to ~117,385. Use staged profit-taking (30–40% at ~+2% — ~114.5k), move stop to breakeven, and trail the remainder under 1H higher lows to maximize capture while protecting gains.
Would you like those same levels formatted as a one-line social caption and a short post-ready blurb you can drop under the chart?
Btsusdtlong
BTCUSDT Long IdeaPlease consider and calculate loss before profit and manage risk properly
We are trying to enter support and resistance areas with the lowest amount of stop loss and the highest amount of expected profits
We have resistance around 23500-24000, if we can pass it, we must make sure that we breach 28000-29000 levels to continue to the target.
If this idea suits you, please like and follow me
thanks

BTC ANALYSISPsychological Analysis: The market is strongly bearish and more and more FUD is loading. For now, FTx uncertainty regarding CRYPTOCAP:SOL is loading as we predicted a few months ago when watched the FTx data. It's not only CRYPTOCAP:SOL that is affected, but the entire Altcoin and BTC sector. We enter into the phase of FUD and fear which has not even started yet. Meanwhile, market makers are fake pumping altcoins to liquidate those shorts from above with sudden fake pumps, just to nuke it afterwards. It gives us hints that market makers know BTC's next move, and want to take out most of altcoin shorts with these fake pumps. At the same time, they send BTC into the boring sideways zone. Indeed, the next BTC leg down will fully nuke the Altcoin sector. You have been warned. For now, I am watching several options we might see for BTC before hitting my final target of $ 23,500. The best short entry for those that missed my call at 31k region is currently at $28.600 region. Pray that the market allows you to visit again if it happens. I would add more to my shorts. I have been mentioning $28.600 for a longer time to retest the breakdown of MA100 which happened on the 17th of August. So far we have not retested the breakdown, and at the same time, a big liquidity pool is perfectly matching in the same region. There are more than enough reasons for market makers to bring it to the $ 28,600 region. This is not a long call! However, general information on what might be the next moves of the market makers. Be prepared for all scenarios. All in all, zoom out, and the final target remains on the downside with a target of $23.500 as we spoke about an incoming sideway movement that took place as expected. This week is more volatile if important numbers released on Wednesday (CPI) and Thursday (PPI) are higher or lower than the expected numbers.
#BTC #BINANCE #FUTURES #TRADING

BTS/USDT 🚀 Target 2 Achieved 51.82% ✅🚀#BTSUSDT
BoooooooM 🚀🚀
Target 2️⃣ : done✅
Entry price: 822$✅
Price reached : 1248$ ✅
Profit: 51.82% ✅🚀🚀🤑
The BTS/USDT spot trade on Binance has soared to new heights, delivering exceptional profits to traders. We're delighted to inform you that Target 2 has been successfully reached, generating an impressive profit of 51.82%. This trade demonstrates the lucrative opportunities available in the dynamic world of cryptocurrency trading.

BitShares (BTS) formed bullish Gartley for upto 62.50% pumpHi dear friends, hope you are well and welcome to the new trade setup of BitShares ( BTS ) coin with US Dollar pair.
Previously we caught more than 21% pump of BTS , and was very close to hit the sell target, but dropped down.
Now on a 4-hr time frame, BTS has formed a bullish Gartley pattern.
Note: Above idea is for educational purpose only. It is advised to diversify and strictly follow the stop loss, and don't get stuck with trade


btcusdt20798-21530 (4h) no trade zoon
btc form in a ascending channel
scenario 1: Break 21530 long
scenario 2: Break 20795 short

Alright let's have an #update on #bitcoinI'm sure you remember the previous #analayz on #bitcoin that we had before and of course, it was perfectly predicted as we expected, so for an update, I'm sharing the latest idea that I'm thinking of and I already marked everything on the chart for you, but remember this is just an idea and it doesn't have any #trading #setup on it, so if you are using this #ta try to use it with a trading #setup #mixed for taking opportunities on the market!
#stay #safe

BTC/USD 1 DAY ANALYSIS BY CRYPTOMOJOWelcome to this quick update, everyone.
If you are reading my updates for the first time do follow me to get more complex charts in a very simplified way.
I also post altcoin setups on Spot, Margin, and Futures.
I have tried my best to bring the best possible outcome in this chart.
In a higher time frame, BTCUSD is trending under this big channel.
Currently, it is trending around 38800 support levels.
First scenario: if BTCUSD break and close above the $39.5k-$40.5k level then we are expecting The first Bounce up to 45k level.
Second scenario: here we have $38800 level as local support if BTCUSD break and closes downside this level then we are expecting a drop up to $36500.
What's your thought on this?
Do hit the like button if you like this update and share your views in the comment section.
Thank you
#PEACE

Dont let them take your Bitcoin this cheapAlready posted my bearish thesis, heres a bullish ones.
Up Only.

BTSUSDT CallBuy some BitShares at the entry level and HODL for a while. As I've always said, whenever you are in profit, you can take it and enjoy (before touching the final target). All the targets are shown on the chart. Cheers!

#BTSUSDTHello all traders hope you all in profit
gala chart1dayfirm
i see in this chart pattern make hammer
hammer is bullish signal
#BTSUSDT
recommended highly : tp1
recommended medium : tp 2
very risky but huge profit : tp3

BTC long setupThe chart is self explanatory. If you have any questions please don't hesitate to ask.

BTC/USDTBTC looks Bullish. Following are entries and take profit zones for the spot.
As always, Greens are entries and Whites are take profit zones. Place your SL(If needed) according to your own risk management.
All targets are based on proper TA.
NFA, Do your own research.

BTSUSDT 1D BUYBTS is forming a systematic tringle in 1D timeframe. Its so bullish at the moment. Buy after the breakout or you can entry now. Easily 20% profit from here.
Thumps up if you like my setup.

BTSUSDT 4H: Possible LONGBTSUSDT 4H: Possible LONG
After breaking through the level of 0.05200, further growth to the level of 0.06800 is possible


BTSUSDT 1D: Possible LONGBTSUSDT 1D: Possible LONG
Breakdown of the level of 0.04800 and the subsequent forecasted possible growth to the level of 6.800

BTS plays🎶🎵🎙 $BTS #BTSBTS plays. After the failure of the downtrend, BTS is ready to start its growth.
Currently, due to the increase in the bitcoin range and its movements, all altcoins will be affected by it. The analysis is just a series of probabilities.
I hope you find this analysis useful🌹
Follow for more...

Bitcoin state of affairsIF JP Morgan says 35k is fair price value for Bitcoin, then I guess they meant it. I don't think their quants would be far off either. Bullish sideways not ruled out. Hard to be bearish on Bitcoin ever again tbh but we'll just pretend for the sake of it that not constantly going up is "bearish" and that still stands at the previous ATH of 20k.


BTSUSDT Waiting for the Resistance Zone Breakout!BTSUSDT (1H Chart) Technical Analysis Update
Waiting for the resistance zone breakout
BTS/USDT currently trading at $0.1249
Buy-level: Above $0.138(only buy if 1H candle closes above $0.138)
Stop loss: I will update once I see the breakout
Target 1: $0.144
Target 2: $0.155
Target 3: $0.165
Max Leverage: 3X
ALWAYS KEEP STOP LOSS...
Follow Our Tradingview Account for More Technical Analysis Updates, | Like, Share and Comment Your thoughts.

BTSUSDT FORMING CUP AND HANDLEHello. I'm seeing a cup and handle formation. Should see a second closure above blue line before confirming long trend. not a financial advice, just my view. Cheers.
