BTT can Rise againBTT is at very bottom price again and it can rise in the coming months to the previous ATH
Bttc
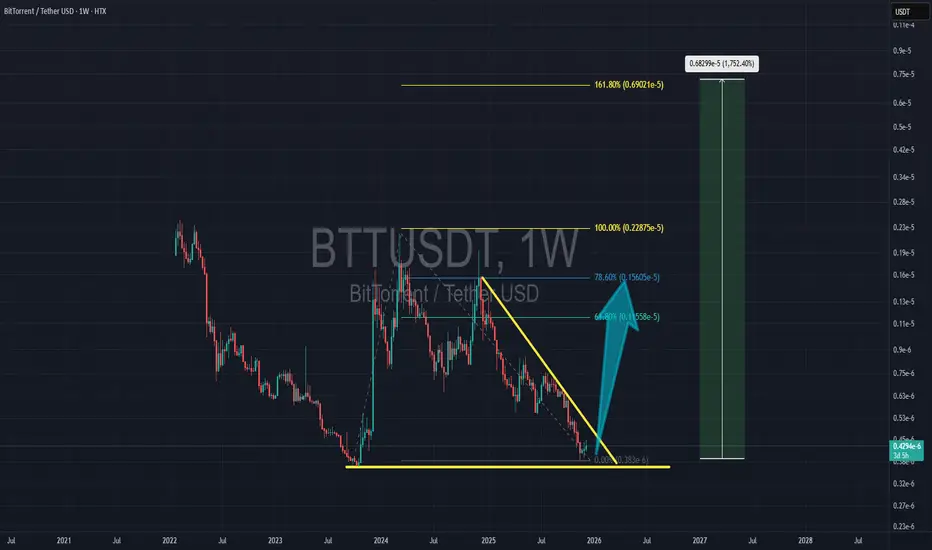
BTT: Potential Comeback, Huge Support#BTT is nearing a major support level that started a strong bullish wave back in Oct 2023. Since Mar 2024, it has been in a presumed corrective wave for nearly two years.
As long as it stays above 0.000000363 (the stop-loss), a potential rise is expected.
#Bittorrent #BTTC
ATCryptoScan: BTCUSD Waiting to spring into 2026 TOPSo, from previous posts... outcome comments in white. Self-explanatory, close enough, good enough.
Importantly, going forward...
1. wide range moves expected
2. 100K bounce in December, rally to Top
3. Top likely 160K in early Feb 2026
Technically, MACD is losing steam, but it price can be pumped. Weekly candlesticks have a bit of a bullish harami, so look out until Monday for a strong bounce to end the week bullish. Else, pushing down to 100K to make a sandwich stack candlestick.
Heads up yeah?
Short sharp and sweet...

BitTorrent - Tron's AlphaBitTorrent is an old coin on the Tron's Network TRX.
I think the Tron's Network run didn't end for good and shall return in multiple tokens in this chain.
BTT or BTTC shall have a mega run that should pass above $0.00000250 in my opinion.
But first, I think a last dip around $0.00000050 : $0.00000060 shall occur first.
A soft cancellation of this idea is passing $0.00000097 without dropping first to the expected area above. Passing $0.00000220 is a final cancellation of this idea.

BTTCUSDT(BitTorrent) Updated till 08-09-24BTTCUSDT(BitTorrent) Daily timeframe range. PA is holding the current level for a while now. which is good compare to the market. its trying for 0.00000096 a little bit volume may help it there. closing above clean can push it further. local support at 0.00000072.

Tagets 152%, 358%, 600%, 864%......BitTorrent Token is one of the coins I invested in. This is trade (investment) setup on larger timeframe. I am not looking to reach targets 2,3,4 and 5 very soon, that could be year(s). I will sell most of my capital on targets 2,3. Small portions will be sold on Target 1 and Target 4. Also I will have someting to sell above mentioned targets!
Entry Zone: 0.00000068 – 0.00000097
Target 1: 0.00000225 – 0.00000252 (152%)
Target 2: 0.00000412 – 0.00000428 (358%)
Target 3: 0.00000635 – 0.00000664 (600%)
Target 4: 0.00000864 – 0.00000908 (864%)

BTTC/USDT Secondary trend. Wedge.Logarithm. Time frame 3 days. Locally, a descending wedge is forming, almost in its final phase. Note that the trading volume is minimal, and is decreasing.
🟢If there will be its breakout — the local potential is shown. That is fractal repetition of the movement as before.
🔴Breakthrough down to the lower zone of the channel — to begin with the rebound of the right shoulder of the big head and shoulders, to the meridian of the channel, and there it will be seen...
Linear, for greater clarity, without market noise.
Local. Time frame 1 day.


$BTTC nice chart #bttc #bittorrent #btt chart is very well cooled down, in very short time may be a little more correction is necessary. Not financial advice.


Trade signal | BitTorrent (BTTC) completed a setup for next pumpHi dear friends , hope you are well and welcome to the new trade setup of BitTorrent (BTTC) with US Dollar pair.
Previously we caught 61% pump of BTTC as below:
Now on a 4-hr time frame, BTTC has formed a bullish Gartley move for the next price reversal.
Note: Above idea is for educational purpose only. It is advised to diversify and strictly follow the stop loss, and don't get stuck with trade.


$BTTCFinally We broke out falling channel.
We can now see more bulls return.
#BTTC #BTTCUSDT #Crypto

BitTorrent (BTTC) forming bullish BAT for upto 17% pumpHi dear friends, hope you are well and welcome to the new trade setup of BitTorrent (BTTC) with US Dollar pair.
On a daily time frame, BTTC is about to complete the final leg of a bullish BAT move for bullish price reversal.
Note: Above idea is for educational purpose only. It is advised to diversify and strictly follow the stop loss, and don't get stuck with trade

$BTTC/#USDT [#BitTorrent-New]: BBand_Breakout ◳◱ Hey traders, we've identified a Bollinger Band breakout on the $BTTC / $USDT chart. The price has moved outside of the upper Bollinger Band, which can indicate a potential bullish trend. The next resistance key levels are at 0.00000077 | 0.0000008 | 0.00000088 and the major support zones are respectively at 0.00000069 | 0.00000064 | 0.00000056. We may consider buying at the current price zone 0.00000076 and targetting higher levels.
◰◲ Technical Metrics :
▣ Mrkt Price: 0.00000076 ₮
▣ 24HVol: 2,185,565.760 ₮
▣ 24hChng: 2.703%
◲◰ Pivot Points - Levels :
◥ Resistance: 0.00000077 | 0.0000008 | 0.00000088
◢ Support: 0.00000069 | 0.00000064 | 0.00000056
◱◳ Indicators recommendation :
▣ Oscillators: NEUTRAL
▣ Moving Averages: STRONG_BUY
◰◲ Technical Indicators Summary : BUY
◳◰ Market Sentiment Index :
▣ News sentiment score is N/A
▣ Twitter sentiment score is N/A
▣ Reddit sentiment score is N/A
▣ In-depth BTTCUSDT technical analysis on Tradingview TA page
▣ What do you think of this analysis? Share your insights and let's discuss in the comments below. Your like, follow and support would be greatly appreciated!
◲ Disclaimer
Please note that the information and publications provided are for informational purposes only and should not be construed as financial, investment, trading, or any other type of advice or recommendation. We encourage you to conduct your own research and consult with a qualified professional before making any financial decisions. The use of the information provided is solely at your own risk.
▣ Welcome to the home of charting big: TradingView
Benefit from a ton of financial analysis features, instruments and data. Have a look around, and if you do choose to go with an upgraded plan, you'll get up to $30.
Discover it here - affiliate link -

BTTC/USDT Inverse Head and ShoulderWhat is Inverse Head And Shoulders Pattern?
Formation of the head and shoulders pattern in trendline indicates a reversal in uptrend. Similarly, an inverse head and shoulders pattern appearing in a downtrend is indicative of bearish to bullish reversal. Like head and shoulders pattern, the inverse head and shoulders also appear in all time frames and is easy to spot.
An inverse head and shoulders pattern forms when the price of an asset falls to a trough, then rises, falls for the second time, but this time the fall is steeper than the first. The price rises again and drops for the final time
Key Takeaways
The inverse head and shoulders formation is similar to head and shoulders formation, but only reverse
It shares many characteristics with head and shoulders – of three troughs with the first and second being shallower than the middle one
Inverse head and shoulders pattern appears in the downtrend
The formation signals a bull market and traders enter a long position once the formation is complete
Traders look for a steep price rise once the third rise breaks through the neckline
How To Read An Inverse Head And Shoulders Pattern
Inverse head and shoulders pattern indicates the end of bearish phase and onset of an uptrend. Traders enter a long position when the up breaks through the resistance line. They would look for a rise in volume to confirm the trend change. Inverse head and shoulders pattern appears frequently in the trendline, and since it shares many characteristics with the head and shoulder in an uptrend, it is also interpreted the same way.

$BTTC ABOUT TO EXPLODE!Liquidity has run dry.
you know what that means?
Short traders are turning to long traders.

📈Bittorrent-New (BTTC) Jul-22 #BTTC $BTTCBTT is forming a Symmetrical Triangle pattern so it can reverse the trend to up again. It is also currently supported by the Ichimoku cloud and the buying is very strong, so there is a high chance that it will break this pattern to increase strongly to the $0.0000012-0.0000013 zone.
The possibility of a price drop is quite low but if BTT loses this pattern, BTT will fall sharply to the area of $0.0000006

BTTC | Wave Projection | Ending Diagonal - Bullish DivergencePrice action and chart pattern trading
> Ending diagonal pattern with possible upcoming wave channel triangle breakout
> Possible upcoming Inverted Head & Shoulders
> Indicator: RSI / MACD bullish divergence indicating ending diagonal final wave 5 downtrend
> Entry @ triangle breakout
> Target @ Previous 1-wave + 75% upside
> Stoploss @ 3-wave Head position -25% downside
> RRR: 3:1
Always trade with affordable risk and respect your stoploss

WILL BUYING BTTC DUMP $TO0.00000098 BE WORTH IT BY 2025?Looking at the Daily chart we see a mini short term pause in the form of a sideways price move
Could this be a pause before a continuation of the current dump or a pause before a complete
change in direction?
Bitcoin Is not called the king of all crypto for no reason as we see all altcoins react
to each down move by bitcoin no matter how far the token has moved before the BTC reaction.
I do see that according to the BTC chart below, BTC buyers could for a pull up if they succeeded in
holding up the support above 26800 if the bull force and buy power holds up till 30k then altcoins
including BTTC stand the chance to recover to 0.00000188
My Conclusions:
Buying More Bittorrent Chain Token at the current price of 0.00000098 will see a good over 300% till the end of 2022
but do know that the dump is not over as they will likely return down for more dump before the major pump will begin in late 2024.

BTTC / USDTAs you can see the chart BTTC is trying to break the golden line of FIBO
IF it can make it, it's gonna move up and as I read the fundamental news about it this coin might pump so you can take advantage of it and take profit
I don't know if it's good for holding or not but buying 100 dollars from it it's not big money to lose so you can just buy and keep a little amount of it so we can see what will happen to it in the future lol
This is not financial advice it's just my personal opinion do trading based on your analysis
Do not forget to use stop loss even if you do spot trade
Guys if you find my analysis useful DO NOT FORGET TO LIKE

BTT the dead horse..Almost been a year since this waste of an asset mooned. Dying a slow death.. Taking us who believed in its fundemental's money along with it with each passing dip. Well here is my latest idea... not bullish not bearish... Just... meh... Maybe it will go up.. maybe it wont.. at this stage im numb..
Trade responsible and always have an exit strategy. GL trading!!!

BTTC - DAY 12 - THE INCRASE TREND - BitorrentHello trading friends,
This is a daily update for BTTC depending on last trends.
We see that this coin is still in a stable trend, and there are still 12 days depending on before expecting for a breakout.
Know that this is not a coin that goes fast into the small time frame, its choices as its one of the trend coins that could have the goal to increase 100%. also prefer to use this coin on spot. and the breakout that it can show will be in most time unexpected, as volume trend going in most of time slowly.
Trend
Even with a stable trend, this coin has still a chance to break out - and at the same time, it's still positive. there is until now still not the real expecting, what we normally expect to happen into 12 days or before.
Why is this expected for BTTC?
The expecting did do before with the goal into the next 20 days that BTTC can get an increasing trend, this done depending on TA trends and last data.
Is there any guarantee that BTTC will also get to a 100% increase trend?
There is a high chance that BTTC will get a breakout increase, but there is no guarantee, as it will stay crypto, on this reason also manage your risk well in any coin you enter.
Have a great day!
