NAS100 – Riding the Channel: Will Price Respect the MidlinePrice continues to move cleanly inside the long-term ascending channel, with the midline acting as dynamic support throughout the past week. Each retest of the dashed median line has produced bullish continuation, but momentum is starting to flatten at the upper boundary.
Key Observations:
Price is currently hovering near the upper half of the channel, showing signs of exhaustion.
The dashed median line has been respected repeatedly — a key structure level to watch.
Bullish structure remains intact as long as price stays above the recent internal higher-low zones (highlighted in green).
MACD shows slowing momentum despite higher prices, signalling a possible pullback into channel support before continuation.
Levels to Watch:
Bullish continuation: If price holds above the midline, we could see another leg into the upper boundary of the channel.
Pullback zone: Watch for a corrective move into the lower channel support if buyers fail to sustain momentum.
Invalidation: A clean break below the channel would shift bias to short-term bearish retracement.
This structure is still very clean — waiting for either a respectful retest or a decisive breakout.
📌 Bias
Bullish overall structure, but expecting a short-term pullback before continuation.
Builtnotbegged

NAS100 Analysis – Bullish Channel Break & Retest in Progress📌 Key Highlights:
Bullish Channel Broken: Price failed to respect the upward trend channel. Although the candle bodies held above a support zone, price wicked through to test a lower level – indicating a weakening bullish structure.
Pressure Reversal Zone: Around 23,800, price ran out of momentum. Downward pressure entered the market, shifting the trajectory and breaking the previous bullish pattern.
Confirmed Zones via Retest: Each zone was respected by a clean retest, reinforcing their validity as support/resistance areas. This is textbook price action – confirming zones before continuation.
Current Candle Behaviour: The most recent green candle has no top wick, showing strong buyer conviction. However, the bottom wick is long, meaning bears are still present and applying pressure.
Decision Point: We’re at a critical moment. Will price break above this level to reclaim the channel — or reject and fill the imbalance left behind by the last bullish move?
📉 Scenario 1 – Rejection & Continuation Down
If price fails to break and close above this resistance, we could see a bearish continuation — potentially aiming for the next key support zone around 22,677.
📈 Scenario 2 – Bullish Recovery
If bulls maintain strength and close above this level with volume, we could see price climb back toward 23,500+ to retest the upper zone.
✅ Bearish Bias
Price broke below the bullish channel structure (a major technical shift).
Retests have confirmed lower zones — typical bearish continuation behaviour.
The current green candle has no upper wick (buyers trying to push), but a long lower wick shows bears are still active.
Downward pressure has already shifted momentum, and we’re now waiting to see if the zone holds.
🟡 However – Confirmation Needed
If price fails to break above this current resistance zone, then bearish continuation becomes confirmed.
If price closes strong above this level and reclaims the channel, the bias would shift neutral to bullish again.
📌 Final Bias Statement:
Bearish bias for now — unless price cleanly breaks back above the resistance zone. Current price action suggests a possible continuation down to fill the wick and test deeper support zones.
🧭 Watching for:
Candle body closures above or below key zones
Wick reactions showing liquidity grabs
Momentum shifts in volume
🔔 Stay sharp. Trade with confirmation, not emotion.
By AutoMarkets | Built. Not Begged.

Gold Rejecting Resistance After Liquidity Grab – Bow & Arrow SetThis is a textbook liquidity grab + rejection setup.
Price executed a liquidity grab above structure, shooting into previous highs to build momentum for the drop — classic bow and arrow effect.
After sweeping stops and pulling back, price retested the nearest resistance (around 3,324–3,325), but hasn’t broken the body high — this confirms sellers are still active.
The push down was strong enough to reach the 4H support zone, and although price bounced, it looks like a temporary pullback rather than a reversal.
As long as price stays below 3,347, this short bias holds. The structure still supports downside continuation unless a clear breakout occurs.
Bias:
Bearish — expecting continuation down toward 3,312 and possibly back to test 3,307.

Gold Respecting Key Support — Downtrend Still Active on the 4HPrice on XAUUSD is currently hovering around the 3,324 zone, reacting to a clear support area that’s held firm since the last major dip.
The uptrend is no longer valid — it's been broken multiple times and has now been decisively rejected.
We’re still trading below a short-term descending trendline, which remains active.
A prior liquidity sweep below support (around 3,247.54) may have been a fakeout to trap late sellers.
If price fails to break the short-term trendline, this bounce could be short-lived.
However, a clean breakout above the trendline could open up retracements toward the 3,360–3,384 area.
Stay alert for a retest of support at 3,310–3,324, and watch how price behaves near the trendline before considering entries.
Bias:
Neutral to Slightly Bearish — Until trendline break is confirmed, downside continuation is still on the table.

Gold Technical Outlook – Midpoint Support Holds, Retest of 3,500On the Daily Chart, gold has been climbing steadily since New Year’s Day, with several pullbacks along the way but maintaining its overall bullish trajectory.
After breaking into the 3,167.72 – 3,430.46 range, price has shown comfort within this zone. The midpoint at 3,286.94 (Green Line) has acted as a supportive bias, with price holding above it — reinforcing the view that bulls remain in control.
That said, this period of consolidation has lasted longer than expected, breaking the previous rising trajectory (shown by the diagonal Red Line). This suggests that momentum has weakened.
Importantly, this doesn’t confirm that the bullish run is over — but it does highlight the market’s current struggle to push higher with strength. A high of 3,500.02 was briefly tested but quickly rejected, which leads me to believe the market still has reason to retest that level in the near future.

XAUUSD – Double Tap or Deeper Correction?Idea Breakdown:
Gold just gave us a textbook double-tap at the key 1,910–1,912 demand zone. This level aligns with the 61.8% retracement from the most recent bullish impulse. The long wicks on the daily suggest strong rejection by buyers.
As long as price holds above 1,910, this looks like a potential launch pad for another leg up. Next resistance sits around 1,943, and above that, we’re eyeing 1,966 and 1,984.
Plan:
• Look for bullish price action on the lower timeframes (1H–4H) confirming the double tap
• Conservative entry: on a retest of 1,912
• Aggressive entry: break and hold above 1,943
• Invalidation: Clean daily close below 1,898
Structure:
• Daily double tap at the 1,910–1,912 level
• Strong bullish wick rejection
• Reaction from 61.8% Fibonacci retracement
• In line with overall bullish market structure
Key Zones:
• Support: 1,910–1,912 (wick rejections + Fib confluence)
• Resistance: 1,943
• Breakout target: 1,966 and 1,984
• Invalid if we break below: 1,898

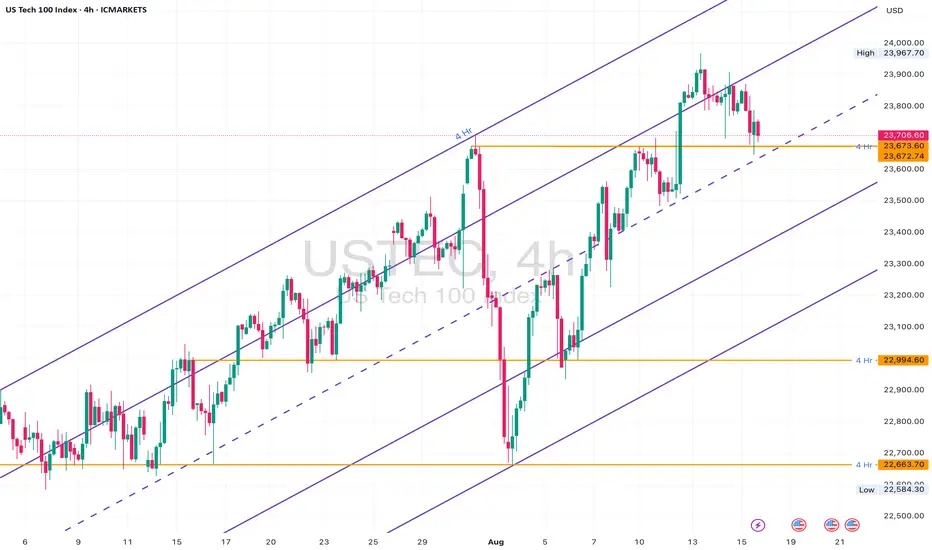
NAS100 4H Channel: Bounce or Breakdown?NASDAQ100 has been trending within a clean ascending channel on the 4H timeframe. We’re now sitting at a crucial decision point — the midline and horizontal support around 23,670.
This zone has historically acted as a strong S/R pivot. If price holds, we could see another bullish bounce toward 24,000+. But if it breaks and closes below, we may get a clean drop toward the bottom of the channel — with 23,200 and 22,663 as targets.
Plan:
• Wait for a 4H close above or below the 23,670 level
• Bullish scenario: Bounce toward upper channel (~24,300)
• Bearish scenario: Drop to lower channel boundary with incremental TP levels
Structure:
• 4H rising channel structure still intact
• Price testing midline zone
• Horizontal level at ~23,670 adds confluence
• No confirmed break of channel yet
Key Zones:
• Support: 23,670 (midline + structure support)
• Bullish flip zone: 23,967
• Bearish continuation zones:
‣ 23,200
‣ 22,994
‣ 22,663
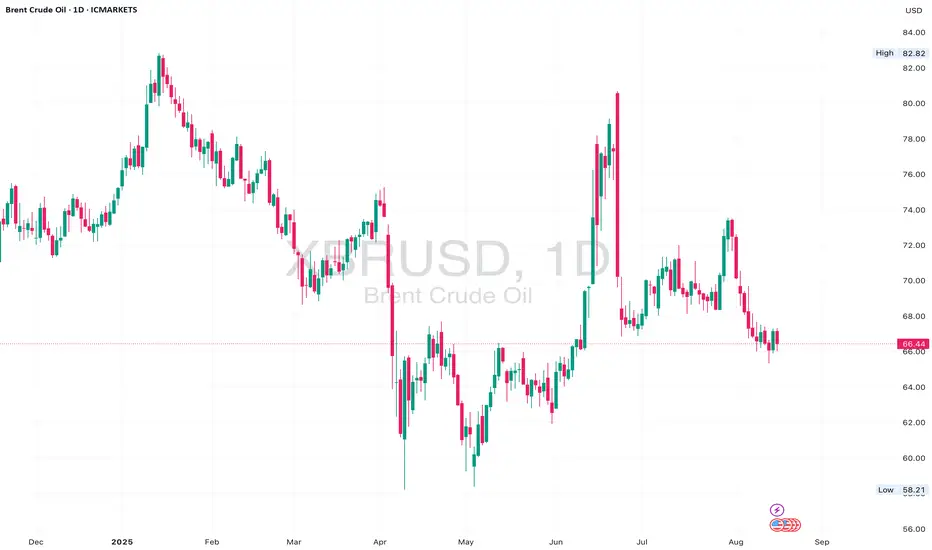
Brent Crude Squeeze – Daily Symmetrical Triangle Nears BreakoutBrent Crude has been consolidating within a symmetrical triangle on the daily chart since mid-May, following a strong bullish recovery from $58 lows. Price is now approaching the apex of the structure, suggesting a breakout is imminent.
We’re still holding above the higher low trendline support, but resistance at $71.00 remains unbroken. A decisive daily candle close outside this triangle will likely set the tone for the next leg.
A bullish breakout above $71.15 could expose $75.00 and eventually $82.00 highs. But if bears take control and break below $67.00 support, $64.00 and $58.00 reopen.
📈 Bias:
Neutral short term — Waiting for breakout confirmation.
Bullish if price breaks and retests above $71.15.
Bearish if we lose $67.00 and structure fails.
XAUUSD – Mid-Channel Rejection Near Key Supply ZoneGold has made an impressive recovery off the $3,250 zone, pushing back into the $3,380–$3,390 region — a key supply area which previously led to strong sell-offs.
We’re now sitting at the upper boundary of a 1H ascending channel and just under a significant resistance area seen on the 4H and daily timeframes.
Although bullish momentum is still present, price is showing early signs of exhaustion at this level — with small rejections forming and volume beginning to taper off.
The key zone to watch is $3,384 – $3,390. If price fails to break and close above this zone cleanly on the 4H, we may see a corrective pullback back toward the midline of the channel — or even a full retest of the lower boundary near $3,305 or $3,268 depending on momentum.
Bias: Short-term bearish / corrective – waiting for confirmation of rejection or bearish candle formation below $3,384.

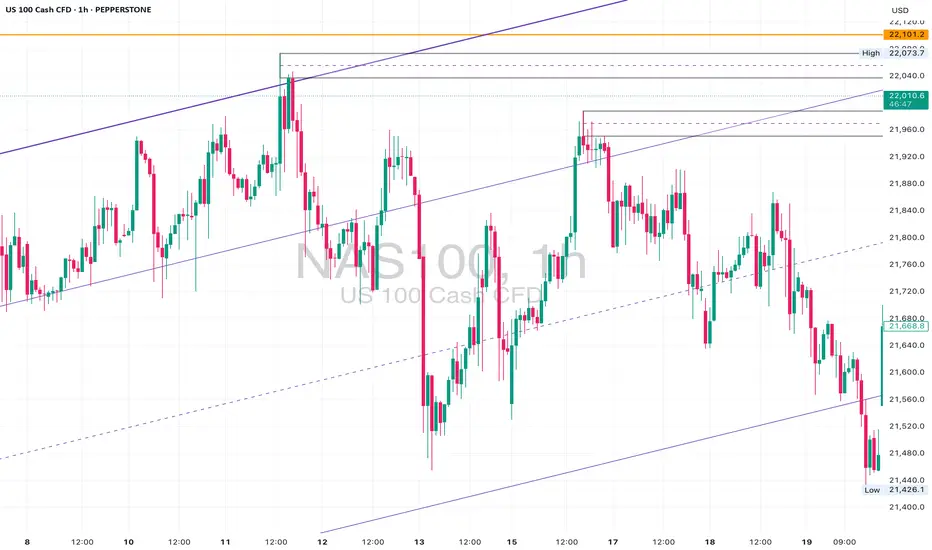
NAS100 Analysis – Structure Breakout or Trap?📍 Levels Marked: 22,101 Resistance | 21,880 Mid-Level | 21,375 Channel Support
⸻
📊 Technical Breakdown:
The NAS100 has surged into the 22,000+ range, breaking above the mid-level channel boundary after consolidating beneath it for days. This breakout takes us right back into an untested supply zone from March.
On the lower timeframes (1H & 23min), price cleanly cleared multiple lower highs with aggressive bullish momentum, printing a new intraday high at 22,015. However, structure is still trapped inside a long-term ascending channel on the 4H and D1 — and this move could be setting up a liquidity grab before reversal.
Key zone to watch:
• 22,101 – 22,200 (daily resistance + equal highs)
• 21,880 – 21,920 (possible retest zone)
• 21,375 (channel base support)
⸻
📉 Trade Ideas:
• Short Bias if price rejects the 22,100–22,200 area with bearish confirmation on lower timeframes. Target: 21,800 – 21,600.
• Long Bias only if price gives a bullish retest of the 21,880–21,920 zone with clean structure. Target: 22,222+ with tight risk.
⸻
💡 Final Thoughts:
A textbook case of a channel edge breakout — but breakout or fakeout? Always wait for confirmation and let structure guide the setup. We’re either about to print new highs or see a sharp correction.
📌 Mark your levels. Watch the retest. Execute with confidence.
Brent Oil Breakdown – Rejection & Freefall From Channel HighsBrent Oil delivered a textbook reversal last week.
After weeks of climbing within a rising channel, price printed a strong rejection wick at the upper boundary (~$79.45), then followed through with a violent sell-off, slicing through structure and breaking the channel cleanly.
🔍 Key Levels:
• Rejection High: $79.45
• Structure Break: $74.89 (former support, now resistance)
• 4H Demand Zone: $66.00–$69.00
• Daily Demand Confluence: Aligned with 4H zone
On the 1H and 23min, we’re now seeing price trying to stabilise above $69.80 — right on top of the 4H and daily zone confluence.
📉 Bias:
Currently bearish below $74.89.
A clean retest of that level could offer continuation entries.
However, price is now in a high-probability reaction zone, so intraday longs are possible if price shows strength above $70.
⛽ Watch For:
• Bullish price action around $68.50–$70.00
• Weak retracements into $72–$73 for potential short entries
• Break below $66.00 could open floodgates back toward $63 and $60.00

Brent Crude Hits Key Supply Zone After BreakoutPrice has aggressively broken out from the descending wedge and reached a strong 4H & 1D resistance zone between 74.50–76.00.
• 1D Chart: Sharp breakout from long-term descending trendline. Approaching resistance from Feb-April supply area.
• 4H Chart: Bullish structure confirmed by higher lows and breakout of ascending channel.
• 1H & 23m Chart: Consolidating beneath resistance, forming a triangle structure.
Key Zones:
• Support: 71.50–72.00
• Resistance: 74.50–76.00
Bias: Neutral short-term (range). Bullish if 76 is broken and held.

Gold Testing Daily Resistance – Will the Breakout Hold?Gold is currently testing a major 1D resistance zone at 3432–3450 after a strong bullish move.
• 1D Chart: Price has rallied back into the resistance zone after bouncing from ascending trendline support.
• 4H Chart: Strong momentum candle broke through the prior 4H resistance zone at ~3360, confirming bullish pressure.
• 1H & 23m Chart: Price is holding within a bullish channel, but showing signs of consolidation under key resistance.
Key Zones:
• Support: 3380 / 3360
• Resistance: 3432–3450
Bias: Bullish above 3360. Needs daily close above 3450 for continuation.

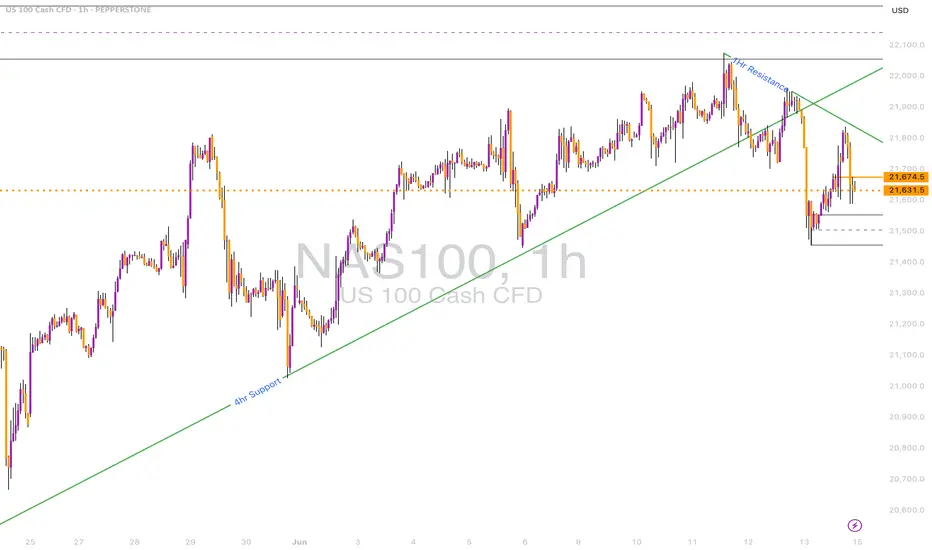
NASDAQ Pullback or Reversal? Watching 4H Support ZonePrice is reacting from the 1D resistance zone around 21,950 and now hovering near a 4H support zone at ~21,520.
• 1D Chart: Long wick rejection from resistance.
• 4H Chart: Break of rising wedge and rejection from 1H trendline.
• 1H & 23m Chart: Clear bearish order block formed. Price consolidating under broken structure.
Key Zones:
• Support: 21,500 / 21,325
• Resistance: 21,900 / 22,000
Bias: Bearish below 21,750. Retest of support expected.