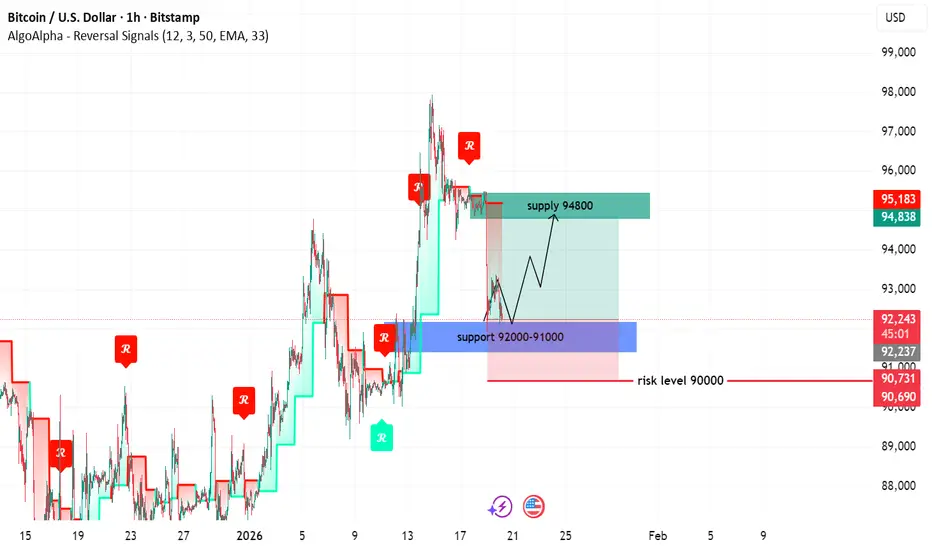
BTCUSD NEXT MOVE (READ CAPTION)Hi trader's what do you think about btcusd
BTCUSD is currently maintaining a bullish market structure, with price holding above a key support zone and buyers remaining active on pullbacks. The overall price action suggests a potential continuation toward higher levels, while risk is clearly defined below.
🔹 Support Zone: 92,000–91,000
This zone represents the primary bullish demand area, where buyers have repeatedly stepped in.
As long as BTC holds above 91,000, the bullish bias remains valid.
🔹 Risk Level: 90,000
This level acts as the invalidation and risk management level.
A sustained break below 90,000 would weaken the bullish setup and signal caution or trend change.
🔹 Supply Zone: 94,800
This is the near-term upside target and supply area.
If bullish momentum continues, price is likely to move toward 94,800, where sellers may attempt to slow the advance or cause short-term rejection.
📈 Market Outlook
Holding above 92,000–91,000 → Bullish continuation expected
Break below 90,000 → Bullish setup invalidated
Upside target → 94,800 supply zone
Overall, the structure supports a bullish pullback followed by continuation, with clearly defined risk control.
please don't forget to live come follow
Bullishanalysis
XAUUSD BUYER WANT (READ CAPTION)Hi trader's what do you think about gold
Gold (XAUUSD) is maintaining a bullish market structure, with price holding above key support zones and buyers showing strength on pullbacks. The current price action suggests a higher probability of upside continuation toward the next resistance and supply areas.
🔹 Support Zone: 4600
This level acts as the primary bullish support, where buyers are actively defending price.
Holding above 4600 keeps the bullish bias intact.
🔹 Support Zone: 4580–4567
This is a strong demand and accumulation zone.
Any deeper retracement into 4580–4567 is considered a high-probability buying area, where strong bullish reactions are expected.
🔹 Resistance: 4673
This is the key near-term resistance.
A confirmed breakout and close above 4673 will strengthen bullish momentum and confirm continuation.
🔹 Supply Zone: 4710
This zone represents the main upside target and supply area.
If Gold breaks above 4673, price is likely to move toward 4710, where sellers may attempt to slow or reject the move.
A strong breakout above this zone could signal further bullish expansion.
📈 Market Outlook
Holding above 4600 / 4580–4567 → Bullish continuation expected
Break above 4673 → Opens path toward 4710 supply zone
Supply zone reaction will define the next major move
Overall, the structure supports a bullish pullback followed by continuation setup.
please dont' forget to like comment and follow

BTCUSD READY FOR FLY (READ CAPTION)Hi trader's what do you think about btcusd
BTCUSD is currently maintaining a bullish market structure, with price holding firmly above a strong support zone and showing consistent buyer interest on pullbacks. The overall price action supports further upside continuation toward higher levels.
🔹 Support Zone: 89,000–88,000
This zone represents the primary bullish demand area where buyers have repeatedly stepped in.
As long as BTC holds above 88,000, the bullish bias remains intact.
🔹 Resistance Zone: 95,000
This is the key resistance area where price may face temporary rejection or consolidation.
A strong breakout and close above 95,000 will confirm bullish continuation.
🔹 Supply Zone: 99,000
This is the major upside target and supply area.
If BTC breaks above 95,000, price is likely to extend toward the 99,000 supply zone, where sellers may attempt to slow the move.
A decisive breakout above this zone could signal further upside expansion.
📈 Market Outlook
Holding above 89,000–88,000 → Bullish continuation expected
Break above 95,000 → Opens path toward 99,000 supply zone
Supply zone reaction will determine the next major directional move
Overall, the structure favors a bullish pullback followed by continuation scenario.
please don't forget to like comment and follow

KAVA ANALYSIS📊 #KAVA Analysis
✅There is a formation of Descending triangle pattern on daily chart 🧐
Pattern signals potential bullish movement incoming after a breakout.
👀Current Price: $0.4280
🚀 Target Price: $0.5380
⚡️What to do ?
👀Keep an eye on #KAVA price action and volume. We can trade according to the chart and make some profits⚡️⚡️
#KAVA #Cryptocurrency #TechnicalAnalysis #DYOR

🛢️📈 Marathon Oil (MRO) Analysis 📈🛢️📊 Current Position:
Strategic Growth: NYSE:MRO is strategically positioning itself for growth in the energy sector.
LNG Sales Agreement: Initiatives like the LNG sales agreement with Glencore Energy UK enhance market positioning, particularly in European oil demand.
Safety and Environmental Excellence: MRO's commitment to safety and environmental excellence, along with its ESG leadership, attracts investments and enhances reputation.
Value Delivery: A CFO-driven framework aiming to return at least 40% of adjusted cash from operations to shareholders demonstrates value delivery.
Balance Sheet Strengthening: Efforts to reduce debt and achieve positive free cash flow strengthen the balance sheet and bolster resilience.
💡 Outlook:
Bullish Stance: A bullish stance on MRO is warranted, particularly above the $25.00-$26.00 range.
Upside Target: The upside target is set at $36.00-$38.00 as MRO executes strategic initiatives and capitalizes on energy sector dynamics.
🚀 Investment Strategy:
Entry: Consider entry above $25.00-$26.00, aligning with the bullish stance.
Targets: Aim for profits at the identified upside target levels.
Risk Management: Monitor industry trends, regulatory changes, and financial performance to manage risks effectively.
🌟 Note: Stay informed about energy market dynamics and company developments to make informed investment decisions! #MarathonOil #EnergySector #BullishAnalysis 🛢️📈

🏦💼 Wells Fargo (WFC) Analysis 💼🏦📈 Current Status:
Challenges Addressed: NYSE:WFC is tackling challenges through strategic measures and regulatory compliance.
Diversified Segments: Despite a rising net charge-off ratio, diversified business segments are expected to mitigate adverse impacts.
Financial Health: WFC's Tier 1 capital ratio exceeds regulatory requirements, showcasing its financial stability.
Regulatory Compliance: Proactive regulatory compliance, including adherence to Basel III standards, enhances stability and investor confidence.
Dividend Raise: A recent dividend raise post-successful stress tests by the Federal Reserve underscores WFC's commitment to shareholders.
💡 Outlook:
Bullish Sentiment: A bullish outlook is warranted for WFC, particularly above the $49.00-$50.00 range.
Upside Target: The upside target is set at $75.00-$77.00, reflecting potential appreciation as WFC strengthens its position in the financial sector.
📊 Investment Strategy:
Entry: Consider entry above $49.00-$50.00, aligning with the bullish sentiment.
Targets: Aim for profits at the identified upside target levels.
Risk Management: Monitor regulatory developments and financial indicators closely to manage risks effectively.
🚀 Note: Stay informed about regulatory changes and market dynamics to optimize investment decisions! #WellsFargo #FinancialSector #BullishAnalysis 🌟📈
