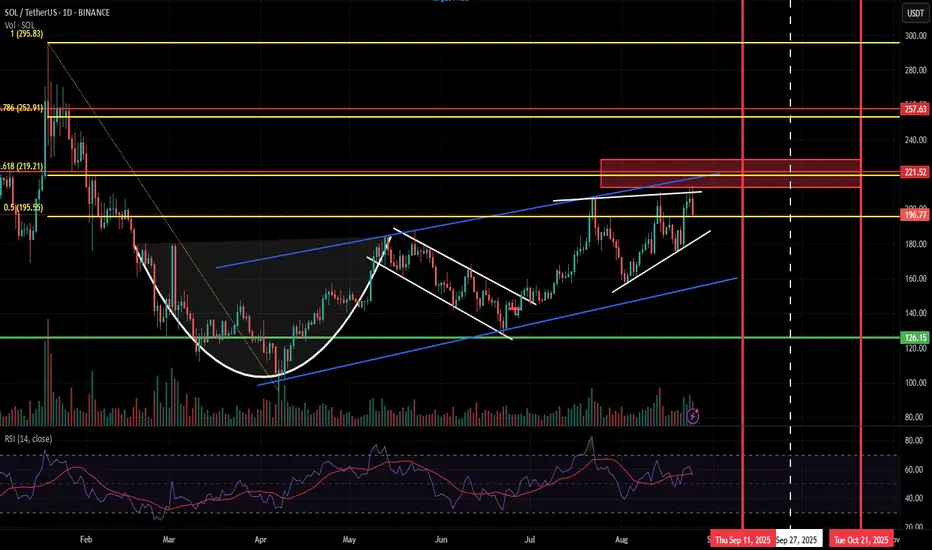
SOL big picture: All Time High again in this cycle?
Solana has being showing strength in its price action recently compared to top 10 altcoins (in MarketCap) within the past few days, yet failing to break the strong resistance within 200 and 220. Bears have consistently defended this region while maintaining the price below the 0.618 Fibonacci level of the mid January - April price drawback.
Since then, the price has maintained an uptrend where the cup-and-handle pattern strongly playing out. But the the uptrend was restricted within a parallel channel (blue) and yet to be broken, which is a breakout to be played for SOL to break the 210 barrier. Price has been moving within a bearish wedge (white) during the months July and August, and still failed to confirm a positive breakout even after the price surge due to Jerome Powell's hint on rate cuts at annual economic policy symposium in Jackson Hole, Wyoming.
The current Bull Cycle is shortly coming to an end. Based on historical behavior, BTC reaches its ATH within 510 to 550 days from its recent halving which falls between mid-September to October end. BTC is supposed to go for an ATH within this region and September rate cuts can be a good fuel to reach this target. Mostly we will be having a short altcoin season for this cycle with a probability of an extension until year end (November or early December).
Statutory 240-day deadline for VanEck and Franklin SOL ETF applications will conclude by October 2025. As reported by Coinpaper, the final deadline has been set to October 16, 2025 for five Solana ETF applications. (source: coinpaper). These positive news can align with the last phase of the Crypto Cycleand trigger new ATH for SOL. Price will take a downturn if Bulls progressively struggle to break the parallel channel resistance by this time, marking the end of the current cycle.
So, a high probability exist for SOL to reach new ATHs with caution on the overall market sentiment within the coming 2 to 4 months. As the time of writing, SOL is at 198.14 , plunged from a local high of 213.6.
Bullishsentiment
SOL ANALYSIS🔮 #SOL Analysis 🚀🚀 Update
💲💲 As we said #SOL performed the same. #SOL is trading in a Ascending Broadening Wedge Pattern and there was a breakdown of the pattern. Now we can expect a breakout of the resistance and a bullish move
💸Current Price -- $151
⁉️ What to do?
- We have marked crucial levels in the chart . We can trade according to the chart and make some profits. 🚀💸
#SOL #Cryptocurrency #DYOR

ZEC ANALYSIS🔮 #ZEC Analysis
🌟🚀 #ZEC is trading in an Ascending Triangle Pattern and here we can see that #ZEC testing the ascending trendline. Also there is an instant major support zone. We can see a pullback from its major support zone.
🔖 Current Price: $32
⏳ Target Price: $40
⁉️ What to do?
- We have marked crucial levels in the chart . We can trade according to the chart and make some profits. 🚀
#ZEC #Cryptocurrency #Breakout #DYOR

ETH ANALYSIS🔮 #ETH Analysis :: Support & Resistance Trading
💲💲 #ETH is trading between support and resistance area. If #ETH sustains above major support area then we will a bullish move and if not then we will see more bearish move in #ETH then could expect a pullback.
💸Current Price -- $1564
⁉️ What to do?
- We have marked crucial levels in the chart . We can trade according to the chart and make some profits. 🚀💸
#ETH #Cryptocurrency #DYOR

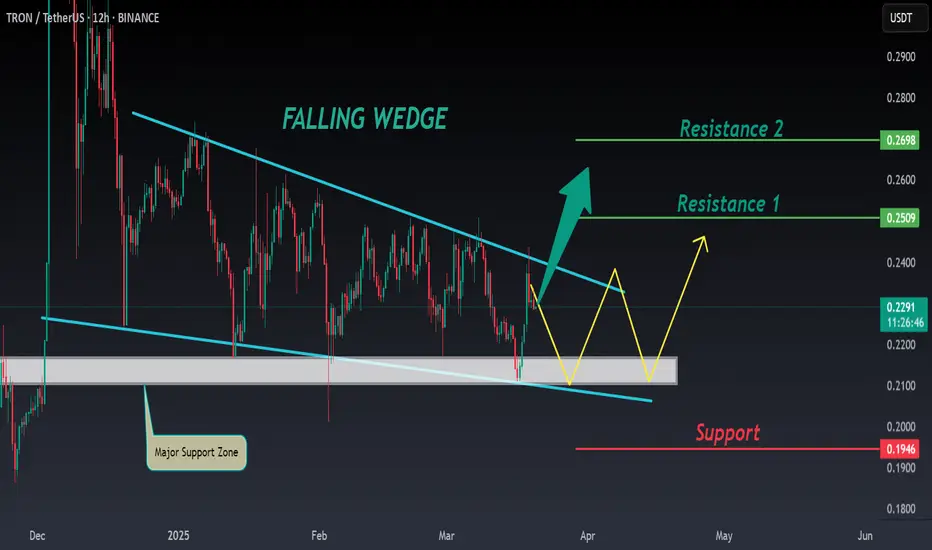
TRX ANALYSIS📊 #TRX Analysis
✅There is a formation of Falling Wedge Pattern on 12 hr chart and currently trading around its major support zone🧐
Pattern signals potential bullish movement incoming after a breakout
👀Current Price: $0.2290
🚀 Target Price: $0.2500
⚡️What to do ?
👀Keep an eye on #TRX price action and volume. We can trade according to the chart and make some profits⚡️⚡️
#TRX #Cryptocurrency #TechnicalAnalysis #DYOR
ONDO ANALYSIS 🔮 #ONDO Analysis 💰💰
🌟🚀In 1hr chart we can see a formation "Rising Wedge Pattern in #ONDO. There is a strong resistance zone near at $0.8840 and we could see a rejection from that level but if the price breaks the resistance zone then we would see a bullish move 💲💲
🔖 Current Price: $0.8640
⏳ Target Price: $0.9350
⁉️ What to do?
- We have marked some crucial levels in the chart. We can trade according to the chart and make some profits in #ONDO. 🚀💸
#ONDO #Cryptocurrency #DYOR #PotentialBreakout

AUCTION ANALYSIS📊 #AUCTION Analysis
✅There is a formation of Falling Wedge Pattern on daily chart with a good breakout and currently retesting the major resistance zone🧐
Pattern signals potential bullish movement incoming after a breakout of major resistance zone
👀Current Price: $18.85
🚀 Target Price: $29.90
⚡️What to do ?
👀Keep an eye on #AUCTION price action and volume. We can trade according to the chart and make some profits⚡️⚡️
#AUCTION #Cryptocurrency #TechnicalAnalysis #DYOR

OM ANALYSIS🔴 #OM Analysis :
🔮There is a formation of "Bullish Pennant Pattern" in #OM in 4hr time frame. #OM is trading around its all time high level. We may see a little retest before a bullish move
⚡️What to do ?
👀Keep an eye on #OM price action. We can trade according to the chart and make some profits. ⚡️⚡️
#OM #Cryptocurrency #Breakout #DYOR

OGN ANALYSIS🔮 #OGN Analysis 💰💰
🌟🚀 As we can see that #OGN is trading in a symmetrical triangle and given a perfect breakout with a huge volume. But there is an instant resistance. If #OGN breaks the resistance 1 then we will see a good bullish move in few days . 🚀🚀
🔖 Current Price: $0.0940
⏳ Target Price: $0.1260
#OGN #Cryptocurrency #DYOR

RUNE ANALYSIS🔮 #RUNE Analysis
🌟🚀 As we sail earlier, #RUNE performed the same. Currently #RUNE is trading above its major support zone and we could see a retest before our next target
🔖 Current Price: $5.575
⏳ Target Price: $7.232
🏷Remember, the crypto market is dynamic in nature and changes rapidly, so always use stop loss and take proper knowledge before investments.
#RUNE #Cryptocurrency #DYOR

PHB ANALYSIS🚀#PHB Analysis :
🔮As we can see in the chart of #PHB that there is a formation of "Falling Wedge Pattern". Also there is a breakout and retest of the pattern and currently retesting the major support zone. Expecting a bullish move in few days.📈
🔰Current Price: $2.100
🎯 Target Price: $2.800
⚡️What to do ?
👀Keep an eye on #PHB price action. We can trade according to the chart and make some profits⚡️⚡️
#PHB #Cryptocurrency #TechnicalAnalysis #DYOR

BTC ANALYSIS (Update)🔮 #BTC Analysis - Update 🚀🚀
💲 As we said earlier #BTC performed the same. More than 8.65% done move done in #BTC. Now we can see that there is a formation of Descending Broadening Wedge Pattern in #BTC and we can see a more retest before a pullback.
💸Current Price -- $60760
📈Target Price -- $66000
⁉️ What to do?
- We have marked crucial levels in the chart . We can trade according to the chart and make some profits. 🚀💸
#BTC #Cryptocurrency #Breakout #DYOR

PEPE ANALYSIS (update)🔮 #PEPE Analysis - Update 🚀🚀
💲 As we said earlier #PEPE performed the same. More than 48% move already done in #PEPE. Now we can see a little retest towards it's major support zone and after that a bullish move would be seen
💸Current Price -- $0.00001109
📈Target Price -- $0.00001670
⁉️ What to do?
- We have marked crucial levels in the chart . We can trade according to the chart and make some profits. 🚀💸
#PEPE #Cryptocurrency #Breakout #DYOR

ROSE ANALYSIS🚀#ROSE Analysis : What Next ??💲
✅As we can see that there was a formation of "FALLING WEDGE PATTERN" in #ROSE. We are expecting a bullish move in #ROSE after a breakout of falling wedge pattern
🔰Current Price: $0.06235
🎯 Target Price: $0.09755
⚡️What to do ?
👀Keep an eye on #ROSE price action. We can trade according to the chart and make some profits. Stay tuned for further analysis and stay updated with market sentiments and news.⚡️⚡️
#ROSE #Cryptocurrency #TechnicalAnalysis #DYOR

SOL ANALYSIS🔮 #SOL Analysis 🚀🚀
As we can see that #SOL is trading in a Descending Channel Pattern in daily time frame. After a small retest towards it's support zone we would see a reversal in #SOL 💸 💯🚀
💸Current Price -- $140.99
📈Target Price -- $200.00
⁉️ What to do?
- We have marked crucial levels in the chart . We can trade according to the chart and make some profits. 🚀💸
#SOL #Cryptocurrency #DYOR

NOT ANALYSIS🔴 #NOT Analysis : ❓❓
🔮There is a formation of "Bullish Pennant Pattern" in #NOT in 8hr time frame. We can expect around $0.02100 bullish move if the price brake the pattern.📈
⚡️What to do ?
👀Keep an eye on #NOT price action. We can trade according to the chart and make some profits. ⚡️⚡️
#NOT #Cryptocurrency #Breakout #DYOR

DOGE ANALYSIS🔮 #DOGE Analysis - Breakout 🚀🚀
💲💲 In 12hr Timeframe,Falling Wedge Breakout is Done✅
But right now we can see that #DOGE is trading around its crucial resistance zone and if #DOGE breaks this resistance zone then we would see a bullish move 💯🚀
💸Current Price -- $0.11880
📈Target Price -- $0.22075
⁉️ What to do?
- We have marked crucial levels in the chart . We can trade according to the chart and make some profits. 🚀💸
#DOGE #Cryptocurrency #Breakout #DYOR

FIL ANALYSIS🔮 #FIL Analysis 💰💰
🌟🚀 As we can see that #FIL is trading in a symmetrical triangle and given a perfect breakout and already retest the levels. But there is an instant resistance of descending trendine. If #FIL breaks the descending trendline then we will see a good bullish move in few days . 🚀🚀
🔖 Current Price: $6.154
⏳ Target Price: $10.00
#FIL #Cryptocurrency #DYOR

BTC ANALYSIS🔮 #BTC Analysis 🚀🚀
💲💲 #BTC was trading in a Descending Broadening Wedge Pattern, and trying to breakout the pattern. If the price of #BTC breakout and closes above the pattern then we will see a bullish move. 📈📈
💸Current Price -- $71080
📈Target Price -- $74000 ++
⁉️ What to do?
- We have marked crucial levels in the chart . We can trade according to the chart and make some profits. 🚀💸
#BTC #Cryptocurrency #Breakout #DYOR

🥤 Coca-Cola (KO): Strong Performance and Positive Momentum! 📈📊 Analysis:
Coca-Cola NYSE:KO
Strong Performance: Reported a 12% increase in organic sales in 2023.
Guidance: Management's guidance indicates continued positive momentum into 2024.
Restructuring Success: Restructuring efforts led to rising revenue and net income.
Diversification: Expansion into energy drinks and sparkling water diversifies product portfolio for future growth.
📈 Bullish Sentiment:
Entry Range: Suggested entry above the $53.00-$54.00 range.
Upside Target: Target set at $75.00-$77.00, reflecting confidence in KO's ability to navigate challenges and capitalize on opportunities.
🌐 Note: Monitor KO's performance and execution of diversification strategy for sustained growth! 📊💹 #KO #BullishSentiment #PositiveMomentum 🥤📈

💊 Blueprint Medicines: Positive Momentum and Growth Prospects! 📊 Analysis NASDAQ:BPMC :
Financial Performance: 90% YoY growth in net-product revenues from U.S. sales of Ayvakit, a drug for certain cancers.
Market Prospects: Positive market response to Ayvakit's unique clinical profile.
CEO's Confidence: CEO's confidence in the company's future contributes to its momentum.
📈 Bullish Sentiment:
Entry Range: Suggested entry above the $83.00-$84.00 range.
Upside Target: Aiming for an upside in the $120.00-$125.00 range.
🌐 Note: Monitor BPMC's ongoing developments and market performance! 📊💹 #BPMC #Biotech #BullishSentiment 💊📈

⚕️ Tenet Healthcare (THC): Positive Outlook in 2024! 🏥📈📊 Analysis:
Positive Outlook: NYSE:THC anticipates continued organic volume growth, strong patient acuity, and effective cost management in 2024.
Strategic Move: Alleviated long-term debt by selling three hospitals in South Carolina for $2.4 billion in cash.
Financial Performance: Strong finish to the year with an attractive adjusted EBITDA margin.
📈 Bullish Sentiment:
Entry Range: Suggested entry above the $77.00-$78.00 range.
Upside Target: Aiming for an upside in the $145.00-$147.00 range.
🌐 Note: Monitor THC's performance in line with its outlined strategies and financial results! 📊💹 #THC #HealthcareOutlook #BullishSentiment 🏥📈

CADCHF: Bullish Reversal Potential - Long Trade Setup📉 Overview:
CADCHF is shifting from a downtrend to sideways movement, signaling a potential bullish reversal. A sharp bullish divergence and a strong 97% bullish market sentiment enhance the likelihood of an upward move.
📊 Technical Analysis:
Transition from downtrend to sideways, coupled with a bullish divergence, sets the stage for a potential bullish reversal.
📈 Market Sentiment:
A robust 97% bullish sentiment supports the potential strength of the upward reversal.
📉 Trade Strategy:
Traders may consider a long trade if the key level at 0.63910 is breached. Entry points near the coming higher lows (HL) or Fibonacci retracement levels like 0.236 or 0.382 are potential considerations.
🛑 Risk Management:
Implementing effective risk management, including appropriate stop-loss orders, is crucial to safeguard capital.
📈 Conclusion:
CADCHF presents a compelling long trade opportunity with bullish signals and strong market sentiment. Monitor the break above 0.63910 and adjust positions based on evolving market conditions.
