BTC - Demand Did Its Job. Now Watching the ChannelBTC reacted exactly where it was supposed to... the blue demand zone held, and buyers stepped in!
Since that reaction, price has started to shift short-term momentum to the upside, forming a rising channel. Nothing aggressive yet, but structure is slowly improving.
From here, my focus is simple:
as long as BTC keeps trading within this blue channel, I’ll be patiently looking for pullbacks toward the lower bound, and from there, trend-following long setups.
The natural upside magnet remains the orange structure zone, which is still acting as the key decision area.
⚠️ Disclaimer: This is not financial advice. Always do your own research and manage risk properly.
📚 Stick to your trading plan regarding entries, risk, and management.
Good luck! 🍀
All Strategies Are Good; If Managed Properly!
~Richard Nasr
Bullrun

TradeCityPro | Bitcoin Daily Analysis #258👋 Welcome to TradeCityPro!
Let’s move on to the Bitcoin analysis, today the market is going through a correction.
⏳ 4-hour timeframe
On the 4-hour timeframe, after Bitcoin reached the 94478 resistance, it entered a corrective phase and its bullish momentum decreased significantly.
✔️ In the first corrective leg, price retraced to the 0.382 Fibonacci level, and since then it has retraced down to the 0.618 level.
💥 The 0.618 Fibonacci area overlaps with 90373, forming a strong PRZ. If Bitcoin’s next bullish wave is going to start, price can build a bottom here and begin its upward move.
✨ If the correction extends further, the next support is 89040. If this level is also lost, price can move down toward the main low at 86855, in which case the entire bullish move we had so far becomes a fakeout.
🔔 If price finds support right here at 90373, we can open a long position after the structural break that Bitcoin creates. The main confirmation for the start of the next bullish wave will be the break of 94478.
🎲 For a short position, I will wait until price stabilizes below 90373, and then I will look for a trigger.
❌ Disclaimer ❌
Trading futures is highly risky and dangerous. If you're not an expert, these triggers may not be suitable for you. You should first learn risk and capital management. You can also use the educational content from this channel.
Finally, these triggers reflect my personal opinions on price action, and the market may move completely against this analysis. So, do your own research before opening any position.

TradeCityPro | Bitcoin Daily Analysis #257👋 Welcome to TradeCityPro!
Let’s move on to Bitcoin analysis. The strong bullish trend of Bitcoin is still continuing.
⏳ 1-hour timeframe
Bitcoin is still continuing its bullish trend, and yesterday, after breaking 93,149, it continued its move up to 94,478.
🔔 At the moment, after a pullback to the 93,149 area, Bitcoin is once again moving toward 94,478.
📊 Buy volume has not increased significantly yet, and in my opinion, if the price is going to break 94,478, buy volume also needs to increase.
🧮 For now, we can consider the break of 94,478 as a trigger for opening a long position. In my opinion, as long as the price stays above 93,149, this trigger is a very good one for long positions.
⛏ However, if the price consolidates below 93,149, we will get confirmation of the end of the bullish wave, and in that case, Bitcoin can correct down to lower areas such as 91,585 and 91,118.
💥 For a trend change, after the price consolidates below 93,149, we can get confirmation of a bearish trend in Bitcoin by forming lower highs and lower lows based on Dow Theory.
❌ Disclaimer ❌
Trading futures is highly risky and dangerous. If you're not an expert, these triggers may not be suitable for you. You should first learn risk and capital management. You can also use the educational content from this channel.
Finally, these triggers reflect my personal opinions on price action, and the market may move completely against this analysis. So, do your own research before opening any position.

BTC Update — 92K Zone as Bull Run Trigger (100K+ Scenario)Bitcoin is approaching a critical decision zone around 92K, which is acting as a major pivot for the next macro move. Price action shows consolidation and higher acceptance just below resistance, suggesting strength is building rather than distribution.
Why 92K Matters
📍 Key reclaim zone: 92K has historically acted as a strong resistance/support flip.
📈 Structure shift: Sustained trading above this level would confirm a higher high on the intraday structure.
🔊 Volume context: Current compression indicates that once volume expands, the move could be fast and directional.
Bullish Scenario
A confirmed breakout and hold above 92K can be the start of a broader bull phase.
From this zone, BTC has a high probability to accelerate toward 100K+, with momentum-driven extensions possible once psychological resistance is cleared.
Pullbacks above 92K would likely be seen as retests, not reversals.
Invalidation / Risk
Failure to hold 92K after a breakout would delay the move and keep BTC range-bound.
As long as price holds above the current base, downside risk remains controlled.
Summary
This 92K zone is the ignition level.
If BTC accepts above it with volume, the market structure opens the door for a strong bullish continuation toward 100K and beyond.
📌 Patience here is key — confirmation turns this zone into the launchpad.

TradeCityPro | Bitcoin Daily Analysis #256👋 Welcome to TradeCity Pro!
Let’s move on to Bitcoin analysis. The market trend has started, and long triggers are being activated one after another.
⏳ 1-hour timeframe
Yesterday, Bitcoin made another bullish leg, and after breaking 89,040 and 90,373, it also activated the next trigger at 91,585.
✔️ At the moment, the zone Bitcoin has reacted to is 93,026, but the main resistance is located at 94,157.
📊 So far, we have had three entry points on Bitcoin, all of which are in profit, and from now on, any new entry on Bitcoin will be much riskier.
⚡️ For now, we can move our stop-losses up to the previous low at 91,118, and for taking profit, the next suitable zone would be 94,157.
↗️ For a new position, we can consider the break of 93,026 as a trigger, but the key point is that we have a major resistance at 94,157, which lies before Bitcoin reaches its target and can prevent this bullish wave from continuing, pushing the price into a correction.
🎲 For this reason, in my opinion, the 93,026 trigger is not very attractive and is quite risky, and personally, until 94,157 is broken, I won’t open any new positions on Bitcoin using another trigger.
🔽 As for short positions, the situation is completely clear: for now, we need to wait until a trend change occurs and a bearish structure is formed, and only then look for short triggers.
❌ Disclaimer ❌
Trading futures is highly risky and dangerous. If you're not an expert, these triggers may not be suitable for you. You should first learn risk and capital management. You can also use the educational content from this channel.
Finally, these triggers reflect my personal opinions on price action, and the market may move completely against this analysis. So, do your own research before opening any position.

BTC NEXT CYCLEMy unpopular opinion about 2026–2027.
Somewhere closer to summer 2026 the world will look too perfect.
Green energy headlines.
Stable inflation narratives.
“Recovery is strong.”
“Markets are resilient.”
Unicorns flying through Bloomberg terminals.
Everything will feel clean, sustainable and under control.
That’s usually the moment when things break.
I don’t believe the next problem will start with crypto.
Crypto is just the first victim, not the cause.
Energy comes first.
When energy prices spike or supply becomes unstable, mining becomes unprofitable.
Not “less profitable”.
Unprofitable.
Bitcoin miners don’t mine ideology.
They mine electricity.
If energy costs explode or access becomes restricted, miners shut down, sell reserves, and survive.
Price doesn’t argue with survival.
That’s how you get pressure that has nothing to do with narratives, ETFs, or “long-term adoption”.
Just math.
I strongly believe we will see Bitcoin below $63,000 this cycle.
Most likely much lower.
A sub-$40,000 print before the end of 2026 or sometime in 2027 doesn’t sound crazy to me at all.
Not because Bitcoin is weak.
But because the system around it is fragile.
Energy stress doesn’t come alone.
Food follows.
Logistics, fertilizers, production costs, weather, geopolitics — pick any combination.
When energy shakes, food doesn’t stay calm for long.
And here’s the uncomfortable part:
People who say
“that can’t happen”
will struggle much more than people who simply ask
“what if it does?”
This is not about panic.
It’s about mental positioning.
You don’t need to predict the exact event.
You just need to accept that smooth narratives usually end violently.
Markets don’t crash when everyone is scared.
They crash when everyone feels safe.
This is not financial advice.
This is pattern recognition.

TradeCityPro | Bitcoin Daily Analysis #255👋 Welcome to TradeCity Pro!
Let’s move on to Bitcoin analysis. The market has finally started a trend and can give us trading opportunities.
⏳ 1-hour timeframe
On Bitcoin, we had two entry points. The first was the break of 89,040, and the second was the break of 90,373.
⚖️ If you opened a position with either of these triggers, your position is now in profit and you can take profit.
💥 At the moment, Bitcoin is dealing with the 91,585 zone, and given the bullish momentum present in the market, the probability of breaking this level is high.
✨ In case 91,585 breaks, we can open a long position. This trigger will be riskier compared to the previous triggers we had.
💡 For now, Bitcoin’s trend on the LWC has turned bullish, and this trend can continue. However, if the move turns out to be a fake and price stabilizes below 90,373, we can take confirmation of a bearish shift in price.
📊 In that case, we can look for short triggers, but until then, I am not focusing on short positions for now.
❌ Disclaimer ❌
Trading futures is highly risky and dangerous. If you're not an expert, these triggers may not be suitable for you. You should first learn risk and capital management. You can also use the educational content from this channel.
Finally, these triggers reflect my personal opinions on price action, and the market may move completely against this analysis. So, do your own research before opening any position.

Potential PullBack to $110K on BTCUSDFollowing the previous analysis, this phase marks the critical inflection point that will determine our long-term directional bias. Price is now positioned to pull back into intra-weekly premium, and the reaction from that zone will reveal whether bullish momentum is ready to re-assert dominance.
While one element of my full confirmation model is still missing, the structure is tightening and the market is preparing for a decisive move.
High-Probability Setup (3× Potential)
Direction: Long
Entry: $87,700
Stop Loss: $81,000
Targets:
* $100,000
* $110,000
* $117,000
This structure provides a powerful asymmetric opportunity. Manage your size with discipline, risk should always remain proportional and controlled.
Welcome to Chaos.

TradeCityPro | Bitcoin Daily Analysis #252👋 Welcome to TradeCity Pro!
Let’s move on to Bitcoin analysis. The market is still ranging — even on New Year’s Eve!
⏳ 1-hour timeframe
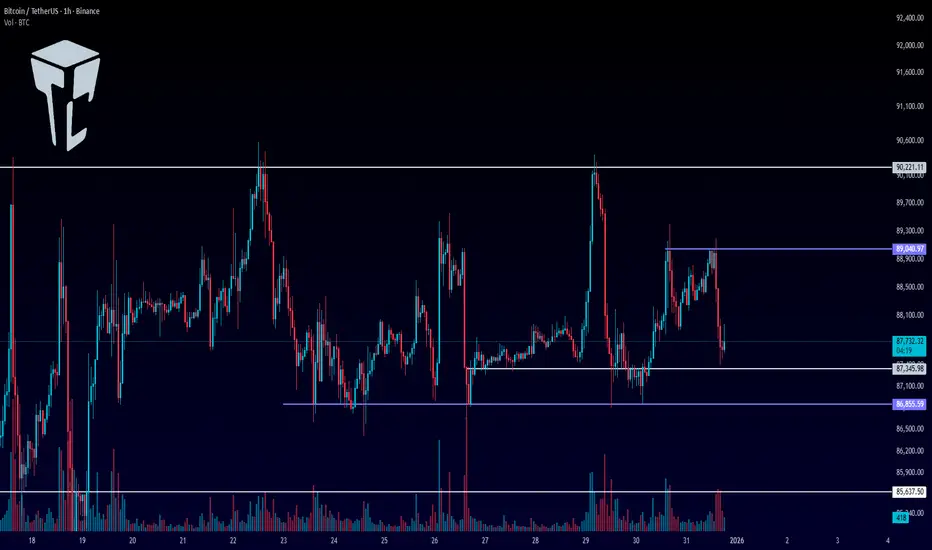
Bitcoin is still inside the range box it has been in over the past period and is fluctuating within this zone.
✔️ A high that formed for Bitcoin yesterday, which was tested twice, is the 89,040 area, and we can use it as a trigger today.
⚖️ If 89,040 breaks, we can open a very risky long position.The main trigger is still the break of 90,221.
✨ For shorts, our triggers have not changed compared to before.The breaks of 87,345 and 86,855 are both suitable triggers for short positions.
💥 The main short trigger on Bitcoin is 85,637.Given the low volume, I think until the Christmas holidays are over, the market won’t have any major moves. However, it’s very important to stay behind the chart so that we can open positions if the main triggers get
❌ Disclaimer ❌
Trading futures is highly risky and dangerous. If you're not an expert, these triggers may not be suitable for you. You should first learn risk and capital management. You can also use the educational content from this channel.
Finally, these triggers reflect my personal opinions on price action, and the market may move completely against this analysis. So, do your own research before opening any position.
TradeCityPro | Bitcoin Daily Analysis #251👋 Welcome to TradeCity Pro!
Let’s move on to Bitcoin analysis. Bitcoin is still ranging, and the longer this ranging continues, the higher the probability of a move starting.
⏳ 1-hour timeframe
Yesterday, Bitcoin was supported from the support zone that had formed between 86,855 and 87,355, and currently, with increasing volume, it is moving upward.
✔️ Yesterday, with the break of 87,345, we could open a risky short position on Bitcoin, but the price was supported from 86,855 and started an upward move.
✨ Currently, the price is still inside the same range box between 86,855 and 90,221, with the difference that volume has increased with the start of the new week.
🔔 Bitcoin’s triggers have not changed yet, and we can still open a short position with the break of 86,855 and a long position with the break of 90,221.
🧩 For now, whatever trigger the market gives, I open short-term positions with it and take profits quickly.
🎯 If, along with the break of triggers, volume also increases, the probability of the move continuing increases, and we can open long-term positions as well by breaking the next triggers.
❌ Disclaimer ❌
Trading futures is highly risky and dangerous. If you're not an expert, these triggers may not be suitable for you. You should first learn risk and capital management. You can also use the educational content from this channel.
Finally, these triggers reflect my personal opinions on price action, and the market may move completely against this analysis. So, do your own research before opening any position.

TradeCityPro | Bitcoin Daily Analysis #250👋 Welcome to TradeCity Pro!
Let’s move on to Bitcoin analysis. Today is the first day of the week, and with the start of the new week, Bitcoin has shown some volatility today.
⏳ 1-hour timeframe
Yesterday, we had two temporary resistance zones on Bitcoin that the price did not react to at all, and with a sharp move it went toward 90,221, and then after getting rejected from this zone, it again dropped sharply down to 87,345.
📊 The volume of both moves was high, but the number of strong red candles was much higher, so it can be said that the selling power is stronger.
✔️ On the other hand, the market momentum is currently bearish, and if the 87,345 or 86,855 zones break, the price can move downward.
⚡️ So, the break of 87,345 can be used as a risky short trigger, and the break of 86,855 as a more reliable short trigger.The main trigger for Bitcoin turning bearish is still 85,637.
💡 But if Bitcoin gets supported from this area between 87,345 and 86,855, the price can move back toward 90,221, and if this zone breaks, it can start a bullish move.
⚖️ So, with the break of 90,221, we can open a long position.Breaking this zone will be the first confirmation of Bitcoin turning bullish.
❌ Disclaimer ❌
Trading futures is highly risky and dangerous. If you're not an expert, these triggers may not be suitable for you. You should first learn risk and capital management. You can also use the educational content from this channel.
Finally, these triggers reflect my personal opinions on price action, and the market may move completely against this analysis. So, do your own research before opening any position.

TradeCityPro | Bitcoin Daily Analysis #249👋 Welcome to TradeCity Pro!
Let’s move on to Bitcoin analysis. Today is the last day of the week, and the market is still ranging.
⏳ 1-hour timeframe
Bitcoin is still ranging, and yesterday it formed a new low.
✔️ The previous low on Bitcoin was at the 86,855 zone, which the price was supported from, and now it has formed a higher low at 87,345.
💡 The resistance zones above the price are 88,376 and 89,199.
⚡️ These zones do not have strong supply and demand significance, and if the market trend is going to start, in my opinion they won’t be able to stop the price movement.
🎯 The main zones right now are 85,637 and 90,221.As long as the price is between these two zones, any position we open is risky and profits should be taken quickly.
✨ We will get confirmation of the start of the next Bitcoin move with stabilization below 85,637 or above 90,221.Breaking these two zones are triggers that I try to open positions with.
⚖️ Until then, we can open short-term, very low-risk positions.with breaks of 87,345 and 86,655 for shorts, and with breaks of 88,376 and 89,199 for longs.
❌ Disclaimer ❌
Trading futures is highly risky and dangerous. If you're not an expert, these triggers may not be suitable for you. You should first learn risk and capital management. You can also use the educational content from this channel.
Finally, these triggers reflect my personal opinions on price action, and the market may move completely against this analysis. So, do your own research before opening any position.

TradeCityPro | Bitcoin Daily Analysis #248👋 Welcome to TradeCity Pro!
Let’s move on to Bitcoin analysis. After a few days without posting an analysis, let’s take a look at Bitcoin and see what the market has been doing during this time.
⏳ 4-hour timeframe
On the 4-hour timeframe, Bitcoin hasn’t shown any major difference compared to our previous analysis and is still inside the same large range box between 84,500 and 93,789.
✔️ Since Bitcoin has been inside this box for a long time, additional support and resistance levels have also formed within the range.
💡 Currently, the price has formed a smaller range between 86,555 and 90,018, and it is fluctuating between these two zones with very low volume.
⭐ Since Bitcoin’s previous low was recorded at 84,500, if the price gets supported at 86,555 and forms a higher low compared to 84,500, the probability of breaking 90,018 will increase significantly.
🎯 If 90,018 breaks, bullish momentum can enter the market, and if this momentum comes along with increased volume, Bitcoin can also break the next resistance zones such as 93,789 and 96,476.
⚡️ With the break of 93,789, we can get confirmation of Bitcoin turning bullish. But before that, any long position that gets opened, I personally take profits quickly, because there is no strong momentum in the market.
🔔 For short positions, the triggers we currently have are 86,855 and 84,500.Price stabilization below 84,500 will confirm Bitcoin turning bearish.
❌ Disclaimer ❌
Trading futures is highly risky and dangerous. If you're not an expert, these triggers may not be suitable for you. You should first learn risk and capital management. You can also use the educational content from this channel.
Finally, these triggers reflect my personal opinions on price action, and the market may move completely against this analysis. So, do your own research before opening any position.

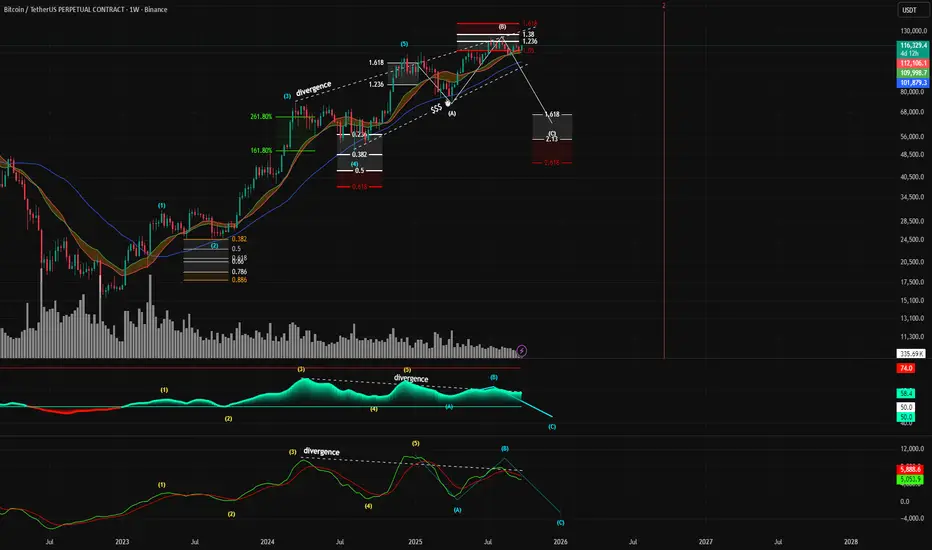
Expanding Flat Elliot wave countBitcoin may be approaching a significant macro top, with multiple technical indicators aligning to signal a potential reversal and a subsequent major corrective wave.
Key Projections:
Potential Top Formation: The current price action is forming what appears to be the peak of a corrective Wave (B), with a potential top range between $109,000 and $150,000.
Projected Corrective Target: Following the completion of Wave (B), a significant downward move, labeled as Wave (C), is anticipated. This corrective wave targets the $45,000 - $67,000 price zone.
Timeline: The entire corrective structure, from the formation of the top to the potential bottom of Wave (C), is projected to unfold by approximately September 2026.
Elliott Wave Structure: The primary thesis is based on an Elliott Wave count. The chart indicates the completion of a five-wave impulse cycle, and the market is now in a larger A-B-C corrective pattern. The current price is likely forming the peak of the B-wave.
Fibonacci Confluence: There is a strong confluence of Fibonacci extension levels at the potential top. The peak of the current Wave (B) is precisely testing the 1.618 Fibonacci extension level, a critical ratio often associated with the termination of corrective waves.
Significant Bearish Divergence (Crucial Point): This is one of the most compelling signals on the chart.While the price is making higher highs (from the peak of wave (5) to the peak of wave (B)).Both the RSI and the MACD indicators are showing lower highs. This is a classic, multi-indicator bearish divergence on a high timeframe (weekly), indicating that the upward momentum is weakening significantly and a trend reversal is becoming more likely.
TradeCityPro | Bitcoin Daily Analysis #247👋 Welcome to TradeCity Pro!
Let’s move on to Bitcoin analysis; the market hasn’t changed much since yesterday and is still ranging.
⏳ 1-Hour Timeframe
Bitcoin is still in the range box between 89,849 and 90,590, and just like yesterday, it is fluctuating between these two zones today.
✔️ Today, the probability of movement during the New York session is high because Bitcoin is in a very small compression, and breaking this compression from either side can give us a position.
📊 Volume has decreased even further since yesterday, and this is another sign that a move is close. So, if volume enters and triggers are activated, a sharp move in Bitcoin could begin.
⭐ Today, we can open a short position after breaking the 89,849 zone.
🎲 The main short trigger is still 88,890, and breaking 89,849 will be the precursor to that.
↗️ For a long position, breaking 90,590 is a good trigger.We will get the main confirmation of Bitcoin turning bullish after a stabilization above 92,942 and 94,167.
💧 Today, any movement Bitcoin makes in either direction, if accompanied by increased volume, could continue.
✨ But if we see volume divergence, the likelihood of a fakeout increases.
❌ Disclaimer ❌
Trading futures is highly risky and dangerous. If you're not an expert, these triggers may not be suitable for you. You should first learn risk and capital management. You can also use the educational content from this channel.
Finally, these triggers reflect my personal opinions on price action, and the market may move completely against this analysis. So, do your own research before opening any position.

TradeCityPro | Bitcoin Daily Analysis #246👋 Welcome to TradeCity Pro!
Let’s move on to Bitcoin analysis. The market has been ranging for a few days, but it still gives positions, and if we stay behind the chart, we can make profits from the market.
⏳ 1-hour timeframe
On the 1-hour timeframe, Bitcoin has formed a range box between the 88890 and 94167 zones, and for several days it has been moving between these two areas.
✔️ Currently, near the bottom of the box, the price has created a smaller range between 89849 and 90590, and since today is Saturday and volume is low, it is ranging between these two zones.
💥 If the price exits this box, the next move can continue toward either the top or the bottom of the main box.
🔔 That means with a break of 89849, the move can continue down toward 88890.
🎲 But if 90590 breaks, I will wait for a higher low and higher high to form above this zone, and then I will enter a long position.
⛏ The next resistance zones for Bitcoin are 92942 and 94167.
🧩 We get confirmation of Bitcoin turning bullish with a break of 94167. In that case, an upward move in higher cycles can begin.
⭐ On the other hand, if the price stabilizes below 88890, it can move again toward the 84000 support.
❌ Disclaimer ❌
Trading futures is highly risky and dangerous. If you're not an expert, these triggers may not be suitable for you. You should first learn risk and capital management. You can also use the educational content from this channel.
Finally, these triggers reflect my personal opinions on price action, and the market may move completely against this analysis. So, do your own research before opening any position.

TradeCityPro | Bitcoin Daily Analysis #245👋 Welcome to TradeCity Pro!
Let’s move on to the Bitcoin analysis. After the fake move we had yesterday, today Bitcoin has entered a ranging box.
⏳ 1-hour timeframe
Yesterday on Bitcoin we had a trigger at the 91447 zone that we could use as a long trigger.
🎯 Before that, we also had a trigger on Bitcoin at 89849 which had been activated, and with the break of 91447 the second trigger was also activated.
🎲 After this trigger was activated, given the trend weakness we had on Bitcoin, the price could not stabilize above 91447, and with that move being faked, it dropped again to 89849.
⛏ The 89849 zone is an important support area on Bitcoin, and the next support we have on Bitcoin is 88890.
✔️ Considering that Bitcoin has faked both the 89849 low and the 91447 high once, we can say currently there is no specific trend in the market, and we can open both short and long positions.
📊 For a long position, again we can enter with the break of 91447 and open our position.
✔️ In case the market drops, we have two short triggers:
the first is 89849 and the second is 88890, and by breaking either of them we can have a trigger for a short.
❌ Disclaimer ❌
Trading futures is highly risky and dangerous. If you're not an expert, these triggers may not be suitable for you. You should first learn risk and capital management. You can also use the educational content from this channel.
Finally, these triggers reflect my personal opinions on price action, and the market may move completely against this analysis. So, do your own research before opening any position.

TradeCityPro | Bitcoin Daily Analysis #244👋 Welcome to TradeCity Pro!
Let’s move on to Bitcoin analysis; with the start of the new week, the market has taken a fresh trend.
⏳ 1-hour timeframe
Yesterday on Bitcoin, we had two very important levels that the price was fluctuating between.
⭐ The resistance zone 90022 and the support 88890 were the areas where breaking either of them could give us a position.
💥 The first position we could open yesterday was a short, which after breaking 88890 made a sharp move that would reach our target as well, but afterward the price started a bullish move, and after the previous bearish move turned into a fakeout, a lot of bullish momentum entered it.
💧 After this move, the 90022 trigger also activated, and Bitcoin moved upward to the 91447 area.
🧩 Overall, yesterday was a very volatile day, because after reaching 91447, Bitcoin corrected to near 88890, and then again moved upward.
🎲 But today Bitcoin was struggling with the 91447 zone, which it has so far managed to break, and with a bit of momentum and a slight slope, it is moving upward.
⚡️ We can see this trend weakness inside the RSI; the shape of the candles also shows a lot of trend weakness, but volume still doesn’t have a strong divergence with the bullish trend.
✔️ If this weakness continues, the probability of a fake break of 91447 and the start of a new bearish move increases a lot.
🔔 But if Bitcoin keeps its momentum and the move continues, the next zone the price can react to will be 93609.
❌ Disclaimer ❌
Trading futures is highly risky and dangerous. If you're not an expert, these triggers may not be suitable for you. You should first learn risk and capital management. You can also use the educational content from this channel.
Finally, these triggers reflect my personal opinions on price action, and the market may move completely against this analysis. So, do your own research before opening any position.

TradeCityPro | Bitcoin Daily Analysis #242👋 Welcome to TradeCityPro!
Let’s move on to the Bitcoin analysis. Today is Saturday, and after yesterday’s drop, the market is ranging and resting.
⌛️ 1-Hour Timeframe
Yesterday, we saw clear signs of correction and bearish momentum in Bitcoin, and with a sell-off candle, the price dropped to the 89,082 level.
🔭 After reaching this zone, the correction has paused, and Bitcoin is now moving sideways near 89,082.
💥 On the RSI oscillator, we had a descending trendline that RSI respected very well.
✨ Now that this trendline has been broken, RSI is testing the 42.25 resistance level.
⚡️ If RSI breaks above this level, we will have the first signal of bullish momentum returning to Bitcoin.
🎲 If we get that confirmation from RSI, we can then look for a long trigger on the Bitcoin chart itself.
🧩 Once BTC breaks the short-term structure it forms by then, we can open a long position.
🎯 However, since today is Saturday, I personally prefer to wait and avoid opening any trades until the new week starts.
💡 Still, I’ll stay behind the chart, and if the bullish scenario plays out, I will open a long position.
📊 For a short position, we can enter on a break of 89,082, but honestly, many altcoins paired with BTC have much better short triggers right now.
❌ Disclaimer ❌
Trading futures is highly risky and dangerous. If you're not an expert, these triggers may not be suitable for you. You should first learn risk and capital management. You can also use the educational content from this channel.
Finally, these triggers reflect my personal opinions on price action, and the market may move completely against this analysis. So, do your own research before opening any position.

TradeCityPro | Bitcoin Daily Analysis #241👋 Welcome to TradeCity Pro!
Let’s move on to today’s Bitcoin analysis. The market is currently in a downward correction phase.
⏳ 1-Hour Timeframe
Yesterday, Bitcoin corrected down to 91,974, and as I mentioned, the bullish momentum the market had was gone.
🔔 Now the correction has become deeper, and the price has fallen to 90,421.
✔️ The last candle we saw shows strong seller dominance, and with the high selling volume, it could very well be the beginning of a new downward move.
💥 The RSI oscillator, after resetting yesterday, has now dropped all the way to the 30 level, with the possibility of breaking below it and entering the oversold zone.
💫 If that happens, given the strong selling pressure and powerful red candles, the probability of a drop toward lower levels will increase significantly.
🧩 One area the price hasn’t reacted to properly is 89,082.
🎲 This level used to be very important for Bitcoin, but recently the price hasn’t respected it much.
⭐ If the price again fails to react to this level on the next move down, we can conclude that this support has weakened.
⚖️ However, in my opinion, if buyers are going to step in, this level is not a bad candidate for a reaction.
🔭 If Bitcoin gets supported at 89,082 and moves upward, it will form a higher low compared to 85,220, which increases the probability of a bullish structure forming.
☘️ But if 89,082 breaks, the downward move toward 85,220 will begin, and that could even signal the start of the next major bearish wave on the daily timeframe.
❌ Disclaimer ❌
Trading futures is highly risky and dangerous. If you're not an expert, these triggers may not be suitable for you. You should first learn risk and capital management. You can also use the educational content from this channel.
Finally, these triggers reflect my personal opinions on price action, and the market may move completely against this analysis. So, do your own research before opening any position.

TradeCityPro | Bitcoin Daily Analysis #240👋 Welcome to TradeCity Pro!
Let’s move on to today’s Bitcoin analysis. The market has started its correction phase today.
⏳ 1-Hour Timeframe
Yesterday, Bitcoin had a very strong bullish momentum and reached the 93,609 level.
✨ Breaking this level could have continued Bitcoin’s upward movement, but the price failed to break through and faked it, starting a correction instead.
💥 The RSI oscillator, as I mentioned before, was showing strong bullish momentum while above the 50 level. However, with the break of this level, the bullish momentum faded, and Bitcoin entered a deeper correction.
📊 During this correction, volume has decreased significantly, and the price has corrected down to 91,974.
The reaction of the price to this level is very important.
⚡️ If the price is supported at 91,974, the likelihood of breaking the resistance increases, and the price could break through this level in future attempts.
💫 However, if the price breaks 91,974 and volume increases, Bitcoin could see deeper corrections, potentially moving to 90,421 or even 88,082.
✔️ For now, I’m only looking for long positions and will open a long position if 93,609 is broken.
⭐ However, I won’t open a short position if 91,974 breaks; I’ll wait for more bearish momentum to enter the market before considering a short.
❌ Disclaimer ❌
Trading futures is highly risky and dangerous. If you're not an expert, these triggers may not be suitable for you. You should first learn risk and capital management. You can also use the educational content from this channel.
Finally, these triggers reflect my personal opinions on price action, and the market may move completely against this analysis. So, do your own research before opening any position.

TradeCityPro | Bitcoin Daily Analysis #238👋 Welcome to TradeCity Pro!
Let’s move on to today’s Bitcoin analysis. The market is currently in a correction phase after the bearish leg it experienced yesterday.
⏳ 1-Hour Timeframe
After the drop Bitcoin made, even fake-breaking the 85,220 level,
✔️ the price has started its correction, reaching up to 87,088.
🔔 During this correction, a Head & Shoulders pattern has formed, with the activation trigger being the 87,088 level.
💥 If this pattern gets activated, deeper corrections could follow.
The next resistance zone to watch is 89,082.
📊 Market volume has increased with the start of the new week, but during this correction, the volume is decreasing. This indicates that the downtrend still holds strength, and the likelihood of the trend continuing remains high.
💡 In this case, we can open a short position either after a fakeout at 89,082 or by confirming a Dow Theory breakdown.
The main short trigger right now is the 85,220 level.
📈 For a long position, breaking 89,082 is a risky trigger.
Personally, I prefer to wait for more confirmation before deciding to enter a long position on Bitcoin.
❌ Disclaimer ❌
Trading futures is highly risky and dangerous. If you're not an expert, these triggers may not be suitable for you. You should first learn risk and capital management. You can also use the educational content from this channel.
Finally, these triggers reflect my personal opinions on price action, and the market may move completely against this analysis. So, do your own research before opening any position.
