TradeCityPro | Bitcoin Daily Analysis #218👋 Welcome to TradeCity Pro!
Let’s dive into the Bitcoin analysis. Today, the market has started another upward move.
⏱ 1-Hour Timeframe
Yesterday, after breaking the support zone, Bitcoin made a downward move to the 10,2489 level. Now, it has started another upward movement.
The price is currently facing resistance at the 10,5020 level, and as you can see, it has experienced a strong rejection from this level, which has caused the bullish momentum to fade from the market.
This rejection at the 10,5020 level makes it a very important zone. If this level is broken, it will act as a strong trigger for a long position.
The first trigger for a long position:
The first trigger for a long position is the 10,5020 level. The next main trigger, which is our primary long trigger, is at 10,6644.
For a short position:
If the downward momentum continues, we can open a short position when the 10,2489 level is broken.
However, as long as the price is ranging between 10,2489 and 10,5020, I prefer not to open any new positions.
Bullrun

TradeCityPro | Bitcoin Daily Analysis #217👋 Welcome to TradeCity Pro!
Let’s dive into the Bitcoin analysis. The market has finally started an upward move, and the triggers we set yesterday have been activated.
⏳ 1-Hour Timeframe
Yesterday, Bitcoin created a smaller range box between the 10,601 and 10,2489 levels, and after breaking the upper range of the box, the price moved up to the upper boundary of the main box at 10,3855.
📊 Volume increased throughout this move, and the strength of the green candles grew significantly. The 10,3855 resistance was also broken, and with the RSI entering the overbought zone, a sharp upward move began.
⚡️ This upward move continued to 10,6412, and after reaching this level, momentum started to slow down, and RSI exited the overbought zone. The price is now ranging below 10,6412.
📈 Today’s trigger:
The key trigger for Bitcoin today is breaking the 10,6412 level. If this level is broken, the upward move will continue.
✔️ In case of a correction, if the price forms a higher low above 10,3855, the bullish trend will remain intact, and the next upward leg could start.
🔽 For a short position, I don’t think we should pursue it yet. We should wait for the trend to turn bearish again. The confirmation for a bearish trend will come if the price stabilizes below 10,3855.
❌ Disclaimer ❌
Trading futures is highly risky and dangerous. If you're not an expert, these triggers may not be suitable for you. You should first learn risk and capital management. You can also use the educational content from this channel.
Finally, these triggers reflect my personal opinions on price action, and the market may move completely against this analysis. So, do your own research before opening any position.

TradeCityPro | Bitcoin Daily Analysis #216👋 Welcome to TradeCity Pro!
Let’s dive into the Bitcoin analysis. The market has finally started an upward move, and the triggers we set yesterday have been activated.
⏳ 1-Hour Timeframe
Yesterday, Bitcoin created a smaller range box between the 10,601 and 10,2489 levels, and after breaking the upper range of the box, the price moved up to the upper boundary of the main box at 10,3855.
📊 Volume increased throughout this move, and the strength of the green candles grew significantly. The 10,3855 resistance was also broken, and with the RSI entering the overbought zone, a sharp upward move began.
✅ This upward move continued to 10,6412, and after reaching this level, momentum started to slow down, and RSI exited the overbought zone. The price is now ranging below 10,6412.
🚀 Today’s trigger:
The key trigger for Bitcoin today is breaking the 10,6412 level. If this level is broken, the upward move will continue.
🔽 In case of a correction, if the price forms a higher low above 10,3855, the bullish trend will remain intact, and the next upward leg could start.
⚖️ For a short position, I don’t think we should pursue it yet. We should wait for the trend to turn bearish again. The confirmation for a bearish trend will come if the price stabilizes below 10,3855.
❌ Disclaimer ❌
Trading futures is highly risky and dangerous. If you're not an expert, these triggers may not be suitable for you. You should first learn risk and capital management. You can also use the educational content from this channel.
Finally, these triggers reflect my personal opinions on price action, and the market may move completely against this analysis. So, do your own research before opening any position.

Bitcoin Daily Analysis #12 — November 10, 2025
Bitcoin has triggered our entry setup 🔔
As I mentioned before, fear during FOMO candles means nothing — what truly matters is structure and confirmation.
It seems that Bitcoin has found support around the $100,000 zone and could be starting a new bullish leg 🚀
Any higher low above $104,000 will serve as a confirmation of an uptrend ✅
Disclaimer:
This content is for informational purposes only and does not constitute financial or investment advice. © DIBAPRISM
Larry D.Kohn

ZK - Short-Term Setup, Long-Term Vision!📈 ZK has recently shown strong momentum but is now entering a short-term correction phase after facing resistance around the blue zone.
In the immediate term, I’ll be looking for short-term long opportunities near the red structure zone, which aligns with a strong support area and potential buyer interest.
🏹From a broader perspective, the real bullish confirmation will come once price breaks and holds above the blue resistance zone. That’s where long-term buyers are expected to step in, paving the way for a sustained bullish trend.
⚔️For now, short-term traders can play the bounce, while long-term investors should keep an eye on that breakout for a possible trend shift.
⚠️ Disclaimer: This is not financial advice. Always do your own research and manage risk properly.
📊All Strategies Are Good; If Managed Properly!
~Richard Nasr

TradeCityPro | Bitcoin Daily Analysis #215👋 Welcome to TradeCity Pro!
Let’s move on to Bitcoin analysis. Today is Sunday, and the price is ranging inside a new box it has formed. The breakout from this box is critical and could be the start of the next move.
⏳ 1-Hour Timeframe
On the 1-hour timeframe, Bitcoin has formed a large ranging box between the 100,308 and 103,855 levels, and the price has already faked out once to the downside.
🔔 After this fakeout, a bullish move began, pushing the price up to 103,855.
✅ However, since this move happened on Friday and we entered the weekend afterward, the market's momentum has faded, and now, the price is ranging within a much smaller box.
🎲 This range is forming between 101,601 and 102,489, and breaking either of these levels could give us a position.
💡 A key point to remember is that volume must increase in the direction the price breaks. If volume diverges from the price, the move is likely to be a fakeout.
☘️ The main triggers are still 100,308 and 103,855. Breaking either of these zones will set off the next major move in the market.
❌ Disclaimer ❌
Trading futures is highly risky and dangerous. If you're not an expert, these triggers may not be suitable for you. You should first learn risk and capital management. You can also use the educational content from this channel.
Finally, these triggers reflect my personal opinions on price action, and the market may move completely against this analysis. So, do your own research before opening any position.

TradeCityPro | Bitcoin Daily Analysis #214👋 Welcome to TradeCity Pro!
Let’s dive into the Bitcoin analysis. The market is finally showing signs of turning bullish. Let's do a complete analysis of Bitcoin.
⏳ 1-Hour Timeframe
Yesterday, Bitcoin faked the low it had formed, which helped the bullish momentum enter the market.
✨ Currently, after reacting to the 103,855 level, Bitcoin has entered a correction and is now attempting to form a higher low.
✅ If this higher low is formed and the price moves towards 103,855 again, we can open a long position when this level is broken.
⭐ This trigger is the first for a long position and, naturally, it will be a bit risky. However, I prefer to keep this position open because if the market decides to move upward in the future, we can more easily open new positions.
📊 For a short position, I am currently waiting for the market to create more structure and new triggers to emerge. For now, the only trigger we have is the 100,308 level.
🎲 The volume has slightly decreased compared to yesterday, which is normal because today is Saturday. We need to observe how the buyer and seller volume compares today, and based on that, we can determine the strength of the buyers and sellers.
❌ Disclaimer ❌
Trading futures is highly risky and dangerous. If you're not an expert, these triggers may not be suitable for you. You should first learn risk and capital management. You can also use the educational content from this channel.
Finally, these triggers reflect my personal opinions on price action, and the market may move completely against this analysis. So, do your own research before opening any position.

TradeCityPro | Bitcoin Daily Analysis #213👋 Welcome to TradeCity Pro!
Let’s dive into the Bitcoin analysis. The market has been calm for a few days, but we need to stay alert in case a new move starts, so we don’t miss out.
⏳ 1-Hour Timeframe
After reacting to the 0.382 Fibonacci level, Bitcoin started to drop again and reached the 100,308 support.
✨ Currently, after a minor bullish correction, the price is heading back towards the 100,308 support.
✅ Breaking this support still seems like a strong trigger for a short position. Even yesterday, when the price briefly reached this zone with a shadow, we saw clear buying interest in this area, with a significant increase in buying volume as the price touched the support.
🔑 The key point is that every time the price reacts to this level, the buying pressure is getting weaker. Fewer and fewer buyers are willing to buy at this level.
🎲 If this pattern continues, the psychological level of 100,000 will lose its impact, and breaking it will become easier.
⚖️ So, if the price touches this support a few more times, I anticipate a higher chance of the level breaking.
⭐ However, if the buyers show more strength at this level and can push the price above 104,000 with significant volume, we could expect Bitcoin to turn bullish.
📝 Final Thoughts
Stay calm, trade wisely, and let's capture the market's best opportunities!
This analysis reflects our opinions and is not financial advice.
Share your thoughts in the comments, and don’t forget to share this analysis with your friends! ❤️

TradeCityPro | Bitcoin Daily Analysis #212👋 Welcome to TradeCity Pro!
Let’s dive into the Bitcoin analysis. The market has entered a corrective phase and is preparing for the next wave of movement.
⏳ 1-Hour Timeframe
On the 1-hour timeframe, Bitcoin started correcting after reaching the support at 100,308 and has now retraced to the 0.382 Fibonacci level.
📊 Market volume significantly increased around the 100,308 support, indicating that this zone is very sensitive and important, with price reacting to it.
✨ Currently, volume has decreased slightly, and the price is in a corrective phase. If this correction continues, the next resistance zones will be at the 0.5 and 0.618 Fibonacci levels.
⭐ However, if the price continues its downward movement, we can open a position with a candlestick setup when the volume increases towards 100,308, or wait for the break of the 100,308 support to open a position.
✅ For a long position, if buying volume increases, the break of the 0.382 Fibonacci level would be a good trigger for a long entry.
❌ Disclaimer ❌
Trading futures is highly risky and dangerous. If you're not an expert, these triggers may not be suitable for you. You should first learn risk and capital management. You can also use the educational content from this channel.
Finally, these triggers reflect my personal opinions on price action, and the market may move completely against this analysis. So, do your own research before opening any position.

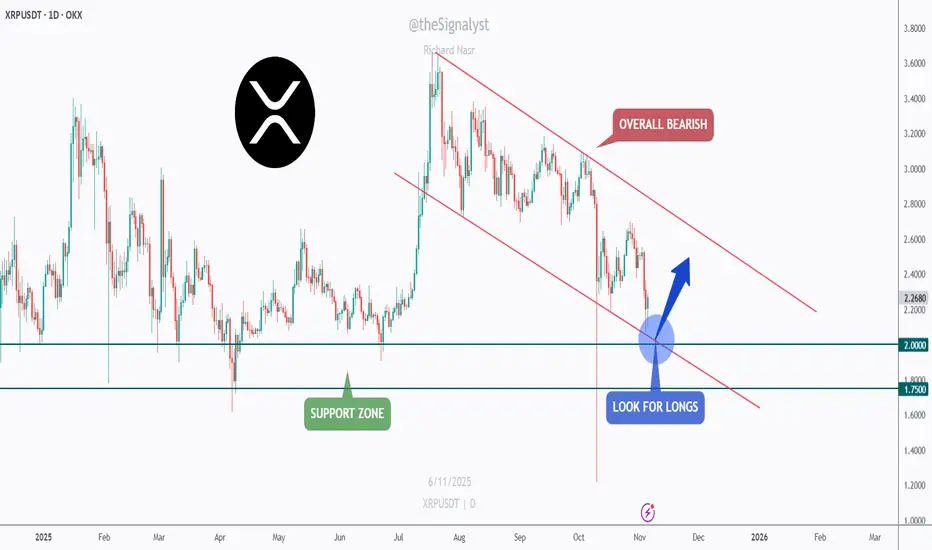
XRP - Watching the Confluence Zone for a Bullish Rebound!📉XRP has been in a clear bearish channel for months , forming consistent lower highs and lower lows.
However, the current structure is approaching a critical confluence zone, where the lower bound of the red channel meets the major green support area between $1.75 and $2.00.
⚔️As long as this intersection holds, I’ll be looking for potential long opportunities, anticipating a short-term bullish correction toward the upper boundary of the channel.
This setup offers a clean risk-to-reward opportunity if the bulls manage to defend the zone and regain momentum.
If the support gives way, further downside could follow, but for now, this area remains a key decision point for XRP’s next move.
⚠️ Disclaimer: This is not financial advice. Always do your own research and manage risk properly.
📊All Strategies Are Good; If Managed Properly!
~Richard Nasr
TradeCityPro | Bitcoin Daily Analysis #211👋 Welcome to TradeCity Pro!
Let’s dive into the Bitcoin analysis. The market is still in a downtrend and has reached its next support!
⏳ 4-Hour Timeframe
Bitcoin finally broke the important support at 106,396 yesterday, and with a very high selling volume, it managed to start its new downward wave.
💥 The RSI oscillator also entered the oversold zone at the same time as the 106,396 break, which was another reason for the market's drop.
⚡️ This downward move has reached the 100,308 support, and the price has calmed down a bit now.
✅ The psychological level of 100,000 is extremely important. Despite the massive selling volume and bearish momentum in the market, buyers haven’t allowed the price to stabilize below this level, and now the market is in a corrective phase.
🧩 After the price reacted to this zone, the volume has significantly decreased, which favors the sellers. If the buying volume remains low, the price will likely start falling again with the entrance of new selling volume.
🔔 However, since the RSI has faked the 30 level and the market momentum could turn bullish, we could see a reversal. If the volume starts to increase and considering the bullish trend on higher timeframes like the weekly chart, we could open a position.
🔍 For now, the first long trigger we have in this timeframe is 111,789. If the price can sharply recover to this level, a very strong bullish trend could begin.
💡 The main resistance zone we have is 115,771, and breaking this level will confirm the start of Bitcoin's new upward wave. We can look to enter the trend after breaking 111,789. If the price builds further structure, we can enter earlier with smaller triggers.
❌ Disclaimer ❌
Trading futures is highly risky and dangerous. If you're not an expert, these triggers may not be suitable for you. You should first learn risk and capital management. You can also use the educational content from this channel.
Finally, these triggers reflect my personal opinions on price action, and the market may move completely against this analysis. So, do your own research before opening any position.

TradeCityPro | Bitcoin Daily Analysis #210👋 Welcome to TradeCity Pro!
Let's dive into the Bitcoin analysis. The bearish movement of Bitcoin has begun, so it's best to analyze the market together.
⏳ 1-Hour Timeframe
On the 1-hour timeframe, Bitcoin is in a downtrend, and after breaking the 105,780 level yesterday, it continues its downward movement.
📈 The next low point the price reached was 104,488, which has also been broken, and the price is still moving downward.
💥 The RSI oscillator is at a very important support level around 30, and from both a momentum and candlestick perspective, we can say there is no weakness in the trend.
✨ Therefore, a break below the 30 level and into the oversold zone significantly increases the likelihood of a sharp downward move.
✔️ Currently, we don’t have a short trigger because the price has moved very sharply, and no specific trigger has been formed. However, once RSI enters the oversold zone, we can use candlestick setups for entries.
🎲 As long as the price doesn’t create a lower low and lower high below 104,488, I won’t consider the break of this level valid, and there’s a possibility of this bearish move being a fakeout.
🧮 If the price stabilizes above 105,780, it would confirm the fakeout. However, if the price stabilizes below 104,488, the next wave of the drop will begin.
❌ Disclaimer ❌
Trading futures is highly risky and dangerous. If you're not an expert, these triggers may not be suitable for you. You should first learn risk and capital management. You can also use the educational content from this channel.
Finally, these triggers reflect my personal opinions on price action, and the market may move completely against this analysis. So, do your own research before opening any position.

ZEC - Roadmap to $500!💪Zcash has been on fire lately, outperforming over 90% of altcoins in the market. After months of accumulation, the bulls have finally taken control, driving ZEC into a strong impulsive rally that shows no signs of exhaustion yet.
📈 From a technical perspective , ZEC is trading within a well-defined rising channel, maintaining a clean bullish structure of higher highs and higher lows. The recent breakout above the previous all-time high around $372 confirms strong bullish momentum.
🏹As long as the channel’s lower boundary continues to act as dynamic support, the next logical target for the bulls sits around the $500 round number, which aligns with the upper boundary of the channel, a major confluence zone.
In the short term, a minor pullback toward the $370–$400 region wouldn’t be surprising and could offer new long opportunities before the next bullish leg kicks in.
⚠️ Disclaimer: This is not financial advice. Always do your own research and manage risk properly.
All Strategies Are Good; If Managed Properly!
~Richard Nasr

Ethereum Analysis – November 03, 2025Welcome to DIBA PRISM Daily Analysis 💫
Ethereum is currently in a bullish phase 📈 — compared to its previous market cycles and Bitcoin’s recent performance, ETH still shows room for further upside 🚀
Right now, Ethereum is in a corrective phase, and if it forms a higher low relative to the previous one, we can start looking for potential entry points 🎯
At the moment, price has reached a key zone, so it’s best to wait and observe Ethereum’s reaction before making any move 👀
Patience and timing will be the keys to catching the next big move ⚡
Disclaimer:
This content is for informational purposes only and does not constitute financial or investment advice. © DIBAPRISM
Larry D.Kohn

TradeCityPro | Bitcoin Daily Analysis #209👋 Welcome to TradeCity Pro!
Let's dive into the Bitcoin analysis. The market momentum is bearish, so it's better we make a proper price analysis together.
⏳ 1-Hour Timeframe
Yesterday, Bitcoin made a downward move and was rejected from the peak it created at the 111,365 zone.
📈 The long trigger we had at 111,365 didn’t get activated, and now the price has started its downward movement after breaking the 108,844 level.
🔔 The support level that the price has reacted to is 105,780. The price has hit this level with a very large volume and is reacting to it.
💥 If this level breaks, a huge sell volume will enter the market, and a new downward wave could start.
✨ We will confirm the start of this new wave with a break below the 104,488 level. We can also use the 105,780 and 104,488 triggers as entry points for positions.
✔️ As for a long position, I am currently waiting for this bearish momentum to dissipate before looking for a long trigger.
❌ Disclaimer ❌
Trading futures is highly risky and dangerous. If you're not an expert, these triggers may not be suitable for you. You should first learn risk and capital management. You can also use the educational content from this channel.
Finally, these triggers reflect my personal opinions on price action, and the market may move completely against this analysis. So, do your own research before opening any position.

Bitcoin Daily Analysis – November 03, 2025Welcome back to Bitcoin Daily Analysis 💹
😶🌫️ Bitcoin is currently facing a lot of uncertainty — market conditions have created confusion among both short-term and long-term holders.
In my opinion, we’re in a phase where it’s best to wait and observe how price reacts to this zone 👀.
Personally, I still believe the overall trend remains bullish 🚀 — as long as we don’t see a confirmed breakdown below the 98,000 zone on the daily timeframe, the bullish structure stays intact 📈
Your profit and capital safety depend on your patience and consistency — so stay behind the charts and be ready to catch the next opportunity 🎯
And as always — don’t forget risk and capital management 💼📉
Disclaimer:
This content is for informational purposes only and does not constitute financial or investment advice. © DIBAPRISM
Larry D.Kohn
ETH Weakening Near Support, Big Move Loading?CRYPTOCAP:ETH is currently trading near a key support zone, which has held strong multiple times in the past. The price has been consolidating between this support and the mid S/R zone, showing that both bulls and bears are battling for control.
If ETH manages to break and sustain above the mid S/R zone, we could see a potential upside continuation toward higher levels. However, if the price fails to hold this key support and closes below it, a deeper correction toward the lower support zone could be on the table.
For now, ETH looks weaker day by day, so it’s important to keep a close eye on how the price reacts around this zone, a decisive move could set the tone for the next big trend.
DYOR, NFA

TradeCityPro | Bitcoin Daily Analysis #208👋 Welcome to TradeCity Pro!
Let's take a look at Bitcoin's analysis — the market is still ranging.
⏱ 1-Hour Timeframe
In the 1-hour timeframe, Bitcoin is still below the 111365 level. Today, it moved close to this level once, but it is currently still trading below it.
⛏ Good buying volume has entered the market, while the volume of red candles has been decreasing. In case 111365 is broken, we can open a long position.
🧮 If the price gets rejected from this level, the first short trigger we have is 108844. The next support levels are 107486 and 106319.
📊 Overall, I still believe that as long as the price is between 106319 and 115808, the market movements are temporary and not very exciting. As long as the price stays in this zone, I will open short-term positions and take profit quickly.
❌ Disclaimer ❌
Trading futures is highly risky and dangerous. If you're not an expert, these triggers may not be suitable for you. You should first learn risk and capital management. You can also use the educational content from this channel.
Finally, these triggers reflect my personal opinions on price action, and the market may move completely against this analysis. So, do your own research before opening any position.

TradeCityPro | Bitcoin Daily Analysis #207👋 Welcome to TradeCity Pro!
After a short break, let's get back to the daily Bitcoin analysis. The market is still in a very large range box.
⏳ 1-Hour Timeframe
Currently, Bitcoin is recovering after the drop to the 106319 level and has moved up to 110803.
✅ Today is Saturday, and as you can see, the market volume has dropped significantly. It seems that the market may range until tomorrow afternoon and won't move much upwards, with the main movement starting next week.
⚡️ The triggers we have for opening positions right now are:
For long: 110803
For short: 108844 and 106319
💥 Overall, Bitcoin is in a very large range box between 106319 and 115808, and as long as the price stays between these two levels, I will open my positions with very low risk.
❌ Disclaimer ❌
Trading futures is highly risky and dangerous. If you're not an expert, these triggers may not be suitable for you. You should first learn risk and capital management. You can also use the educational content from this channel.
Finally, these triggers reflect my personal opinions on price action, and the market may move completely against this analysis. So, do your own research before opening any position.

Bitcoin Daily Analysis – October 30, 2025🚀 Welcome to another Bitcoin analysis!
Yesterday, the interest rate was cut by one step, just as everyone expected — and that’s definitely a positive signal for Bitcoin. 💪💰
But why did we see a drop? 📉
The world is still anxious about the U.S.–China tariff situation, and those concerns intensified after Powell’s comments, suggesting the December rate cut isn’t guaranteed.
Right now, the market is in a fear phase 😨 — meaning both good and bad news can move prices sharply.
Stay calm and patient, and don’t let the candles scare you. 🕯️🧘♂️
Overall, conditions still favor a bullish continuation, and unless major negative news comes from the U.S. or China, we could soon start the final leg of this uptrend. 📈🔥
The $106,000–$102,000 zone is showing strong demand, making it a potential entry area — but always manage your risk and capital wisely. ⚖️
Remember: every decision in this part of the market should follow your predefined scenario — never trade emotionally or react impulsively. 🧠💼
Disclaimer:
This content is for informational purposes only and does not constitute financial or investment advice. © DIBAPRISM
Larry D.Kohn

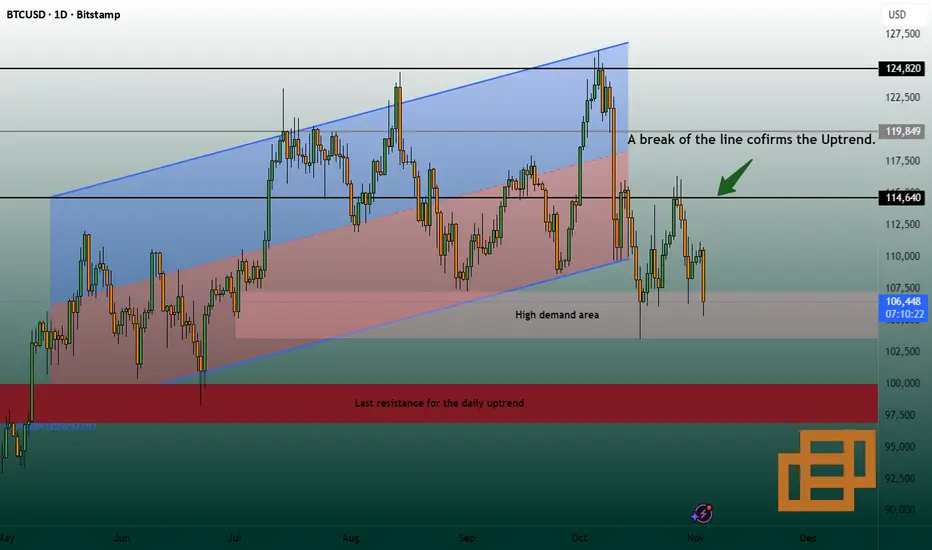
BTC - Bouncing From the Sweet Spot?⚔️Bitcoin is currently sitting at a high-confluence zone , where the daily support perfectly aligns with the lower bound of the ascending wedge. This intersection makes it a prime area to look for potential bullish reactions.
🏹As long as this support holds, I’ll be looking for long opportunities, expecting BTC to push higher within the wedge structure.
The first target for this bullish move lies around the upper bound of the wedge, which conveniently lines up with the supply zone near $122,000, a key resistance to watch.
📉If the support fails, the structure could shift, but for now, bulls still have the technical edge.
⚠️ Disclaimer: This is not financial advice. Always do your own research and manage risk properly.
📊All Strategies Are Good; If Managed Properly!
~Richard Nasr

Bitcoin Analysis - Bulls vs ResistanceBitcoin triggers have been activated just as expected. Personally, I don’t think it’s a bad idea to hold current positions — we’ve got some solid entry points already.
📈 Bitcoin is showing a bullish trend, and as we approach the upcoming interest rate decision, momentum could build even more.
Above the $116,000 zone, we could see a long trigger, but personally, since I already have two open entries from lower levels, I won’t be adding new ones for now.
💡 If the interest rate is lowered, there’s a chance we’ll see a few red candles initially, but overall, it should be positive for the crypto market.
Right now, Bitcoin is facing a key resistance zone — breaking above it could confirm a bullish continuation on higher timeframes. 🚀
Disclaimer:
This content is for informational purposes only and does not constitute financial or investment advice. © DIBAPRISM
Larry D.Kohn

TOTAL2 Elliot Wave BREAKOUT ALERT - Altseason Incoming ? TOTAL2 Elliott Wave BREAKOUT ALERT: Altseason Incoming? 🚀📈
Alright, folks—checking in on the TOTAL2 chart (total crypto market cap excluding Bitcoin) as of Sep 27, 2025. We're sitting at about 1.155T USD after a 6.93% dip.
I've been diving into Elliott Wave Theory here, and it's painting a pretty clear picture.
Quick primer: Elliot Wave ( EW ) is all about crowd psychology driving prices in repeating patterns—5-wave "impulses" for the main trend (usually up in bulls like this), followed by 3-wave "ABC" corrections to reset before the next leg.
Here's how I see it unfolding on this weekly chart:
The Big Rally (Impulse Waves 1-5): Kicked off from the 2022 bear bottom around 200B.
Wave 1: Strong startup climb to ~800B by mid-2023.
Wave 2: Quick zigzag pullback to ~500B—classic shallow correction.
Wave 3: The beast—explosive surge to ~1.4T in early 2024, longest and strongest as EW rules predict.
Wave 4: Flatter, sideways dip to ~800B mid-2024, alternating with Wave 2's sharpness.
Wave 5: Final push topping out at ~1.65T early 2025. Boom—full impulse complete, guided by that blue channel.
Now: The Correction (ABC in an Ascending Triangle): Post-peak, we've entered a 3-wave pullback inside a bullish ascending triangle (rising green support from the A low, flat resistance at ~1.64T, orange line squeezing it).
Wave A: Sharp drop to ~1T mid-2025.
Wave B: Bouncy rebound to ~1.5T.
Wave C: Ongoing downleg—right now midway, testing lower supports around 1T or below.
Where's it heading? I think we're wrapping up this Wave C correction in the next few weeks—could dip a bit more for a final shakeout.
But that ascending triangle screams bullish: Once we bottom and break above 1.64T resistance, expect a breakout thrusting us into the next impulse wave up.
Targets? Could hit 2T+ in a fresh altseason rally, especially if BTC chills and lets alts shine.
Risks: If we smash below the green support, correction drags on—watch out for that.
Stay vigilant, DYOR, and let's ride this wave! 📈
Thanks for reading my idea, let me know your thought !
If you want me to check on any trading pair let me know in the comments bellow and thanks for your support, this motivates me to do more.
