BTC accumulates and recovers.BTC Market Analysis (Short–Mid Term Outlook)
BTC is currently trading around 68,696, moving inside a contracting triangle structure after a strong corrective phase. Here’s the breakdown:
1️⃣ Overall Trend Context
• The higher timeframe trend remains bearish (price below the 200 MA – black line).
• The red MA is acting as dynamic resistance.
• Market structure shows a series of lower highs from the 84K–86K area.
2️⃣ Current Structure
• Price formed a strong V-shaped recovery from the 60K zone.
• Now BTC is compressing between:
• Ascending support trendline (around 66,000 – 66,500 demand zone).
• Descending resistance trendline.
This creates a triangle breakout setup.
3️⃣ Key Levels
• 66,084 → Major short-term demand. If broken, downside may extend toward 64K–62K.
• 71,864 → Mid resistance (liquidity + previous structure high).
• 77,326 → Strong supply zone / higher timeframe resistance.
4️⃣ Bullish Scenario 📈
If BTC holds above 66K and breaks above the descending trendline + 72K resistance:
• Momentum could push price toward 77K supply zone.
• A clean breakout with volume may shift structure to bullish continuation.
Buybtc

BTC recovery - above 90kBTC Daily (D1) – Short Analysis
Bitcoin is in a corrective phase after being rejected from the 95,000–96,000 resistance zone.
Price is trading below the daily EMAs (34/89/200) → EMAs now act as resistance.
Market structure shows a lower high, keeping the short-term bias bearish to neutral.
Key Levels
Support: 88,500 – 89,000
→ Breakdown may lead to 86,000 – 85,500
Resistance: 91,300 – 92,000
→ Stronger resistance at 93,800 – 95,300
Bias
Below 92K: bearish / consolidation
Daily close above 93.8K: bullish recovery toward 96K+
Conclusion: BTC is at a decision zone. The next daily breakout will define the next major move.

Waiting for BTC to break out and recover.BTC Trading Plan – Daily Timeframe
BTC is currently in a corrective phase within a larger downtrend, but signs of a potential base formation are emerging.
Key Technical Context
Price is moving inside a descending channel / falling wedge, often a bullish reversal structure if broken to the upside.
The 93.2K level is a critical breakout line. A confirmed daily close above this level would signal a shift in short-term momentum.
The zone around 100K–102K (purple area) is a major supply / resistance, aligning with the descending trendline and EMA resistance.
Strong demand remains at 83.5K–84K, which is the key downside support.
Trading Scenarios
Bullish Scenario
Daily close above 93.2K → continuation toward 100K–102K.
A clean breakout above 102K would open the path back to higher levels and trend reversal confirmation.
Bearish Scenario
Rejection below 93.2K keeps BTC in consolidation.
Breakdown below 83.5K could trigger a deeper drop toward the 79K region.

BTC recovers, positive at the end of OctoberBTC Daily Analysis
Price recently swept liquidity below the key support zone around 108,000–106,000, forming a clear Liquidity Sweep Zone (LQ Sweep). This move indicates that the market collected stop-losses and liquidity from previous lows before showing a strong bullish reaction.
The recovery from this area suggests a potential short-term reversal as buyers step in to defend the lower trendline of the ascending channel. The confluence between the Liquidity Sweep Zone and the trendline support strengthens the probability of a bullish continuation.
In the coming sessions, if BTC maintains momentum above 110,000–111,000, the next upside targets will be:
First resistance: 115,500–116,000
Major resistance zone: 120,000–122,000
A clean break and retest of the 115,500 zone would likely confirm the continuation scenario toward the upper boundary of the channel near 125,000–126,000.
Summary:
Structure: Bullish reaction from key liquidity zone
Bias: Short-term bullish as long as 108,000 support holds
Targets: 115,500 → 122,000 → 126,000
Invalidation: A daily close below 106,000 would negate the bullish setup

Sweep all liquidity, BTC recoversBTCUSD – Daily Analysis
The recent market move confirmed our earlier sell call at the 126K top, which played out perfectly as price reversed sharply from that resistance zone. This level aligned with the 1.618 Fibonacci extension and the upper trendline — a strong confluence area that signaled exhaustion.
Currently, BTC is rebounding from the support zone around 110K–111K, showing short-term recovery momentum. However, unless price breaks decisively above 121K, the structure still favors a potential retest toward 110K before any larger bullish continuation.
→ Key Levels:
• Resistance: 121K / 126K
• Support: 110K / 107K
• Trend: Short-term corrective uptrend within a broader range
✅ Successfully caught the 126K top — next focus on reaction around 121K zone.

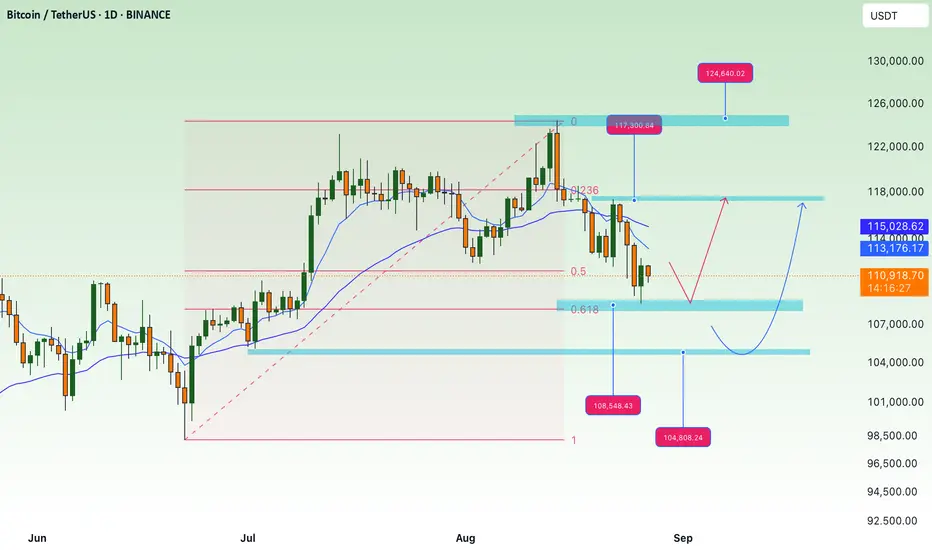
BTC starts to show signs of recovery💎 BTC PLAN UPDATE – START OF WEEK (09/03/2025 )
Mid-week BTC Analysis
Currently, BTC is reacting around the support zone ~111,000 – 110,500 (confluence of EMA200 D1 and 0.5 Fibonacci). This is an important short-term support area; if it holds, a rebound may occur in the next few sessions.
If BTC bounces from this level, it could retest short-term resistance levels at:
• 111,900 – 112,200 (EMA34 + nearest resistance)
• 114,100 – 114,500 (0.382 Fibonacci)
• 116,000 – 117,000 (0.236 Fibonacci + previous strong resistance)
If the 110,500 support is broken, price could easily drop toward:
• 108,400 – 108,000 (mid-term support)
• 104,800 – 105,000 (major support, extended Fibonacci zone)
Trend:
• Mid-term: still in a corrective downtrend.
• Short-term: possible technical rebound from current support zone, with the first target around 114,000 – 116,000.
👉 In summary: Mid-week, BTC is at a critical zone. Holding 110,500 – 111,000 favors a rebound scenario; if this area breaks, downside pressure may extend toward 108K – 105K.

BTC is correcting down, accumulating around 110k💎 MID-WEEK BTC PLAN UPDATE (27/08)
📌 BTC Plan Update
BTC has followed the expected scenario:
We successfully shorted at the 117K resistance zone – where the Fibonacci 0.236 level aligned with a strong previous resistance area.
After that, price dropped sharply to the key support zone at 108K, where we successfully longed thanks to the confluence of Fibonacci 0.618 – EMA200 – and the demand zone.
Currently, price is reacting around the 111K – 112K range. Although it hasn’t broken out clearly yet, this is a signal that the market may gradually start accumulating again.
➡️ The important thing now is to hold positions and patiently wait for stronger bullish signals at the next resistance zones (114K – 117K) to confirm a recovery trend.
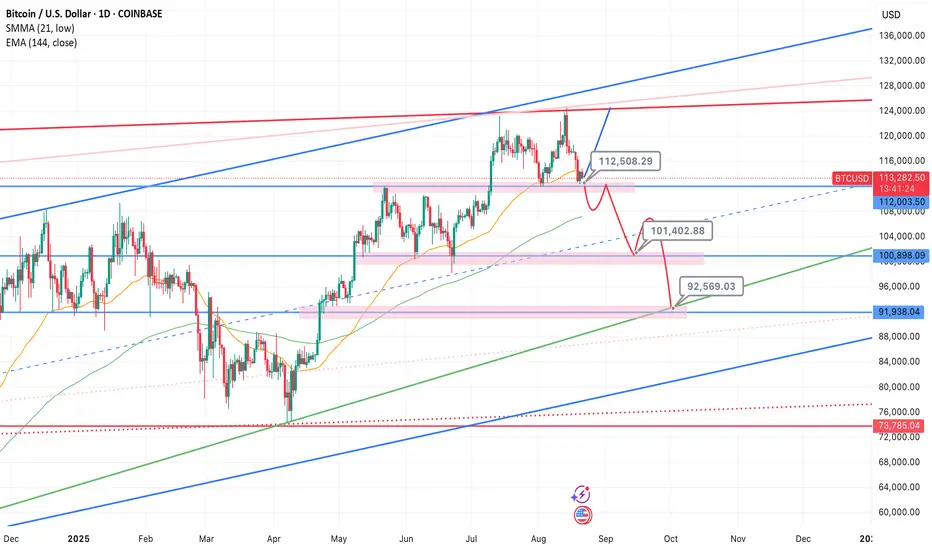
Bitcoin Holds the Line – $112.2K Is Key SupportAccording to on-chain data, BTC’s move to $125K was driven by short liquidations, not new capital inflow, therefore a rejection of highs into further consolidation was expected, after confirming by technical analysis reversal pattern. When rallies aren’t backed by real inflows, the downside tends to be ruthless. After rally printed a new all-time high, then tactical traders triggered a chain of long liquidations.
So the question now is—was this just a flush before a fresh leg up? Or is this market still unwinding?
I remain bullish from current levels. The recent drop looks more like a healthy correction than a trend reversal.
Key Risk:
The bullish scenario breaks if $112,200 support fails and we see a confirmed reversal structure (not just one wick/ short-term candle, but several days of follow-through).
Support Levels to Watch (Buy-the-Dip Zones):
$112,500
$101,400
$92,600
Macro View:
Liquidity signals continue to improve, profit-taking is largely complete, and we don’t see a cycle top yet. Long-term structure remains bullish, and this pullback should be seen as an accumulation opportunity.
Disclaimer:
Markets are subject to unpredictable events and the randomness of markets, please use appropriate risk management. DYOR
Bitcoin showing insane upside to come to $146,942June we were waiting for the brim breakout.
10 July 2025, we got it.
Then it formed a small Pennant formation, testing the brim breakout and then it went above the pattern.
So, now we are en route to the initial target since June.
MAJOR Cup and Handle forming.
Price> 20 and 200MA
Target 146,942
Disclosure: I am part of Trade Nation's Influencer program and receive a monthly fee for using their TradingView charts in my analysis.

continue to increase in price, towards old ATH💎 BTC WEEKLY PLAN UPDATE (11/08)
1. Overall Trend:
BTC has completed a 5-wave Elliott impulse and is currently in a corrective phase after wave (5).
The main trend remains bullish, as the wave structure has not broken and price is still above key EMA lines.
2. Fibonacci Levels:
The current correction may retrace to the following Fibonacci support levels:
• 0.382 Fibo: ~118,800 USD (aligns with strong support)
• 0.5 Fibo: ~117,800 USD (close to EMA and trendline)
These are potential price zones where the market may rebound.
3. Support & Resistance Zones:
• Near-term Support: 118,000 – 117,500 USD (combination of Fibo + EMA + broken trendline).
• Near-term Resistance: 120,000 USD (previous high).
• Next Resistance: 122,000 – 123,000 USD (Fibo extension target 2.618).
4. Main Scenario:
BTC retraces to 118K – 117.5K → rebounds → breaks 120K → moves towards 122K – 123K.
5. Trading Notes:
• Prioritize entries when price reacts well at 118K – 117.5K support zone.
• Stop loss if H4 closes below 117K.
• Stay patient, as corrections are normal before the next upward move.
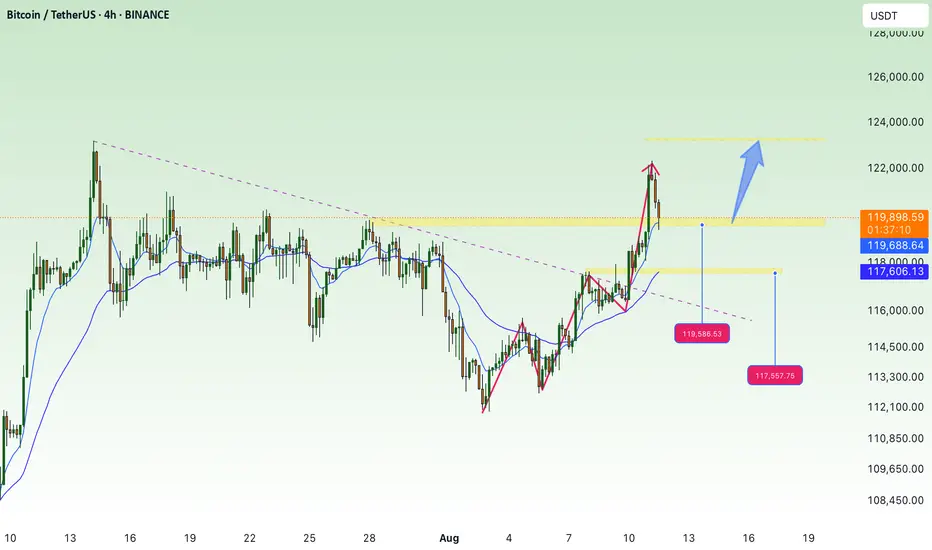
BTC recovers, trying to get back to 120k💎 WEEKEND BTC PLAN UPDATE (08/08)
🔍 BTC Analysis (H4 timeframe):
1. Elliott Wave Structure:
• BTC is following an impulsive wave sequence 1–2–3–4–5.
• Currently in wave (4) and may bounce to complete wave (5) around the ~119,000–120,000 zone.
2. Key Support Levels:
• 116,000–116,200: Support area for wave (4) – can look for buying opportunities here if confirmation signals appear.
• Below that, strong support lies around 115,200–115,600 (confluence of 0.5–0.618 Fibonacci retracement + MA200).
3. Resistance Levels:
• Previous high around 117,500 (Fibo 1.0) is the nearest resistance.
• Wave (5) target: 119,400–120,000 (Fibo 1.618).
4. Trading Plan:
• Buy at 116,000–116,200, SL below 115,600.
• Expected TP: 117,500 – 119,400.”

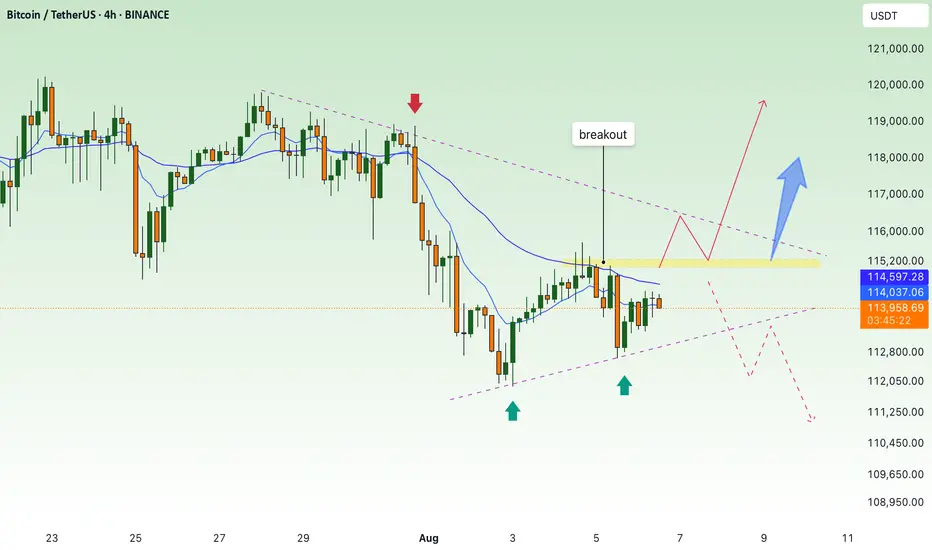
BTC continues to accumulate, waiting for breakout to go up💎 MID-WEEK BTC PLAN UPDATE (06/08)
Brief BTC Analysis – 4H Timeframe:
• Main Trend: Price is consolidating within a descending channel (green diagonal lines).
• Support: The 112,500–113,000 zone has been tested twice and bounced (green arrows).
• Resistance: The 114,800–115,200 zone (purple area) – this is the key level that will determine the next trend.
⸻
Two main scenarios:
🔺 Bullish Scenario (Preferred):
• Price breaks above the 115,200 resistance zone → confirms a breakout from the descending channel.
• Next targets: 116,500 → 119,000.
🔻 Bearish Scenario:
• Price gets rejected at around 115,000 and breaks below the 113,000 support → likely to revisit 110,000.
📌 Key Signals to Watch:
• A clear breakout above 115,200 with volume is a strong buy signal.
• If the price fails to break this zone, consider selling once there is a clear bearish reaction.
BTC accumulates, slightly adjusts down💎 BTC PLAN UPDATE – START OF THE WEEK (04/08)
🔍 1. Current Technical Structure
Price Pattern: The chart shows BTC is forming a falling wedge pattern, with converging support and resistance lines.
False Break: There was a false break below the strong support zone around ~112,000, followed by a sharp rebound. This indicates buyers are actively defending this level, showing potential buying pressure.
Fibonacci Retracement: From the recent low to high, the 0.5 (115,559) and 0.618 (116,361) Fibonacci levels are acting as key resistance zones.
Key Price Levels:
• Strong support: 111,800 – 112,300
• Near resistance: 115,500 – 116,500
• Next resistance: downtrend line and previous high around 118,000 – 119,000
🔄 2. Possible Trend Scenarios
✅ Main scenario (bullish):
BTC made a false break below the wedge → rebounded toward Fibonacci resistance → potential:
• Continue rising to the 115,500 – 116,500 zone
• If it breaks and holds above this zone, BTC could break out of the wedge pattern and target 118,000 – 120,000
• A longer-term target could be the 1.618 Fibonacci Extension around ~123,159
❌ Alternative scenario (bearish):
If BTC fails to break above 116,000 and gets rejected:
• It may retest the 112,000 support zone again
• A breakdown below this support would bring back the downtrend
🔄 3. Bullish Supporting Factors:
• The false break signals a shakeout of weak sellers.
• A potential inverse head-and-shoulders pattern is forming, supporting a bullish reversal.
• Moving Averages (MA): Price is nearing the 200 MA (red) – a possible bullish crossover with shorter-term MAs may occur, signaling a buy.
🧭 Suggested Trading Strategy
• Safe buy zone: Around 113,500 – 114,000 if there’s a pullback.
• Take profit in stages: 116,500 – 118,000 – 120,000
• Stop-loss: Below 112,000 in case of a confirmed breakdown

BTC Accumulation, Bullish Breakout Signs💎 BTC PLAN UPDATE
1. Key Chart Features:
Currently, the BTC/USD price is at $118,893.
The chart shows a strong upward trend recently, and we are seeing accumulation with short-term corrections.
2. Fibonacci Levels:
The Fibonacci retracement levels are drawn from the lowest point ($114,460) to the highest point ($119,809).
At the moment, the price is hovering near the 0.5 retracement level ($113,000), which is a key support level.
If the price holds above this level, a rebound is likely.
3. Trendlines and Price Patterns:
The trendlines (dashed blue lines) are indicating a descending triangle pattern, which could lead to a breakout if the price surpasses resistance levels.
A potential Head and Shoulders pattern might be forming, though it is not yet clear and needs confirmation by breaking key resistance.
4. Breakout and Retest Zone:
The breakout zone (red area) is around $119,000.
If the price breaks and holds above this level, we may see a continuation of the uptrend toward the next target around $122,792 (Fibonacci 1.618 level).
After the breakout, the price might retouch (retest) this support area before resuming the upward movement.
5. Technical Indicators:
• Moving Averages (MA):
• The red MA (long-term) is below the current price, indicating a strong uptrend.
• The yellow MA (medium-term) is near the current price, providing support for the uptrend if it holds.
• RSI Indicator:
The RSI has not yet reached overbought levels, suggesting that the market still has potential to rise without being overheated.
6. Conclusion:
If the price breaks above the $119,000 resistance and maintains that level, BTC/USD could continue its strong bullish trend, potentially targeting $122,792 or even $127,941.
Note: If the price fails to hold above $119,000 and drops back below, a pullback to the nearest support level at $114,460 may occur.

BTC Consolidates Below 119,300 Over the Weekend💎 BTC WEEKEND PLAN UPDATE (26/07)
NOTABLE BTC NEWS
The cryptocurrency market is attempting to stabilize after a wave of sell-offs during Friday’s Asian session, when Bitcoin (BTC) dropped to an intraday low of $114,723. A recovery trend is gradually strengthening, with BTC trading at $115,868 at the time of writing, indicating that buying interest at lower levels may increase in upcoming sessions.
TECHNICAL ANALYSIS PERSPECTIVE
Symmetrical Triangle Pattern
BTC is currently fluctuating within a symmetrical triangle pattern, with converging upper and lower trendlines. This pattern typically signals a strong consolidation phase before a decisive breakout.
Scenario unfolded as planned:
• The price failed to break the resistance zone around $120,000 (previously forecasted as a likely failed breakout zone).
• BTC then dropped sharply to the support zone around $115,000, touching the lower trendline and the potential breakout zone.
• At this level, the price rebounded as expected, indicating strong buying pressure at support.
MA lines supporting the trend:
• The price is currently moving around the 200-day MA (red line), showing that the dynamic support is working effectively.
• The 50-day MA (yellow line) is acting as short-term resistance. If broken, it could support the recovery momentum.
Two potential upcoming scenarios:
🔼 If BTC breaks above the $119,500 – $120,000 zone with strong volume, it may continue to test higher levels around $123,000 – $125,000.
🔽 Conversely, if it faces strong rejection around $119K and turns downward, BTC may retest the support zone at $114,000 – $115,000 once again.
Stay tuned to the channel for the latest and continuous updates on XAUUSD, CURRENCIES, and BTC.

Accumulate BTC over 115K💎 BTC PLAN UPDATE (July 23rd)
NOTABLE NEWS ABOUT BTC
Bitcoin (BTC) and Ripple (XRP) are approaching their all-time highs, while Ethereum (ETH) continues to grow steadily toward the important $4,000 mark. These top three cryptocurrencies by market capitalization are showing signs of a new bullish momentum, supported by strong technical structures and increasing investor interest.
TECHNICAL ANALYSIS PERSPECTIVE
1. Main Trend
The overall trend remains bullish, with a clearly rising price channel (black diagonal line).
However, BTC is currently in a short-term correction phase, consolidating sideways after the recent strong surge.
2. Key Price Levels
🔵 Strong Support Zone: 116,000 – 117,000 USDT
This zone includes the 200-day moving average (MA200), horizontal support, and a previous bottom — making it a decisive area for the short-term trend.
If this zone breaks, BTC could fall to a deeper support area around 111,000 USDT.
🔴 Resistance Zone: 122,000 – 123,000 USDT
This is a previous peak and a recently “false breakout” area — a strong psychological resistance.
If broken convincingly, BTC could surge to the 130,000 USDT zone (Fibonacci extension 1.618).
3. Possible Scenarios
✅ Bullish Scenario:
Price retests the 116,000 – 117,000 support zone and then bounces.
If it breaks through the 122K resistance, the next target is 130,000 USDT.
❌ Bearish Scenario:
If price breaks below MA200 and the 116K support zone → it could drop to the deeper zone around 111,000 USDT.
4. Technical Signals
There is a triangle accumulation pattern (with flat tops and bottoms).
The “false breakout” at the resistance zone shows that buyers are not yet strong enough and a retest of support is needed.
Follow the channel for the latest and continuous updates on XAUUSD, CURRENCIES, and BTC.

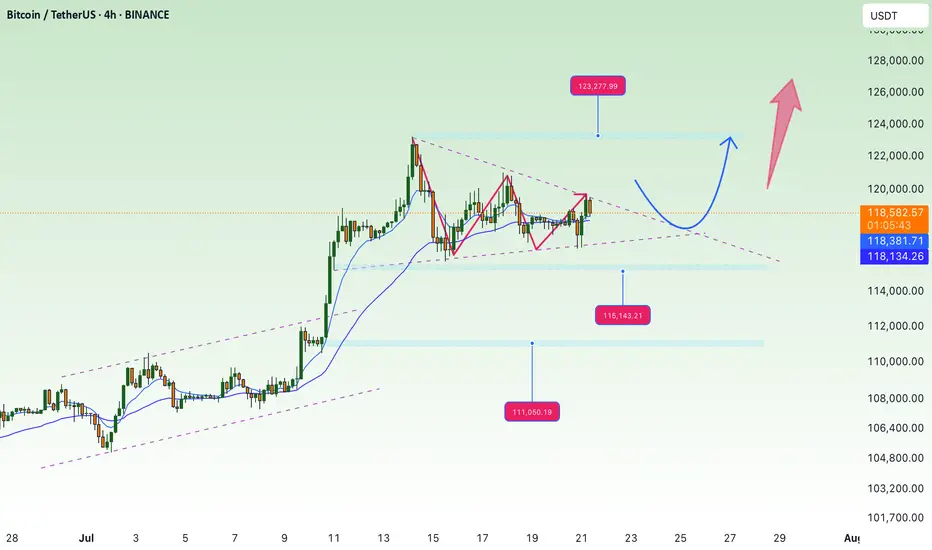
accumulate, continue to aim for new ATH💎 Update Plan BTC (July 21)
Notable news about BTC
CEO of Charles Schwab, Rick Wurster, said the company plans to deploy Bitcoin and Ethereum transactions for customers.
This company aims to compete with Coinbase, where customers buy BTC.
This development takes place after the progress of cryptocurrencies when President Donald Trump signs the Genius bill into law.
In an interview on Friday, the CEO of Charles Schwab, Rick Wurster, said the company plans to launch Bitcoin (BTC) and Ethereum (ETH) to compete with Coinbase cryptocurrencies. The move took place after President Donald Trump signed the Genius bill, officially confirming the first cryptocurrency law in the United States.
Technical analysis angle
🟠 Main trend:
BTC is sideway accumulated in the amplitude of 117,000 - 122,000 after a sharp increase.
The chart shows the descending triangular model - a potential sign for Breakout.
🔍 important areas:
Resist:
122,000 - 122,700: Strong resistance area, fibonacci mold 1.0.
130,600 - 131,100: The expected area if Breakout is successful (Fibonacci extension 1.618).
Support:
116,000: Support close, coincide with EMA 200.
111,100: The support area is stronger if the current support breaks.
✅ Scenario 1 - Rise:
If the price turns from supporting 116k → Test the resistance area of 122k.
If the 122K break is definitive, the next goal is 130k - 131k.
❌ Scenario 2 - Discount:
If the 116k area is lost, the possibility of falling will fall more deeply at 111k.
This is also the strong EMA area Fibo 0.382 of the previous wave.
Please follow the channel to receive the latest and continuous updates on XauUSD, currency and BTC
BTC sideways above 115k💎 BTC PLAN UPDATE (July 17)
NOTABLE NEWS ABOUT BTC
Bitcoin Price Forecast: BTC Recovers as Trump Steps In to Revive Crypto Legislation Momentum
Bitcoin (BTC) saw a mild recovery, trading around $119,000 at the time of writing on Wednesday, after falling nearly 2% the previous day. This rebound followed an announcement by U.S. President Donald Trump on Wednesday morning, stating that the GENIUS Act is ready to be passed by the House during the legislative “Crypto Week”, sparking optimism in the crypto market. Furthermore, institutional demand continues to grow, with spot Bitcoin ETFs recording over $400 million in inflows on Tuesday, extending the growth streak since July 2.
TECHNICAL ANALYSIS
🧠 Pattern Overview:
The chart clearly displays an Elliott Wave pattern (1) → (2) → (3) → (4) → (5) along with Fibonacci Retracement and Extension levels, helping to identify potential support and resistance zones.
1. Elliott Waves:
Wave (3) was completed around the $122,144 zone and the market is currently in the corrective wave (4).
Wave (5) is expected to move upward with targets at:
• 1.618 Fibonacci Extension: ~$127,404
• Or further: ~$130,747
2. Support Zone (grey area below):
Located around $115,000 – $116,000, which is:
• The 0.5 – 0.618 retracement of Wave (3)
• Aligned with the EMA200 and dotted black trendline support.
If the price falls into this area, it’s highly likely to bounce back and form Wave (5).
3. Danger Zone if Broken:
If this support fails, price may fall deeper to:
• $113,200 (0.786 retracement),
• Or even lower: $111,600 – $111,800
4. Potential Scenarios:
Two main outcomes:
• Continued Uptrend: Price bounces from the support zone and heads toward $127,000 – $130,000
• Breakdown: If the support breaks, a deeper decline may occur, breaking the wave structure.
Follow the channel for continuous and up-to-date analysis on XAUUSD, CURRENCIES, and BTC.

FOMO price increase, create new ATH💎 Update Plan BTC weekend (July 11)
Continuously creating a new ATH, preparing to have a short sale?
The reinforcement of Bitcoin price around the upper boundary of the previous consolidation area was broken at $ 108,355, which ended on Wednesday. The price has soared to the highest level of the new time of $ 116,868 on Thursday. At the time of writing on Friday, the price is fluctuating above $ 116,600.
When BTC entered the price exploration regime and if the trend of increasing continues, the price can expand the momentum to an important psychological level of $ 120,000.
Technical analysis angle
Our community has continuously chose the trend of increasing as the mainstream for all previous transactions and currently preparing to welcome 120k as forecast.
The relative power index (RSI) on the daily chart reaches 71, higher than the excess buying 70, showing a sharp increase. However, traders should be cautious because the ability to adjust the decrease is very high due to over -purchase. Meanwhile, the average divergence dynamic indicator (MACD) has shown a price intersection at the end of June. The indicator also shows that green histograms are increasing on neutral zero, showing that the rising momentum is being strengthened and continues to increase.
However, if BTC must be adjusted, the price may extend the decline to search and support around the upper boundary of the unified area that has been broken earlier at $ 108,355.
Plan has been constantly accurate in the past 2 months, which is the positive signal of the channel that brings value to the community.
Please follow the channel to receive accurate scenarios about gold and BTC
==> Comments for trend reference. Wishing investors successfully trading
BTC back to 110K, ATH effortPlan BTC today: 09 July 2025
Related Information:!!!
Cryptocurrencies are trading in a volatile environment driven by tariff-related uncertainties ahead of the release of the Federal Reserve's (Fed) Minutes from the June meeting, scheduled for Wednesday. Bitcoin (BTC) continues to exhibit technical weakness, trading below the key resistance level near $109,000. Trading activity in the spot market remains subdued, with K33 Research reporting a 4% decline in weekly volume to $2.1 billion.
Aside from a few selective rallies, as evidenced by Wednesday’s top-performing tokens, most altcoins are underperforming relative to Bitcoin, reflecting limited engagement from the retail segment. Nonetheless, Ethereum (ETH) is showing early signs of a potential upward move after breaking above the former resistance-turned-support level at $2,600. Ripple (XRP), meanwhile, has extended its recovery above $2.33, posting over 1% in intraday gains.
personal opinion:!!!
Continued efforts by the bulls, breaking ATH above the 110,000 price zone. The time is near for the FED to lower interest rates.
Important price zone to consider :!!!
support zone : 109.200
resistance zone : 109.700
Sustainable trading to beat the market
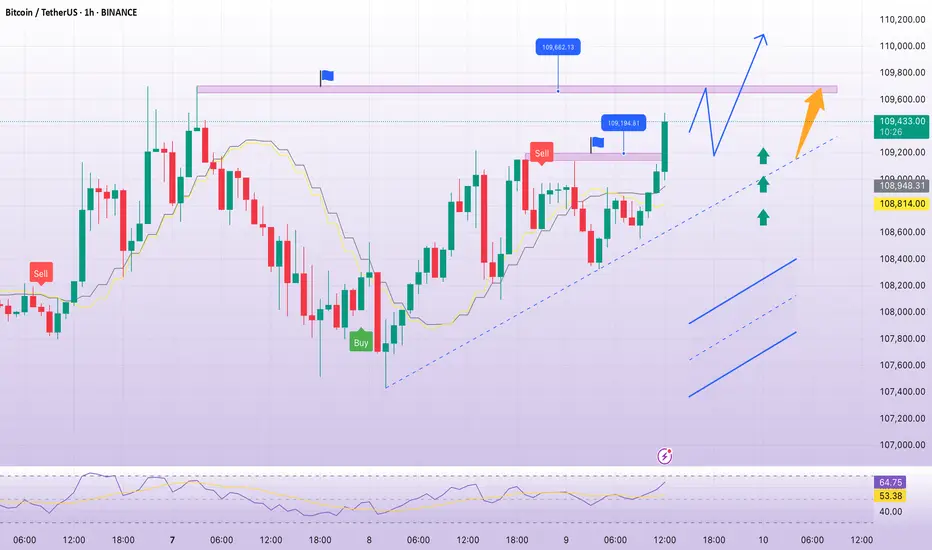
BTC up following H1 trend linePlan BTC today: 07 July 2025
Related Information:!!!
Bitcoin (BTC) trades slightly below $109,000 at the time of writing on Monday, following its highest weekly close on record. Institutional and corporate demand continues to serve as a key catalyst, with Metaplanet acquiring an additional 2,205 BTC on Monday, while US-listed spot Bitcoin Exchange Traded Funds (ETFs) saw over $769 million in net inflows last week.
As market participants assess the latest bullish indicators, focus now shifts to broader macroeconomic developments, including new trade-related headlines and reports suggesting that the administration of US President Donald Trump may extend the current tariff pause until August 1.
personal opinion:!!!
BTC moves sideways in the trend line, trend line support 108,300
Important price zone to consider :!!!
support zone : 108.300
Sustainable trading to beat the market

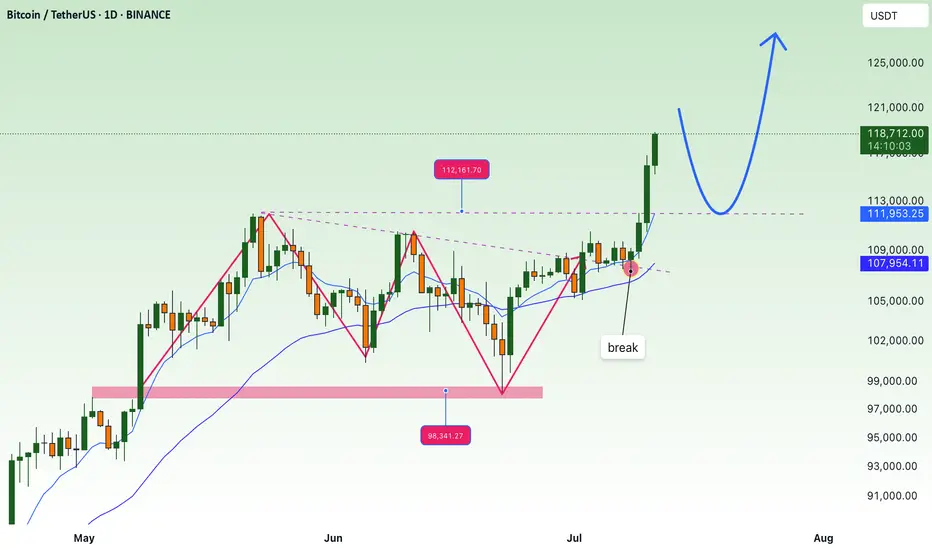
break, BTC soon reaches new ATH💎 Update Plan BTC after NFP (July 3)
Notable news about BTC:
Bitcoin (BTC) recovered to $ 109,000 on Wednesday when the US agreement with Vietnam and the increase in global M2 supply of M2 money has promoted an increase in open interest rates (OI), soaring to 689.78 thousand BTC worth about $ 75 billion. The cryptocurrency market in general has increased the price along with BTC, with leading altcoins, Ethereum (ETH), XRP and Solana (SOL) increased by 7%, 3%and 4%respectively.
Bitcoin, the market cryptocurrency market increased by the trade agreement with Vietnam and M2 money supply soared
The cryptocurrency market has recovered on Wednesday, an increase of 2% to regain the market capitalization of $ 3.5 trillion.
Technical analysis angle
First, congratulate the investors who follow the plan when we previously traded according to the model and had a short signal at 108k and took profit and then Long in the 106k area.
Currently, BTC is in wave 5 and is trapped in the Fibonanci area of 2,618 golden ratio around the price of 109k, this is also the threshold of the price of investors who are under pressure before the price area goes to 112k
The 112k region is a psychological area of profit and will appear on the 109k sales situation before the BTC price may rise further in the last 6 months of the year.
Please follow the channel to receive accurate scenarios about gold and BTC /-Teart /-heart
==> Comments for trend reference. Wishing investors successfully trading

BTC buying power is gradually increasing💎 Update Plan BTC at the beginning of the week (June 30)
Notable news about BTC:
Anthony Pompliano has merged Procap BTC with Columbus Circle Capital I, established Procap Financial - a Bitcoin warehouse company up to $ 1 billion. The company will deploy lending activities, derivatives ... in order to create a collection line from BTC, according to the similar model
Bitcoin price is stable at about $ 107.4K on June 27, before the expiry date of options worth up to US $ 40 billion, capable of causing strong fluctuations. At the same time, on June 29, BTC exceeded $ 108k, up ~ 0.68% compared to the previous day
In the past 7 days, BTC maintained around $ 104–107K despite tensions in the Middle East and the US economic data is not heterogeneous. Reduce slightly but receive support from organized cash flow and global trade progress.
Technical analysis angle
Overview of trends - many signs of increasing
Looking at the candle is signaling "Strong Buy" on many time frames, especially healthy momentum, the ability to breakout $ 116k if surpassed the $ 110k resistance
ETF liquidity and organizational capital flows are supporting the trend of increasing, strengthening the possibility of breakthrough.
Moving Averages:
Frame 1H: 64% Bullish signal (MA20 reversed), but there is a neutral signal from short -term ghosts
Daily/Weekly: Golden Cross (Golden Cross) between 50‑ and 200‑ MA, is a long -term trend increase signal
Oscillators:
RSI frame Daily ~ 55, showing neutral momentum, not too much purchased but there is a rise. Double Rounded Top model on the chart Daily, the current trend is neutral - Bearish if the breakdown supports Neckline ~ $ 106k; In contrast, strong recovery above $ 114k will invalid this model
Long -term / Swing Trade: Keep the position if the price is maintained> $ 106k, use $ 103–104K as a spare hole stop.
Short -term / Scalp Trade: can be in order when the test price is $ 106k–107k, small latches around $ 110k.
==> Comments for trend reference. Wishing investors successfully trading
