Buy On Dippers Beware: The Identify TrapNOTE – This is a post on mindset and emotion. It is not a trade idea or system designed to make you money. My aim here is to help you preserve your capital, energy, and focus so you can execute your own trading system with calm and confidence.
“Buy the dip” has become part of trading folklore.
But for many, it’s not just a strategy, it's a statement of self.
You’ve been rewarded for it before.
You’ve built confidence on seeing value where others saw panic.
Each time it worked, it reinforced a powerful story:
“This is what I do. This is who I am.”
So when price drops, that instinct fires fast.
You tell yourself you’re being disciplined - waiting for the next opportunity.
But often, something deeper is happening.
THE IDENTITY BEHIND THE DIP BUYER
Surface story:
“I’m the one who spots opportunity when others panic.”
“I’m disciplined. I buy when others are afraid.”
It sounds like confidence. But beneath that surface sits a hidden driver…
“I am only good when I’m right.”
“I am valuable because I can see what others can’t.”
“If this doesn’t work, what does that say about me?”
What's going on here is ego preservation .
WHAT’S REALLY DRIVING IT
Emotion: Defiance a need to prove that you know what you’re doing, and that you’re right.
Impulse: Reclaim certainty through action.
Underlying belief: “I know how this game works. I’ve done this before.”
It feels like conviction, but it’s really an attempt to confirm that as a trader you are generally always right. Remember though, markets broadly trend only 30% of the time so the chances of being wrong may be higher.
THE RISK
When markets shift regime, identity-based trading becomes dangerous.
You stop trading what’s in front of you and start defending the idea of you
Overconfidence, stubbornness, refusal to adapt can all be disguised as “discipline.”
The more attached you are to the identity , the harder it becomes to see the reality of what is.
THE REFRAME
Next time you feel the pull to “buy the dip,” pause and ask:
“Am I trading what I see or am I trading what I want to happen?
REFLECTION
If this feels familiar, take a moment to notice what being right means to you.
For some, it’s safety.
For others, it’s significance.
Either way awareness is where change begins.
By the way - since Non Farm is still scheduled to be released tomorrow (10th October) here's a link to the most recent post on preparing your mindset for NFP for anyone that's curious.
I also just noticed after posting this that the there's a great post on buy the dip from TradingView itself - for anyone wanting to get into the technicals a bit more
Buyondip

BSE - BUY THE FEAR, SELL THE GREED !"Buy the fear, sell on greed" is an investment strategy that means you should buy assets when most investors are scared and selling (during periods of fear), and sell those assets when most investors are excited and buying (during periods of greed).
Why does this work?
⦁ When fear dominates the market, prices often drop below their true value because people panic and sell at low prices. This creates opportunities for disciplined investors to buy quality assets at a discount.
⦁ When greed takes over, prices often rise above their real worth because people are eager to buy, hoping for quick gains. This is usually a good time to sell, as the risk of a downturn increases.
How do emotions affect markets?
⦁ Fear leads to panic selling, causing prices to fall further and often locking in losses for those who sell at the bottom.
⦁ Greed leads to speculative buying, driving prices higher and sometimes creating bubbles that eventually burst.
Why is it hard to follow?
⦁ While the idea is simple, it is emotionally difficult to buy when everyone else is pessimistic and selling, or to sell when everyone else is optimistic and buying. Most people act on emotion rather than logic, which is why few consistently succeed with this approach.
Practical example:
During a market crash, negative news and panic cause many to sell at low prices. A disciplined investor who buys during this fear can benefit when the market recovers. Conversely, when markets are booming and everyone is rushing to buy, selling at this point can help lock in gains before a potential correction.
Key takeaway:
This strategy is about removing emotion from investing decisions and taking a contrarian approach—buying when others are fearful and selling when others are greedy—rather than following the crowd. This approach has been used by successful investors like Warren Buffett to achieve long-term success by focusing on value and maintaining emotional discipline.

DBCORP: Positive Trend with Buy Opportunity on DipsNSE:DBCORP : Positive Trend with Buy Opportunity on Dips
NSE:DBCORP is exhibiting a positive trend, but careful attention is needed around key levels due to possible trapped trader zones. A buy-on-dip strategy near support may provide an optimal entry point.
Support Zone: 335 – This is a strong area to consider buying on dips, with the last stop-loss set at 325 for risk management.
Resistance Levels: 375 / 396 – Resistance here could lead to temporary pullbacks. Watch for a breakout above 396 to confirm strong bullish continuation.
Price Action: The stock's behavior suggests some trapped traders, so it's essential to monitor price action closely for false breakouts. A buy-on-dip strategy near the 335 support could offer good risk-reward opportunities if the trend holds.
Disclaimer: I am not a SEBI-registered Research Analyst. This analysis is for educational purposes only. Please perform your own research or consult a financial advisor before taking any trading decisions.

USD/CHCF Possible BUYEven though this pair is inn a strong downtrend... Do we or Did we see strong reversal with tremendous upside from HTF?? I'm waiting for one more confirmation then riding to 95 north!
WHAT ARE YOUR THOUGHTS ARE YOU STAYING SOUTH OR GOING NORTH??

Bullish trend in Coal India | Bullish trade ideaThe trend in the daily chart of Coal India is bullish.
The candle today has closed above the resistance.
We may see 500 levels soon.
Educational purpose only

GE General Electric Company Options Ahead of EarningsIf you haven`t bought GE before the previous earnings:
Then analyzing the options chain and the chart patterns of GE General Electric Company prior to the earnings report this week,
I would consider purchasing the 155usd strike price Calls with
an expiration date of 2024-8-16,
for a premium of approximately $8.50.
If these options prove to be profitable prior to the earnings release, I would sell at least half of them.

MCD: Buy on the dip risk for selling shortThis stock has dipped and slid through its support, which was not a strong support level. There is minimal support nearby. And the support above is now a moderate resistance level.
There was some mild rotation in the Volume Oscillator and Money Flow indicator patterns followed by pro traders selling.
The reversal candlestick pattern failed.
However, the risk for selling short is the retail investors and their investment group gurus advising to buy on the dip.
Today's candle has buy on the dippers in the mix.

Bullish QQQ Long QQQQQQ has long since broken out of its downward sloping resistance. There are a lot of challenges facing the market right now with talk of an imminent recession, fed rate hikes and the like. My sense is that there is still room to go in this rally. Too many are bearish and there is still a lot of cash on the sidelines. Seasonality and the powerful presidential cycle all point to the rally continuing for a while longer. Powell speaks tomorrow and he may try and talk the market down some and admittedly the market is stretched short term. I'm looking too add to QQQ on any pullback.

PRM | Elliott Wave Analysis | B-wave Buy on dip trading setupPrice action and chart pattern trading:
> Falling wedge correction wave with strong breakout uptrend if you didn't catch the first uptrend, here is the setup for buying the dip.
> status MACD dead-crossing the signal line, possible correction is coming.
> 1st Entry @ strong POC support near 6 baht or SMMA25 zone
> 2nd Entry @ falling wedge retest zone about 0.618 retracement
> Target B wave uptrend near 2-wave downtrend or 0.618-0.786 retracement zone also equals to the target of the falling wedge with a + 30-40%% upside.
> Stoploss @ slightly below the 2nd entry zone -10% downside.
> Risk reward ratio: 3:1
Buying the dip is an important strategy you can use to trade the financial market. Apart from the dollar cost averaging and Fibonacci retracement, there are other strategies you can use, including using indicators and using patterns like triangle, ABCD, XABCD, and head and shoulders.
Always trade with affordable risk and respect your stoploss, nothing is 100%.

JUBILANT FOODWORKS - Swing TradeJubliant Foodworks bounced from the support twice and most probably getting ready to fly.
There is a Butterfly Pattern probability on the chart, if unfolds we can see it moving towards 630 and 640 levels in the coming trading sessions.
Type of Trade: Swing Long trade
Build up on the way up
Trade with Strict SL
Price should sustain above 600-605 zone

AUTOAXLES - Long with 7 to 8% ROIAscending parallel channel and Head & Shoulder pattern in hourly time frame
All details are given on chart. If you like the analyses please do share it with your friends, like and follow me for more such interesting breakout charts.
Disc - Am not a SEBI registered. Please do your own analyses before taking position. This post is only for educational purposes and not a trading recommendation.

BANKBARODA - 20% ROIAll details are given on chart. If you like the analyses please do share it with your friends, like and follow me for more such interesting breakout charts.
Disc - Am not a SEBI registered. Please do your own analyses before taking position. This post is only for educational purposes and not a trading recommendation.

Silver M - Wave CHourly 1 2 3 4 5 wave complete
A B also seems done
Wave C in progress
Strong support area 58600-700
Buy at lows
Possible Tgts 60250-62800

LT Sign of reversal - Buy on DipIt seems like it has completed 5th wave in downward channel and given sign of selling exhaustion. it will likely bounce back to 1590 and once it crosses 61.8 level of retracement it will start your journey towards 1700. Can be added on every dip with a stoploss below 1510.

Bitcoin [1Day] best key on 40K.- 42 K.Bitcoin Starts Selling Again with Best Price Target For a buy entry in the 40K - 42K area,
when the price goes down to test the support area until the PA bullish comes,
then enter a buy trade at the support.
SL Below Support
Goodluck
Ton Trader

HDFC BANKChart is forming bullish bat formation entry is already triggered dont jump directly buy close to entry level to maintain R:R

Trend Rider 221. Weekly in uptrend EMA 10 >EMA30 >EMA 200.
2. In H4 starting to form Wave 4 with reversal at 0.618 level. Bullish engulfing candle formed. Above EMA 200.
3. Good FA, Bursa Marketplace rating 9 CTP RM8.02, Isaham 13.1, Fair Value RM10.4, i3 ATP RM8.32.

Trend Rider 211. Weekly starting to make an uptrend with price managed to broke strong resistance at RM3. EMA 10>EMA 30>EMA 200.
2. Daily in wave 4 with reversal at 0.5 level also RBS. Hammer formed followed with strong bullish candle. Price above EMA 200.
3. Bursa Marketplace rating 6 (fund 10) CTP RM2.9, isaham 11.1 FV RM3.14, i3 RM2.78.
4. From isaham score.

Trend Rider 201. Weekly in uptrend EMA 10>EMA30>EMA 200. Starting to make a reversal at 0.618 level.
2. H4 seems like the corrective wave has finished and start to make Wave 1 then Wave 2. Down trendline has also broken. Reversal at 0.382 level with hammer formed then broke. Price action above EMA 200.
3. Bursa Marketplace rating 10 (Fund 10, Value 10, PE 9) CTP RM4.96, Isaham 11.7 WAFV RM5.91, i3 ATP RM4.23.

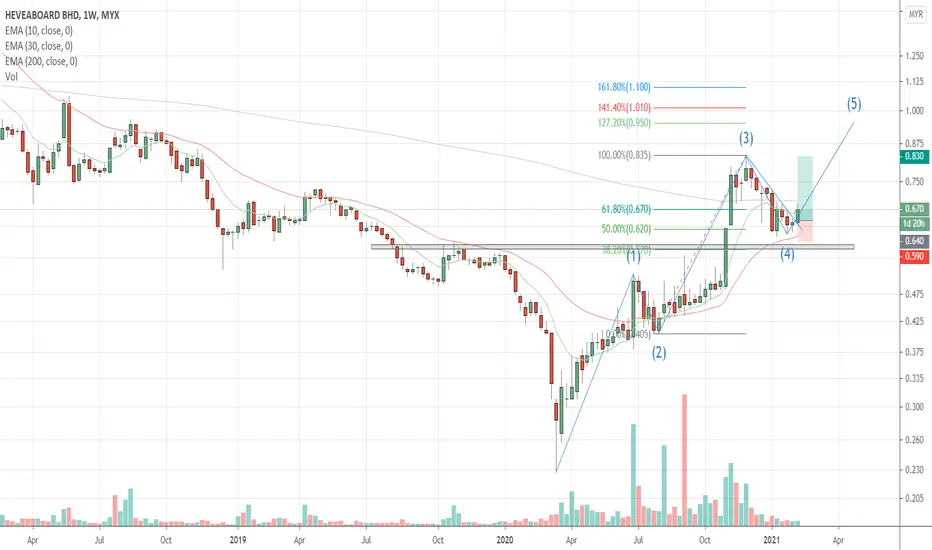
Trend Rider 191. Weekly uptrend EMA 10>EMA 30. Most probably start to make Wave 5.
2. H4 price breakout strong resistance and become support at RM0.8. Retraced to that level and hammer with bullish candle formed confirming the expected reversal (wave 2). Price above EMA 200.
3. Bursa marketplace rating 6 CTP RM0.98 (4 buys), isaham 10.4 (fundamental in red but profitable), i3 ATP RM0.85.

Trend Rider 18.1. Weekly in strong uptrend, EMA 10>EMA30>EMA200.
2. Downtrendline broke at H4 and forming Wave 2 with reversal at 0.382 Fibo level. Price action above EMA 200.
3. Reversal candlestick can be seen at H1 (bullish engulfing).
4. Bursamarketplace rating 7 (Mom 10) CTP RM2.4, isaham 10.1, i3 ATP 2.43.
5. From TRS Screener (D10).

Trend Rider 171. Weekly chart EMA 10>EMA 30 but below EMA 200. Expected to break soon.
2. Now in Wave 4, reversal can be seen at H4 and D1 at level 0.5. Wave 2 reversal at 0.618.
3. Bursa Marketplace rating 8 (Earn 10) target price 0.74, isaham 8.2, i3 ATP RM0.55 (latest RM0.83).
(EL) Trend Rider 151. Weekly in Wave 4 retraced at 0.5 with also RBS. Candlestick reversal signal at D1 and H4.
2. EMA 10>EMA 30. EMA 200 broke.
3. Bursa Marketplace rating 5, Isaham 7.7, i3 ATP none. Oil and gas may not be in theme yet but expected to be soon.
