BUY STOP EURJPY 184+Buy stop , Eurjpy use proper techniques to manage your trades (50/50+Trial Stop)
Buyopportunity

EURJPY RECAPEURJPY has hit all time highs as expected and predicted and gave us a nice long super buy and new prices 184+ more still to come stay tuned and remember to follow to be able trade with us

Solanas first real runThink outside the box, think about how early you are to this game. Black and white t.v, slavery, wifi, ethernet, was all pretty recent if you really think about it. 2026 is a step in the future, with all pillars build and foundations laid since the 2000's, we are geared to see historical moments this next couple years... are you ready?

BUY EURJPY Eurjpy will be buying and not selling due to structural highs that are missing according to price. EXPECTED PRICE:183+

BUY BITCOIN SCALP Btcusd looking to give us a nice clear structural upside push , remember to trial stop and secure profits

PROFIT ON EURJPY Eurjpy smashed take profit correctly , and now we shall wait for more opportunities

ROUTEMOBILE-BUYPlease strictly follow the levels on the chart.
Trigger Target and SL as provided.
For Second Target, carry only 25% of original purchase.

BUY AGAIN EURJPYEURYEN buying to the upside and this is a perfect chance to milk the huge move to the upside and make most of profits
Expected Price : 182.6+

GUJGAS-BUYPlease stick to the levels on the Charts.
Please evaluate risk and loss before entering the position in the Idea.
Please Trigger Target and Stop Loss and do not hold beyond the recommended levels
Extended target could b pursued with 25-50% of initial holding and trailing SL above Cost.

Massive Upside Ahead: Top 5 Stocks With Big 2026 Potential📌 Top 5 Stocks for 2026 (Monthly Chart Setups)
I just published a new breakdown focused on multi-month / multi-year moves — not short-term noise. Using the monthly timeframe, I walk through structure + momentum to find the next potential 2x–10x runners.
Names covered:
• NYSE:ZETA – cup & handle developing, holding key MAs + volume shelf, momentum turning
• NYSE:ONTO – monthly reversal structure + bullish momentum setup building
• NYSE:UNH – “left for dead” reset → reclaim + room back to key MAs
• NASDAQ:ONDS – rounded bottom breakout structure, momentum box intact, multi-target roadmap
• NASDAQ:ADBE – extreme oversold reset, bullish reversal potential from long-term support
Question for you:
Which one has the cleanest monthly setup right now — and what ticker should I chart next?

HINDZINCPlease Check the risk and loss possible before venturing into a BUY.
Please stick to the levels Mentioned and trigger both STOP LOSS and TARGETS.
For Extended Target Holding, Book 50% and hold the rest.

RAILTEL-BUYPlease stick to levels provided on the chart.
Please trigger both SL & Target.
For Second Target carry only 25% of original purchase.

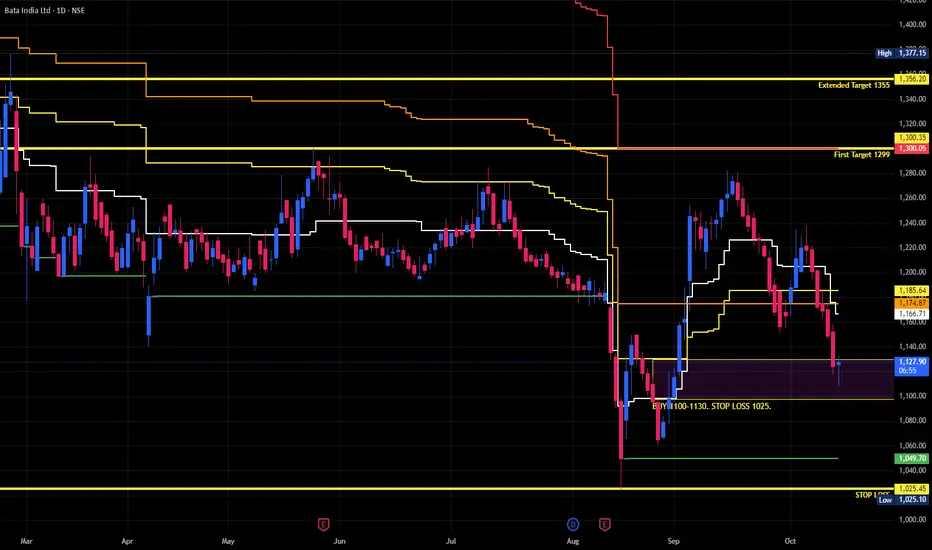
Bata - BUYPlease follow the levels mentioned in the chart.
Please calculate the possible loss and only then venture into the trade.
Please stick to the levels mentioned on the chart.
MMTC-BUYPossible BUY Level. Please follow the levels provided. Please check the risk involved and then take the trade.

LXCHEM-BUYPlease go through the levels provided on the chart.
Please trigger SL and Targets as provided.
Please assess possible loss before entering the trade.


EURJPY SIGNAL Eurjpy looking to buy and will have a nice quick scalp trade towards the upside , can close (50/50)
EXPECTED PRICE : 181.300
CLOSE AT : 181.600

Wait for Nice!I placed an order with 25% cash on the price of $61,800.
After that, we will monitor the trend, volume and behavior of the market around this price.
Let's see what will happen!

$META | COVERAGE INITIATED — Personal Position Update [W49]COVERAGE INITIATED — Bullish Classification (Trend Shift Identified)
META — WEEK 49 TREND REPORT | 12/05/2025
Ticker: NASDAQ:META
Timeframe: W
This is a reactive structural classification based on the weekly chart as of this timestamp. Price conditions are evaluated as they stand — nothing here is predictive or forward-assumptive.
⸻
Author’s Note — Personal Position Update
I initiated my own position on [ NASDAQ:META ] during Week [ 49 ], entering at $ [ 673.42 ].
This decision follows my personal criteria: I only participate when my system identifies a verified structural trend shift supported by both a confirmed weekly flag and a qualifying candle state. This note reflects my activity only and is not a suggestion for anyone else.
As of this update, my position is currently up ~ [ 0% ] from my entry.
My structural exit level is $ [ 670.20 ] on a weekly-close basis. This level will continue to adjust upward automatically as the structure strengthens. If price closes below that threshold, my system classifies the trend as structurally compromised, and that is where I personally exit.
This update exists solely to document my own participation and the structural levels I monitor. It is not predictive and does not imply any future outcome.
⸻
Structural Integrity
• 1) Current Trend Condition [ Numbers to Watch ]
• Current Price @ $
• Trend Duration @ +0 Weeks
( Bullish )
• Trend Reversal Level ( Bearish ) @ $
• Trend Reversal Level ( Bearish Confirmation ) @ $
• Pullback Correction Retracement @ $
• Correction Structural Support @ $
⸻
2) Structure Health
• Retracement Phase:
Uptrend (operating above 78.6%)
• Position Status:
Caution (interacting with structural layers)
⸻
3) Temperature :
Warming Phase
⸻
4) Momentum :
Neutral
⸻
Structural Alignment
NEUTRAL STRUCTURAL CONDITION
This mark represents a period where directional behavior was unclear. Market movement here reflected compression, chop, or indecision — neither trend direction was dominant. It does not signal continuation or reversal, only that price action was not showing strong alignment in either direction.
⸻
Methodology Overview
This classification framework evaluates directional conditions using internal trend-interpretation logic that references price behavior relative to its structural layers. These relationships are used to identify when price movement aligns with the framework’s criteria for directional phases, transition points, or regime shifts. Visual elements or structural labels reflect these internal interpretations, rather than explicit trading signals or preset indicator crossovers. This framework is observational only and does not imply future outcomes.

$PLTR | COVERAGE INITIATED — Personal Position Update [W49]COVERAGE INITIATED — Bullish Classification (Trend Shift Identified)
PLTR — WEEK 49 TREND REPORT | 12/05/2025
Ticker: NASDAQ:PLTR
Timeframe: W
This is a reactive structural classification based on the weekly chart as of this timestamp. Price conditions are evaluated as they stand — nothing here is predictive or forward-assumptive.
⸻
Author’s Note — Personal Position Update
I initiated my own position on [ NASDAQ:PLTR ] during Week [ 49 ], entering at $ [ 181.76 ].
This decision follows my personal criteria: I only participate when my system identifies a verified structural trend shift supported by both a confirmed weekly flag and a qualifying candle state. This note reflects my activity only and is not a suggestion for anyone else.
As of this update, my position is currently up ~ [ 0% ] from my entry.
My structural exit level is $ [ 177.54 ] on a weekly-close basis. This level will continue to adjust upward automatically as the structure strengthens. If price closes below that threshold, my system classifies the trend as structurally compromised, and that is where I personally exit.
This update exists solely to document my own participation and the structural levels I monitor. It is not predictive and does not imply any future outcome.
⸻
Structural Integrity
• 1) Current Trend Condition [ Numbers to Watch ]
• Current Price @ $
• Trend Duration @ +0 Weeks
( Bullish )
• Trend Reversal Level ( Bearish ) @ $
• Trend Reversal Level ( Bearish Confirmation ) @ $
• Pullback Retracement @ $
• Correction Support @ $
⸻
2) Structure Health
• Retracement Phase:
Uptrend (operating above 78.6%)
• Position Status:
Healthy (price above both structural layers)
⸻
3) Temperature :
Neutral Phase
⸻
4) Momentum :
Bullish
⸻
Structural Alignment
NEUTRAL STRUCTURAL CONDITION
This mark represents a period where directional behavior was unclear. Market movement here reflected compression, chop, or indecision — neither trend direction was dominant. It does not signal continuation or reversal, only that price action was not showing strong alignment in either direction.
⸻
Methodology Overview
This classification framework evaluates directional conditions using internal trend-interpretation logic that references price behavior relative to its structural layers. These relationships are used to identify when price movement aligns with the framework’s criteria for directional phases, transition points, or regime shifts. Visual elements or structural labels reflect these internal interpretations, rather than explicit trading signals or preset indicator crossovers. This framework is observational only and does not imply future outcomes.


PLTR — [2D] WEEK 49 TREND REPORT | 12/04/2025PLTR — WEEK 49 TREND REPORT | 12/04/2025
Ticker: NASDAQ:PLTR
Timeframe: 2D
This is a reactive structural classification of PLTR based on the weekly chart as of this timestamp. Price conditions are evaluated as they stand — nothing here is predictive or forward-assumptive.
⸻
1) Current Trend Condition [ Numbers to Watch ]
Current Price @ 178$
• Trend Duration @ +546 Days ( Bullish )
• Trend Reversal Level ( Bullish ) @ 177.54
• Trend Reversal Level ( Bearish Confirmation ) @ 166.16
• Pullback Support @ 133.47
⸻
2) Structure Health
• Retracement Phase:
Uptrend (operating above 78.6%)
• Position Status:
Healthy (price above both structural layers)
⸻
3) Temperature :
Neutral Phase
⸻
4) Momentum :
Bullish
⸻
Author’s Note
NEUTRAL STRUCTURAL CONDITION
This mark represents a period where directional behavior was unclear. Market movement here reflected compression, chop, or indecision — neither trend direction was dominant. It does not signal continuation or reversal, only that price action was not showing strong alignment in either direction.
⸻
Methodology Overview
This classification framework evaluates directional conditions using internal trend-interpretation logic that references price behavior relative to its structural layers. These relationships are used to identify when price movement aligns with the framework’s criteria for directional phases, transition points, or regime shifts. Visual elements or structural labels reflect these internal interpretations, rather than explicit trading signals or preset indicator crossovers. This framework is observational only and does not imply future outcomes.

IRFC-BUYPlease stick to the levels provided on the chart.
Evaluate possible loss before executing the idea.
For Second Target, carry 25% of initial buy.
