JENUARY 27 Bitcoin Bybit chart analysisHello
It's a Bitcoin Guide.
If you "follow"
You can receive real-time movement paths and comment notifications on major sections.
If my analysis was helpful,
Please click the booster button at the bottom.
This is a Bitcoin 30-minute chart.
Shortly, there's a Nasdaq indicator release at 12:00 PM.
On the left, with the purple finger,
I've linked the strategy to yesterday's long position entry point, 87.5K.
*Red finger movement path:
One-way long position strategy
1. $87,276 long position entry point / Stop loss if the green support line is broken
2. $88,691.1 long position first target -> Target prices in order from Gap 8 onwards
88.1K in the middle is a useful long position re-entry point.
For those holding long positions yesterday,
I recommend setting a stop loss if the green support line is broken.
Bottom: Light blue support line -> If the first section is broken,
the bottom: $85,238.3 is the final support line.
Up to this point, I ask that you use my analysis for reference only.
I hope you operate safely, with a focus on principled trading and stop-loss orders.
Thank you.
Bybit

JENUARY 26 Bitcoin Bybit chart analysisHello
It's a Bitcoin Guide.
If you "follow"
You can receive real-time movement paths and comment notifications on major sections.
If my analysis was helpful,
Please click the booster button at the bottom.
This is a Bitcoin 30-minute chart.
There are no Nasdaq indicators released.
*If the red finger moves,
this is a long position strategy.
1. Confirm the first touch of the purple finger at the top
-> Red finger: $87,538.8, long position entry point
/ Stop-loss price if the green support line is broken
2. $89,210.1, long position first target -> Top: second target
If the strategy is successful, 88.6K is the long position re-entry point.
If the top falls immediately without touching the first point,
Long hold at the second point / Stop-loss price if the green support line is broken
From the green support line breakout, the bottom point / sideways market. Below that, the most important support line remains at $85,238.3.
Please note that if this point is broken, a prolonged correction is possible.
Up to this point, I ask that you use my analysis for reference only.
I hope you operate safely, with a focus on principled trading and stop-loss orders.
Thank you.

JENUARY 22 Bitcoin Bybit chart analysisHello
It's a Bitcoin Guide.
If you "follow"
You can receive real-time movement paths and comment notifications on major sections.
If my analysis was helpful,
Please click the booster button at the bottom.
This is a 30-minute Bitcoin chart.
Nasdaq indicators will be released shortly at 10:30 AM and 12:00 PM.
*The blue finger path indicates a short-to-long switching or a long-position waiting strategy. (Two-Way Neutral Strategy)
1. Short position entry point at $90,870.1 above / Stop loss if the orange resistance line is broken.
2. Long position switch at $90,170.2 / Stop loss if the green support line is broken.
3. Long position switch at $92,456 / Stop loss if the red resistance line is broken.
4. Long position switch at $91,612.7 / Stop loss if the green support line is broken.
If the price falls directly without touching the blue finger at the top (90.8K),
Pink finger at the bottom (1st section), $89,335.7.
Long position waiting strategy / Stop loss is the same if the green support line is broken.
If the price falls below that point, it could fall up to two times, so be cautious of Nasdaq fluctuations.
Up to this point, I ask that you use my analysis for reference only.
I hope you operate safely, with a focus on principled trading and stop-loss orders.
Thank you.

JENUARY 21 Bitcoin Bybit chart analysisHello
It's a Bitcoin Guide.
If you "follow"
You can receive real-time movement paths and comment notifications on major sections.
If my analysis was helpful,
Please click the booster button at the bottom.
This is a Bitcoin 30-minute chart.
The Nasdaq has been acting up lately.
As the Nasdaq is undergoing forced coupling,
please pay close attention to its movements.
*Long Position Strategy:
1. Confirm the touch of the purple finger at the top,
and then switch to a long position at $88,784 at the red finger at the bottom.
/ If the purple support line is broken, set a stop loss.
2. $91,612.7 long position initial target -> Top, then Good in that order.
If the strategy is successful, $90,566.3 is the long position re-entry point.
If the upper level falls immediately without touching the first point,
wait for a final long position at point 2. / If the green support line is broken, set a stop loss.
Today's bottom -> $86,977.3
is a major rebound point on the daily Bollinger Band chart.
Also, the orange resistance line at the top is the center line of the 4-hour Bollinger Band chart.
A strong breakout of this area is necessary for a true rebound.
Please use my analysis to this point for reference only.
I hope you operate safely, with a clear focus on principled trading and stop-loss orders.
Thank you.

JENUARY 20 Bitcoin Bybit chart analysisHello
It's a Bitcoin Guide.
If you "follow"
You can receive real-time movement paths and comment notifications on major sections.
If my analysis was helpful,
Please click the booster button at the bottom.
This is a Bitcoin 30-minute chart.
There are no Nasdaq indicators released today.
*Conditional red finger long position strategy.
1. After touching the purple finger once at the top,
$91,069.8 is the entry point for a long position at the bottom.
2. $92,611.2 is the initial target for a long position -> Target prices are Top, Good, and so on.
If the strategy is successful, $91,954 can be used as a re-entry point for a long position.
If the price falls immediately without touching the first purple finger at the top, $90,142.8 is the final long position waiting point at the second section,
and the stop loss is set if the green support line is broken.
If the price falls to section 2,
the possibility of a sideways movement increases, and there is an uptrend line below it. If the Nasdaq falls sharply,
the price remains open at $89,029.6,
and from the bottom, $89,029.6 is where Bitcoin's mid-term pattern is likely to recover.
Please use my analysis to this point for reference only.
I hope you operate safely, with a focus on principled trading and stop-loss orders.
Thank you.

JENUARY 19 Bitcoin Bybit chart analysisHello
It's a Bitcoin Guide.
If you "follow"
You can receive real-time movement paths and comment notifications on major sections.
If my analysis was helpful,
Please click the booster button at the bottom.
Here's a Bitcoin 30-minute chart.
The Nasdaq is closed today.
I developed a strategy centered around the upper Gap 7.
*When the red finger moves,
One-way long position strategy.
1. $92,756.9 is the entry point for a long position. / Stop loss if the green support line is broken.
2. $95,506.9 is the first target price at the top -> Target prices are Good, Great, and so on.
If the strategy is successful, 94.5K is the point where I can re-enter the long position.
If the purple support line holds, a vertical rise is possible.
The first section below is a sideways market.
Below that is the bottom. The gray line is a mid-term uptrend line.
So, if the price holds at section 1 today, it's good for a long position.
Since the Nasdaq is closed,
Bitcoin also seems likely to move sideways.
As per the rule, I followed the trend-following strategy.
Up to this point, I ask that you use my analysis for reference only.
I hope you operate safely, with a focus on principled trading and stop-loss orders.
Thank you.

JENUARY 16 Bitcoin Bybit chart analysisHello
It's a Bitcoin Guide.
If you "follow"
You can receive real-time movement paths and comment notifications on major sections.
If my analysis was helpful,
Please click the booster button at the bottom.
This is Bitcoin's 30-minute chart.
There are no separate indicators released today.
Currently, the 6-hour MACD is forming a dead cross.
I've kept it as simple as possible.
*Long position strategy before and after the purple finger touches the top line
1. After the purple finger touches the first line (autonomous short)
-> Red finger: $95,235.6, long position entry point
/ Stop-loss price if the purple support line is broken
2. $97,512.1, long position first target
-> Target price from the top to 104.7K, sequentially over the weekend
If the top fails to touch the first line and immediately falls,
final hold on the long position at the second line (No.2) / Stop-loss price if the purple support line is broken
From the purple support line break,
Bottom -> Open to $93,555.6. If it falls to this level, the medium-term pattern will be broken again, so it may take a long time to rise.
*The price must not move sideways until the weekend,
and must not fall to the bottom.
It will hit 104.7K strongly and may see new highs starting next week.
Please use my analysis to this point for reference only.
I hope you operate safely, with principled trading and stop-loss orders essential.
Thank you.

JENUARY 15 Bitcoin Bybit chart analysisHello
It's a Bitcoin Guide.
If you "follow"
You can receive real-time movement paths and comment notifications on major sections.
If my analysis was helpful,
Please click the booster button at the bottom.
This is Bitcoin's 30-minute chart.
The Nasdaq indicators will be released shortly at 10:30 AM.
*Before and after the purple finger touches the top,
short->long switching or a long position waiting strategy is used.
(Long Position Strategy)
1. After touching $97,512.1 -> Light blue finger: Switch to a long position at $96,981.9.
/ Stop-loss price if the purple support line is broken.
If the price falls to the first section below, it is an upward sideways market.
2. $99,611 long position first target -> Target prices are Good and Great in that order.
If the purple finger is not touched at the top,
the final long waiting strategy is the second section below.
Stop-loss price is set if the green support line is broken.
If it falls below that level,
Bottom -> Please be careful, as it could drop as low as $93,157.6.
Up to this point,
please use my analysis for reference only.
Please operate safely, adhering to principled trading and stop-loss orders.
Thank you.

JENUARY 14 Bitcoin Bybit chart analysisHello
It's a Bitcoin Guide.
If you "follow"
You can receive real-time movement paths and comment notifications on major sections.
If my analysis was helpful,
Please click the booster button at the bottom.
This is Bitcoin's 30-minute chart.
The Nasdaq indicators will be released shortly at 10:30 AM and 12:00 PM.
*If the red finger moves, this is a conditional long position strategy.
1. After touching the first section of the purple finger at the top (autonomous shorting).
Switch to a long position at $94,634.9 (red finger at the bottom).
/If the green support line is broken, set a stop loss.
2. Long position: $97,733.7 (first target) -> Target prices are set at Top, then Good, in that order.
If the price falls immediately without touching the first section at the top, then set a final long position at Section 2 (possibility of a sideways movement).
If the green support line is broken, the stop loss remains the same.
Currently, the Nasdaq is trending.
Even if the price moves sideways, the strategy appears likely to succeed.
Below the second section,
Bottom -> A drop of up to $92,296.8 is possible.
If the price maintains the blue support line today,
it would be a good option for a long position.
Please note that my analysis is for reference only.
Please use it safely, with a principled trading strategy and stop-loss orders.
Thank you.

JENUARY 8 Bitcoin Bybit chart analysisHello
It's a Bitcoin Guide.
If you "follow"
You can receive real-time movement paths and comment notifications on major sections.
If my analysis was helpful,
Please click the booster button at the bottom.
This is Bitcoin's 30-minute chart.
The Nasdaq indicator will be released shortly at 10:30 AM.
*When the red finger moves,
this is a one-way long position strategy.
1. $89,346.8 is the entry point for a long position.
Stop-loss price is set when the green support line is broken.
(It must be touched before 9 PM,
to complete the 6+12 pattern and trigger an uptrend.)
2. I've marked the wave path with the finger in the middle.
The short-term target price is $90,546 -> $91,516.9.
After re-entering the long position at $90,880,
the target price is in order from Top -> Good -> Great.
If it touches the bottom today,
the mid-term pattern will be broken again,
creating the possibility of further declines. Please be careful.
The bottom section is connected to the uptrend line, so it's best to maintain a long position.
The bottom section is open up to section 1.
Please note that my analysis up to this point is for reference only.
I hope you operate safely, with a clear focus on principled trading and stop-loss orders.
Thank you.

MOST IMPORTANT LEVELS TO WATCH!!This is by far the biggest memecoin launch since #PEPE & #BRETT. Those were the two biggest most recent pumping memcoins.
I believe with the influence and the credibility #TheWhiteWhale has on CryptoTwitter, this will grown to be a 1 billion dollar marketcap project over the next few wekks or months.
Until it gets there we mark the key levels and enter the best trade set-ups.
Calculate Your Risk/Reward so you don't lose more than 1% of your account per trade.
Every day the charts provide new information. You have to adjust or get REKT.
Love it or hate it, hit that thumbs up and share your thoughts below!
This is not financial advice. This is for educational purposes only.

JENUARY 7 Bitcoin Bybit chart analysisHello
It's a Bitcoin Guide.
If you "follow"
You can receive real-time movement paths and comment notifications on major sections.
If my analysis was helpful,
Please click the booster button at the bottom.
This is Bitcoin's 30-minute chart.
There will be two Nasdaq indicator releases at 12:00 PM.
*If the light blue finger moves in a two-way direction, it indicates a short-to-long switching or long-wait strategy.
1. $92,770.5 is the entry point for a short position at the top. Stop loss is set when the pink resistance line is broken.
2. $91,617.2 is the switch point for a long position. Stop loss is set when the green support line is broken.
3. $93,669.3 is the first target for a long position. Target prices are Good and Great in that order.
If the price immediately declines without touching the short entry point at the top, wait for a long position at the first zone.
The stop loss is the same when the green support line is broken.
If the first section breaks,
from Gap 7 at the bottom, the price remains open up to Section 2,
and this section marks the recovery of the medium-term pattern.
Since the daily and weekly candlestick lows have been broken,
there is a risk of further decline,
but if the price maintains the second section, there should be no major issues within the long-term uptrend.
Please note that my analysis is for reference only.
I hope you operate safely, with a clear focus on principled trading and stop-loss orders.
Thank you.

JENUARY 6 Bitcoin Bybit chart analysisHello
It's a Bitcoin Guide.
If you "follow"
You can receive real-time movement paths and comment notifications on major sections.
If my analysis was helpful,
Please click the booster button at the bottom.
This is the Bitcoin 30-minute chart.
There are no Nasdaq indicators released today.
With the MACD dead cross in progress on the 4-hour chart,
the current position is divided into upside and downside.
Note the pink resistance line and purple support line at the top.
In this situation,
I boldly developed a strategy.
In the lower left corner, the purple finger connects the strategy to the long position entry point, $92,527.5, which was entered yesterday, January 5th.
*If the red finger moves,
I'm following the chase buying strategy.
1. Chase buying at $93,744.7 / Stop loss if the green support line is broken.
2. Long position 1st target price at $96,366.3 -> Good, 2nd target price.
From the current position, if 1 -> If the orange resistance line is broken first,
or the purple parallel line is maintained without breaking away,
there is a possibility of a vertical uptrend.
(Since the second section at the bottom is a sideways market, I intentionally set a generous stop-loss level.)
Conversely, if the price fails to touch the purple finger at the first section above the current level, there's a possibility of a decline to the bottom.
The bottom is the final long position re-entry and waiting area.
Below that, the third section is open, so please be careful.
Please use my analysis to this point for reference only.
I hope you operate safely, adhering to principled trading and stop-loss levels.
Thank you.

JENUARY 5 Bitcoin Bybit chart analysisHello
It's a Bitcoin Guide.
If you "follow"
You can receive real-time movement paths and comment notifications on major sections.
If my analysis was helpful,
Please click the booster button at the bottom.
This is a Bitcoin 30-minute chart.
There will be a Nasdaq indicator release at 12:00 PM shortly.
*If the red finger moves,
this is a conditional long position strategy.
1. After touching the first purple finger at the top,
switch to a long position at $92,627.5 / stop-loss if the green support line is broken.
2. At the top, $94,642.8 is the first target price at the top -> Good. Second target price.
(If the Good level is reached, there is a high possibility of a short-term rise to 104.7K.)
Also, if the first target price at the top is touched,
a vertical rise may occur immediately.
If it fails to touch the first target and immediately falls,
wait for a final long position at the second target price at $92,210.9. (If the green support line is broken, the stop-loss price remains the same.)
I've also marked a bottom level of $91,462.8.
If the price falls below this level, the weekly and daily candlestick lows will be broken, so it may take time for the uptrend to resume.
It would be advantageous for a long position to hold until the light blue support line is reached, right?
Please use my analysis as a reference only.
I hope you operate safely, following the rules and maintaining a stop-loss price.
Thank you.

JENUARY 2 Bitcoin Bybit chart analysisHello
It's a Bitcoin Guide.
If you "follow"
You can receive real-time movement paths and comment notifications on major sections.
If my analysis was helpful,
Please click the booster button at the bottom.
This is a 30-minute Bitcoin chart.
There's no separate Nasdaq indicator release.
I was pressed for time today, so I did this in a hurry.
*Long position strategy based on the red finger movement path
1. $88,721.5 long position entry point / Stop loss if the green support line is broken
2. $90,815 long position primary target -> Good, Great, Miracle
Target prices in that order until the weekend
If the price doesn't fall to the red finger entry point,
but touches the first section in the middle,
and then rebounds within the purple support line,
it's a vertical rise (a strong upward movement).
If the price breaks below the light blue support line,
be careful, as further downtrends or mischief may occur.
The price could fall to approximately $87,840.9 on the screen.
The current price has reached the daily Bollinger Band resistance line,
so if the strategy fails, a strong correction is possible.
If the long position strategy succeeds, a strong upward trend is possible even after tomorrow.
Please pay attention to Nasdaq movements from now on.
Please use my analysis to this point for reference only.
I hope you operate safely, with principled trading and stop-loss orders essential.
Thank you.

December 23 Bitcoin Bybit chart analysisHello
It's a Bitcoin Guide.
If you "follow"
You can receive real-time movement paths and comment notifications on major sections.
If my analysis was helpful,
Please click the booster button at the bottom.
This is the Nasdaq 30-minute chart.
Indicators will be released shortly at 10:30 AM and 12:00 PM.
I've made rough predictions about the likely movements.
Whether the red finger or Gap 6 retraces before and after the purple finger touches seems important.
I've applied this directly to Bitcoin.
Here's a 30-minute Bitcoin chart.
Tomorrow is Christmas Eve, and the day after is Christmas Day, so I've covered two days of analysis up to the 25th.
I'll briefly summarize the key points and then move on.
*When the red finger moves,
One-way long position strategy
1. Confirm the purple finger touches once at the top (autonomous short)
Long position entry point at $87,328.6 at the bottom / Stop loss if the green support line is broken
2. If the strategy is successful, utilize the intermediate wave with the pink finger
First target for a long position: $89,398 -> Target prices in order from the top to the top.
If the pink resistance line is not broken from the current position,
it will trigger a vertical decline.
The key question today is whether the Nasdaq will retraceive Gap 6.
Also, if the price touches the first section and rebounds without breaking above the purple support line, it's most advantageous for a long position.
I've set my stop-loss level slightly loosely to the green support line.
If it holds until this point, it will become a safe sideways market.
(Check the MACD dead cross on the 6-hour chart.)
After breaking the green support line, the candlestick pattern can fall to the second section at the bottom.
The price is open to a maximum of 84.5K until the 25th.
If this section breaks, it will represent a double bottom.
Holding the light blue support line at the bottom of the second section will create the conditions for continued upward movement this month.
Please use my analysis to this point as a reference only.
I hope you operate safely, adhering to principled trading and a stop-loss level.
Will there be a Christmas Santa beam?
Have a good year-end and see you on Friday.
thank you

December 19 Bitcoin Bybit chart analysisHello
It's a Bitcoin Guide.
If you "follow"
You can receive real-time movement paths and comment notifications on major sections.
If my analysis was helpful,
Please click the booster button at the bottom.
This is a Bitcoin 30-minute chart.
Shortly, at 10:30 AM and 12:00 PM, the Nasdaq indicators will be released.
At the bottom left, the purple finger indicates the strategy, which follows yesterday's final long position entry point of $84,682.
*If the red finger follows the path, it is a one-way long position strategy.
1. Touch the first point of the purple finger at the top, or even if it doesn't, the red finger indicates the long position entry point at $86,935.2. Stop-loss price if the green support line is broken.
2. $90,815 is the first target for the long position -> Target price is up to Miracle over the weekend.
If the strategy is successful, the top point can be used as a long position re-entry point.
The first point at the top is today's maximum resistance level.
If it touches this point after 9:00 AM tomorrow,
it can ignore the resistance line and continue to rise.
Conversely, if it touches the bottom immediately, a sharp correction could occur, so focus on the 86.9K long position entry point.
Today, it's best to avoid breaking below the light blue support line (bottom) to safely move upward.
Below that, the weekend's lowest support line (2nd) -> double bottom (84082.2 dollars) remains.
If it reaches the double bottom,
unless a very strong rebound occurs,
an additional downtrend could occur next week, so be careful.
(The gray uptrend line is marked in section 2.)
**It's been a while since I've made this fully public.
My daily analysis, which I diligently write, is divided into key support and resistance levels,
and can be utilized in real-time from entry to liquidation.
So, I think it's no different.
Thank you for your support, and I'll make more full public releases in the future.**
Please use my analysis to this extent for reference only.
I hope you'll operate safely, with a strict trading strategy and stop-loss orders.
Thank you for your hard work this week.

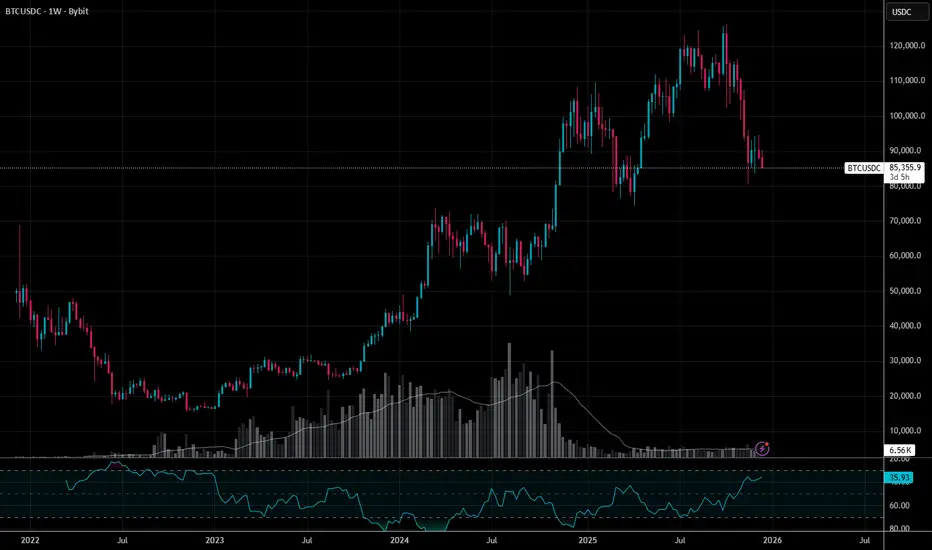
BTC is not A BEAR untilI explore some key levels that would suggest what would mark the beginning to a larger bear move and break of a muti year bullish structure. We also look at the Dec seasonality of December over the life of the trend

Why Reducing Trading Fees Is The Foundation of Risk ManagementMost traders obsess over entries, exits, indicators, and leverage.
Very few obsess over fees .
That’s odd; because unlike your strategy, your psychology, or the market itself, trading fees are guaranteed . They apply to every trade, in every market condition, whether you win or lose.
If risk management is about controlling what you can, trading fees should be the first place to start.
Trading Fees Are a Permanent Tax on Activity
Maker vs taker fees, VIP tiers, and exchange comparisons are well-known topics.
What’s often missed is the cumulative effect:
High-frequency trading multiplies fees rapidly
Lower timeframes amplify churn
Leverage magnifies fee impact on ROI
You can make correct directional calls and still watch profits evaporate simply due to volume-based costs.
Fees don’t care if your trade was “good”.
Why Traders Mentally Ignore Fees
Fees are usually framed as:
“The cost of doing business”
“Small enough not to matter”
“Something I’ll optimize later”
But later rarely comes.
Most traders optimize strategy first and infrastructure las t, even though infrastructure compounds quietly over time.
This is the same reason many traders focus on win rate instead of expectancy.
Referral Codes Aren’t Just Marketing Gimmicks
Here’s an under-discussed mechanic:
Exchanges pay affiliates a share of the trading fees generated by referred users.
Structurally, nothing forces affiliates to keep that commission.
Some setups return a portion of those fees back to the trader as ongoing rebates , effectively lowering trading costs indefinitely ; not as a one-time bonus, but as a permanent modifier.
That makes referral mechanics less about marketing and more about cost structure.
Fee Reduction Is Risk Management, Not Optimization
Reducing fees:
Improves expectancy without changing strategy
Reduces drawdowns during choppy conditions
Increases survivability during high-volume phases
Compounds positively over time
Unlike indicators, it doesn’t introduce noise.
Unlike leverage, it doesn’t increase risk.
It simply removes friction.
Why This Matters More for Active Traders
If you:
Trade frequently
Use algorithmic or semi-automated strategies
Operate on lower timeframes
Manage multiple positions
…then fee drag is one of the largest silent variables in your system.
Ignoring it is equivalent to ignoring slippage or execution quality.
Making Fee Reduction Part of Your Setup
Some traders handle this by:
Reaching higher VIP tiers
Negotiating institutional rates
Using rebate or cashback mechanisms
The key shift is treating fee reduction as infrastructure , not an afterthought.
If you already track risk, exposure, and performance metrics, fees deserve the same level of attention.
Final Thought
You can’t control the market.
You can’t guarantee execution.
But you can control how much friction you accept per trade.
If risk management is about stacking small, permanent edges, then reducing trading fees isn’t optional; it’s foundational.
For those curious about how traders automate fee rebates and make this part of their infrastructure, educational resources exist that break down the mechanics step by step (for example, how Bybit referral rebates work and how they can be applied even after account creation).
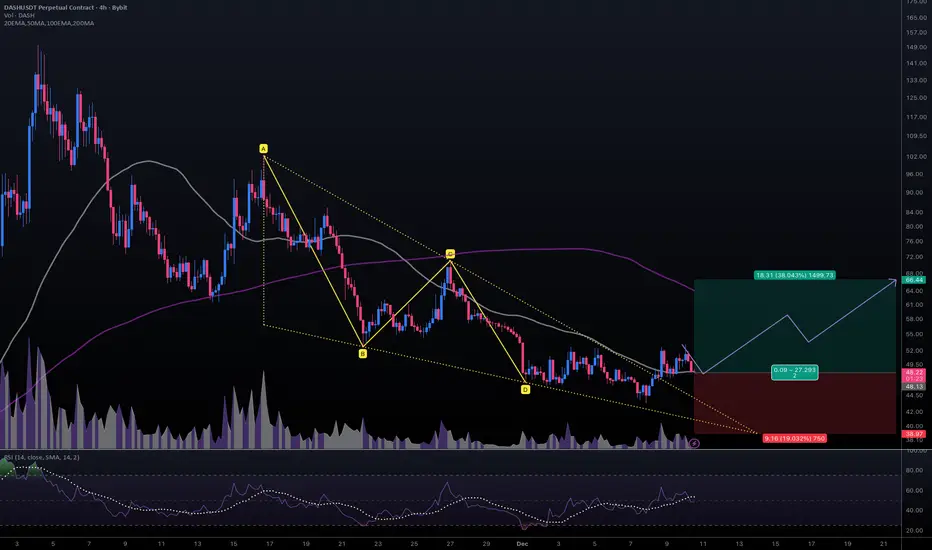
#DASHUSDT #4h (ByBit) Falling wedge breakout and retest [LONG]Digital Cash is pulling back to 50MA regained support where it seem likely to bounce towards 200MA resistance.
⚡️⚡️ #DASH/USDT ⚡️⚡️
Exchanges: ByBit USDT
Signal Type: Regular (Long)
Leverage: Isolated (2.0X)
Amount: 5.3%
Current Price:
48.22
Entry Targets:
1) 48.13
Take-Profit Targets:
1) 66.44
Stop Targets:
1) 38.97
Published By: @Zblaba
CRYPTOCAP:DASH BYBIT:DASHUSDT.P #4h #DigitalCash #Privacy dash.org
Risk/Reward= 1:2.0
Expected Profit= +76.1%
Possible Loss= -38.1%
Estimated Duration= 1-2 weeks
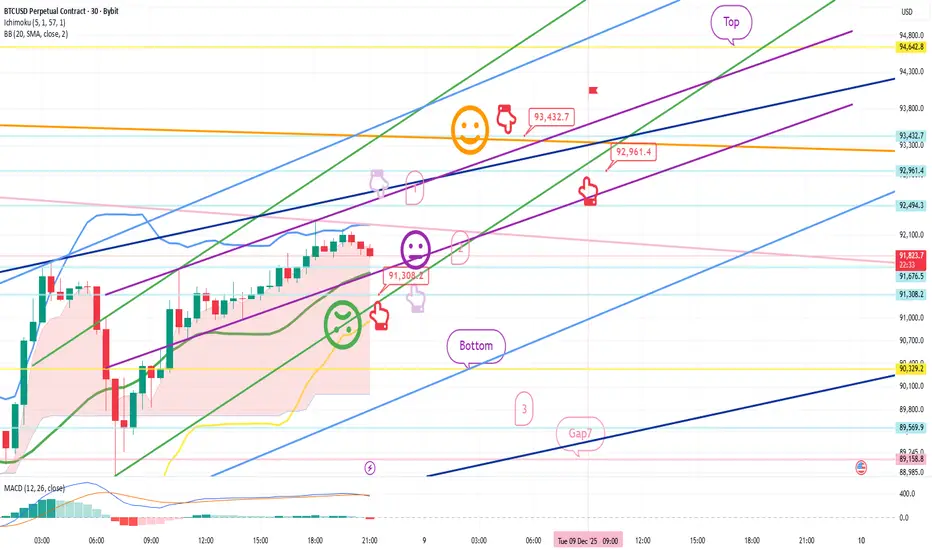
December 8 Bitcoin Bybit chart analysisHello
It's a Bitcoin Guide.
If you "follow"
You can receive real-time movement paths and comment notifications on major sections.
If my analysis was helpful,
Please click the booster button at the bottom.
Here's a 30-minute Bitcoin chart.
There are no separate indicators released today.
I've developed a long position strategy based on Nasdaq movements.
*Conditional long position strategy based on the red finger movement path.
- If the price touches the top once or twice and rebounds within the purple support line, it's a vertical rise.
1. If the price falls immediately without touching the top once, the lower level is $91,308.2, the entry point for a long position. / If the green support line is broken, the stop-loss price is $91,308.2.
2. $93,432.7, the first target price for a long position -> the top is the second target price.
If the strategy is successful, $92,961.4 is the point at which to re-enter a long position.
If the price reaches the top before the 9:00 AM candlestick tomorrow, you can enter a short position and then wait for a long position. (Bollinger Band daily chart resistance zone)
The green support line held tight,
but after breaking out, it opened to the bottom, reaching 3 levels.
Please note that my analysis is for reference only.
I hope you will operate safely, with a focus on principled trading and stop-loss orders.
Thank you.
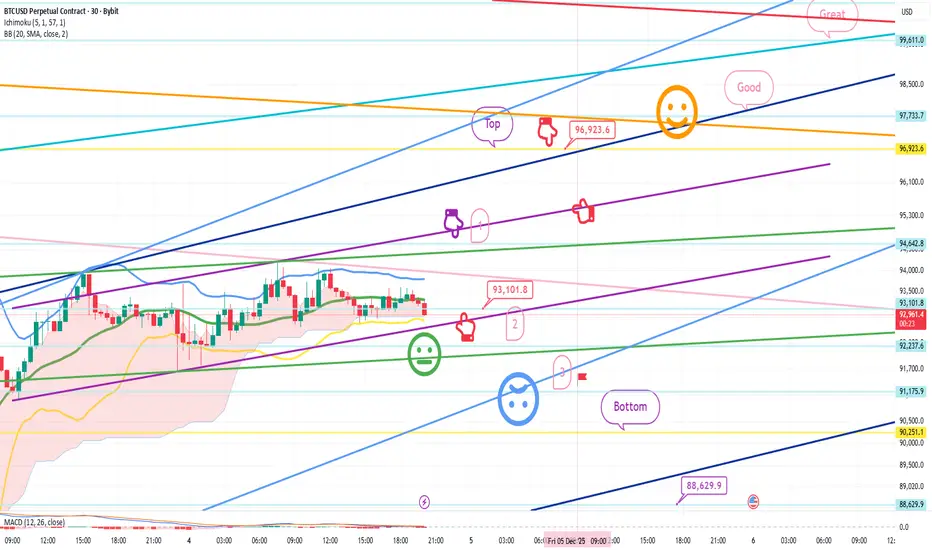
December 4 Bitcoin Bybit chart analysisHello
It's a Bitcoin Guide.
If you "follow"
You can receive real-time movement paths and comment notifications on major sections.
If my analysis was helpful,
Please click the booster button at the bottom.
This is a 30-minute Bitcoin chart.
It's not visible on the screen due to limited space,
but at the bottom, it touched the long position entry point of $83,495.4 on December 1st,
and continues to rise.
The Nasdaq indicators will be released shortly at 10:30 AM,
and I developed today's strategy based on the Nasdaq and Tether dominance patterns.
*Conditional long position strategy based on the red finger's path
1. After touching the purple section once at the top (autonomous short)
Switch to a long position at the red finger at the bottom at $93,101.8
/Stop-loss price if the green support line is broken
2. First target for a long position at the top section at $96,923.6 -> Target prices in the order of Good and Great
Before tomorrow's daily candlestick is created,
if the top section is touched alone,
since it is a resistance line on the Bollinger Band daily chart,
a strong correction is likely.
If the Good section is touched at once,
it is highly likely to be ignored and continue to rise.
If the price drops immediately without touching the first section at the top,
it's a final long strategy in the second section,
and the stop-loss price remains the same.
The third section below is a sideways movement.
If the green support line holds today, a vertical rise is possible after tomorrow.
If the price holds today's light blue support line,
it could lead to a strong upward movement after tomorrow.
Below the bottom, the price is open to 88.6K, the lowest point today.
Please note this.
Please use my analysis to this point for reference only.
I hope you operate safely, adhering to principled trading and a stop-loss price.
Thank you.
BTCUSDT Long: Buyers Defend 91K Zone – Targeting 96K ExpansionHello, traders! The current BTCUSDT price action is developing within a strongly structured bullish environment after a prolonged decline driven by the Descending Channel. Earlier, the market broke down from the upper supply region and continued to move lower while respecting the descending channel boundaries. After reaching a pivot low near the demand zone around 91,000, buyers stepped in, initiating a reversal and shifting momentum to the upside. Following this, Bitcoin formed a clean Ascending Channel that confirmed growing bullish pressure. Price then entered a Range phase, indicating temporary equilibrium before the next impulsive move. After completing this consolidation, BTCUSDT created a clear Head and Shoulders reversal structure near demand, signaling a strong bullish reversal. Buyers took control and pushed price sharply upward, breaking through the range and reclaiming higher structure levels.
Currently, BTCUSDT is trading inside a new Ascending Channel, steadily climbing toward the 96,000 supply level, where sellers previously reacted. As long as price remains above the 91,000 demand zone and continues to respect the ascending channel structure, the bullish scenario remains valid. The next upside target is the 96,000 resistance area, aligned with the upper channel boundary.
My scenario is a continuation toward 96,000 as long as buyers maintain control of the channel. However, a strong rejection from this supply zone may trigger a corrective pullback back toward demand before buyers attempt another move upward. Manage your risk!
