I think BTC will Go DownI think BTC go down to 28500 per BTC , I see MA 25 crossed lines with MA 9 and in SHORT time BTC go down near support resist Candle.
Bybit

RUNE/USDT Wyckoff chart playing out to the downsideYet another simple analysis on what I can see playing out. please like my post if you enjoyed this post and to show your support :)
RUNE /USDT / RUNE /USD Wyckoff chart pattern playing nicely on the Daily. Currently at the SOW(sign of weakness).
Price could dump from here to the next demand zone between $1- $0.76(cents) and ultimately finishing at $0.36(Cents) - could be a perfect short opportunity.
<<<>>>>>>>>>>

Just my 1st ideaJust my 1st idea after a year of TA studies... Any comments are more then welcome...

May 30 BTCUSD Bybit Chart Analysis.
Hello.
“Make it simple, make profit”
It’s BitcoinGuide.
Don’t forget to
“Follow” me and press “Likes”.
If you "follow" press,
Only 30 Min chart ,
In real time, you can check major sections and move,
Real-time "update I dea" can be checked.
I will begin BTCUSD Bybit Bitcoin Chart Analysis for May 30.
This is the movement after writing the analysis on May 27th.
The details are summarized in the comments at the bottom of the analysis article.
Bitcoin 30 Minute Chart
Check the main section with a black finger.
Because of the vote on the 27th, it was a long position strategy.
Green support line Stop Loss / It was a central strategy
Because Bitcoin was in a downtrend
than the Nasdaq on a vertical rise
It ends after a slow, weak rebound.
The sky blue finger section I marked
After entering the long position at $28323,
It is making a profit of $ 1840 up to the Top price.
There was a weekend gap at the bottom.
Until today's Nasdaq early close,
Let's see how it goes.
Nasdaq 4 hour chart
Breaking through the center of the daily peak,
It's on an upward trend.
Today's approximate top price and bottom price are displayed
around the purple support line
Red up / sky blue down movement path check
substituted for bitcoin
Bitcoin 4 hour chart
Today's approximate Top and Bottom prices are displayed.
The difference has widened even to the price of the lower gap.
Please note that it may take up to 2 weeks to return.
There is a case where there is a 5% chance that there is no rebound, and there is a rebound.
In this case, in a large trend,
Sometimes it happens when trends change.
Please note.
Today's green support line
Red up / light blue down movement path check
I made today's trading strategy.
This is a 30-minute chart one-way neutral strategy.
It is a neutral strategy according to the contents of the morning vote.
To be precise, it is a short -> long switching strategy.
If the vertical rise continues from the current position
It is open up to the top price,
If a rebound occurs within the green support line, it is possible to move sideways.
It can take a long time to return the gap at the bottom.
The direction seems to be decided depending on whether or not the orange resistance line is broken.
Because we put weight on the gap return
Even if there is an uptrend from the current position
Start with the red arrow.
Please note that the short position target and long position switching section are bottom sections.
* When the light blue finger moves
Short -> Short -> Long Switching Strategy
Start with the first short / by using the 5-minute trend change
It is safe to start after confirming the touch of the support line.
1. $30626 short position entry section / Stop loss when the purple resistance line is broken
2. Check the rebound from $29400, enter a short position at $29862.5 or keep it short
Stop Loss when breaking the BB30 minute resistance level
3. $28,496 long position switching / Stop loss when breaking the sky blue support line
If you come down to the bottom, you can keep pushing.
Check Nasdaq movement and major support movement
Long position switching
When entering the long position, it is good to do a job alt -> major switch.
It seems okay to try Ripple and Ethereum at the same time.
My analysis is for reference only.
Principle trading / Stop loss is essential, I hope you operate safely.
thank you.

May 27 BTCUSD Bybit Chart Analysis.
Hello.
“Make it simple, make profit”
It’s BitcoinGuide.
Don’t forget to
“Follow” me and press “Likes”.
If you "follow" press,
Only 30 Min chart ,
In real time, you can check major sections and move,
Real-time "update I dea" can be checked.
I will begin BTCUSD Bybit Bitcoin Chart Analysis for May 27.
Bitcoin 30 minute chart.
The details are summarized at the bottom of the analysis on the 26th.
Check the main section with a black finger.
Nasdaq is on a vertical rised.
It is important to see whether the rebound or not in the resistance level is important.
In each of the sections indicated above and below,
Long -> short -> long -> short -> long finish
From the bottom to the purple finger
It was very disappointing that I couldn't touch it with a difference of about 200 dollars.
Only the touched section is exactly round-trip
That's around $1700 in revenue.
In the case of Bitcoin, unlike Nasdaq,
First, there was a vertical decline.
The decline was stronger than expected.
I don't think the intention was to rob it in both directions.
Eventually, it succeeded in a V-shaped rebound,
It has now reached the center line of the 4-hour chart.
Because the turnover rate is faster than the Nasdaq
A strong adjustment is in progress.
I feel like my head hurts today
Let's take a closer look at the whole thing.
Nasdaq 4 hour chart.
Today's approximate Top and Bottom prices are displayed.
around the green support line
Rebound seems to be important.
It has been substituted for Bitcoin.
Bitcoin 4 hour chart
Today's approximate Top and Bottom prices have been left.
centered on the green support line,
The direction seems to be determined.
When the Nasdaq plummets, Bitcoin
The bottom section of the red support line
It's a major rebound.
I made today's trading strategy.
Bitcoin 30 minute chart. This is a one-way long position strategy.
Depending on the Nasdaq's up/down movements, the divergence points.
*Today, the green support line is sideways within the red resistance line.
* When the blue wave is pushed from the support line to the bottom,
This is a major rebound.
The Nasdaq is moving sideways, so keep an eye on the movement.
* When the red arrow moves
Short -> Long -> Short Switching Strategy
Starting with the first long,
1) $29492 short position switching / Stop loss when the purple resistance line is broken
2) $28901.5 long position switching section / Stop loss when deviating from the green support line
3) 30162.5 USD long position target and short position switching section / Stop loss when breaking through the sky blue resistance line
Short if the top price is reached within a short period of time, after tomorrow in the case of upward trend
Adjustments may be weak.
I forgot and forgot the gap section at 6 o'clock, it would be better if you mark each one
Touch up today and within the green support line
It must be supported, and a strong rebound can be linked to altcoins, especially Ethereum.
Today is a long position strategy,
Following the Nasdaq move
Check whether the red top / sky blue bottom
I think you should focus on the long position.
Don't forget to stop loss in principle until today.
Fighting.
Have a nice weekend
thank you.

May 26 BTCUSD Bybit Chart Analysis.
Hello.
“Make it simple, make profit”
It’s BitcoinGuide.
Don’t forget to
“Follow” me and press “Likes”.
If you "follow" press,
Only 30 Min chart ,
In real time, you can check major sections and move,
Real-time "update I dea" can be checked.
I will begin BTCUSD Bybit Bitcoin Chart Analysis for May 25.
Bitcoin 30 minute chart.
Details of the restoration are at the bottom of the analysis on May 25th. I've put it in comments.
Check the main section with a black finger.
Following the Nasdaq movement,
Do not deviate from the green support line.
extreme sideways finish.
Fortunately, there was no breakout from the green support line.
Closed within the red resistance/green support level.
Unlike Nasdaq,
Bitcoin is a condition that can make a strong upward move.
Let's take a closer look at the whole thing.
This is the Nasdaq 4 hour chart.
Today's approximate Top and Bottom prices are displayed.
The overall context looks similar to yesterday.
There are no important indicators to be announced, and it is the end of the month.
I'm guessing it's an approximate right-of-way.
It is a long position strategy centered on the maximum green support line.
It has been substituted for Bitcoin.
(Gap section has been completed to some extent,
It's not important, so I deleted it.)
Bitcoin 4 hour chart.
Today's approximate Top and Bottom prices are displayed.
around the green support line
Red up / sky blue down movement path check
I made today's trading strategy.
Bitcoin 30-minute chart, one-way long position strategy.
I was thinking about how to optimize for the long position today.
When the Nasdaq Is Behaving Strangely
Deviation from the green support line -> to the long position entry section in an ambiguous spot in the light blue finger section
Prepared.
Those who manage it well will watch it and become short -> long, right?
* When the red arrow moves
Short -> Long Switching Strategy
1) $29933 short position switching / Stop loss when the green resistance line is broken
2) $29568.5 long position switching / Stop loss when the green support line is broken
No matter how strong you are today, because of the midline
It is difficult to break through the top section.
Because the Nasdaq may move strangely,
Watching the waves,
*arrow -> long
*Sky Blue Finger -> Long
It seems to work well for you.
The possibility of sideways crossing is high, so keep your hand loss short
Would it be okay to try reverse trading?
I hope you can operate it as a one-shot one-kill.
If it does not deviate from the green line today
Those who are holding the long from the return of the gap, after tomorrow,
This may be the last rice cakes train, so please be patient and watch.
Don't forget to buy in principle / stop loss is essential
thank you.

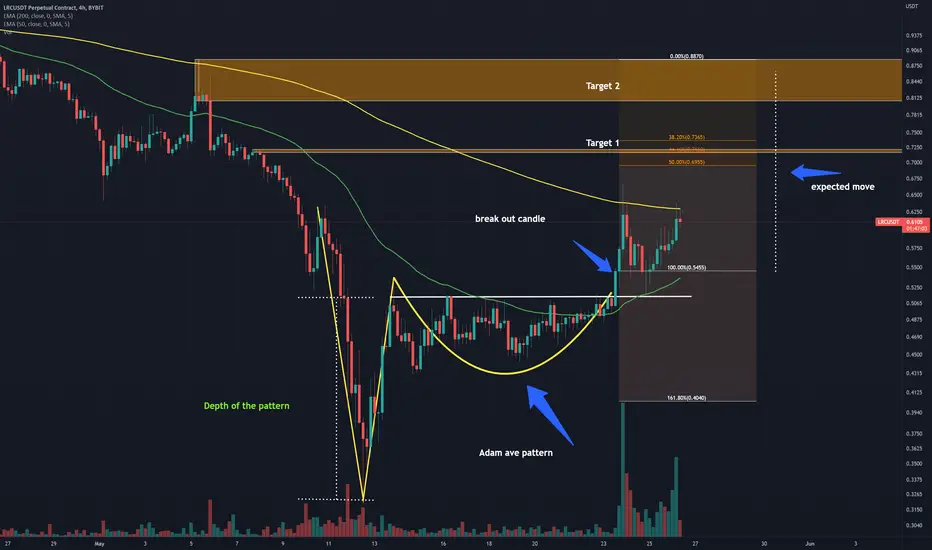
LRC/USDT Adam and Eve PatternLRC/USDT has formed an Adam and Eve pattern. LRC has broken the neck neckline @ $0.51 cents and has retested it before making a move to the upside. Volume is increasing and price action is currently testing the 200 EMA.
Potential move is 61% from the break of the neckline (as indicated on the chart).
TP1: $0.71 -$0.72
TP2: $0.80 - 0.88
Hope you have enjoyed this analysis. Remember nothing is 100% accurate even if you do see this pattern play out. always follow the price action and let the price tell you where the market is heading. Good luck
<<<>>>>>>>>>>
BTCUSD Bybit Chart Analysis May 25
Hello.
“Make it simple, make profit”
It’s BitcoinGuide.
Don’t forget to
“Follow” me and press “Likes”.
If you "follow" press,
Only 30 Min chart ,
In real time, you can check major sections and move,
Real-time "update I dea" can be checked.
I will begin BTCUSD Bybit Bitcoin Chart Analysis for May 25.
Bitcoin 30 minute chart.
More details are at the bottom of the analysis on May 24th,
I put it in a comment.
Yesterday, on a Nasdaq basis, there was a clear split between the upside and the downside.
*Upward Gap + Daily chart MACD Golden Cross
*Downside was a BB 4 6 12 MACD deadcross collapse.
According to the indicator announcement at 1:20,
For a rebound from the current position or a major rebound from the bottom
It was a win.
Red resistance line / green support line
The pole sidewalk has been completed.
Bitcoin is also marked with a black finger in major sections.
Like the Nasdaq,
Finishing the pole sideways without breaking the green support line.
From the 23rd Gap retracement to the breakout of the green support line
Those who are maintaining a long position
You may be making a profit.
or at the green support line,
Those who entered the long position seem to be able to start comfortably.
Let's take a closer look today.
This is the Nasdaq 4 hour chart.
Today's approximate Top and Bottom prices are displayed.
around the green support line
Check the red up/light blue down movement path
In the medium term, the current position
Breakthrough resistance line -> breakout
Or , monthly support line -> major rebound
In case of failure or downward direction,
Please note that it may continue to decline in the month of June.
It has been substituted for Bitcoin.
Bitcoin 4 hour chart
Today's approximate Top and Bottom prices are displayed.
Green support line
Red up / sky blue down movement path check
I made today's trading strategy.
Forgive me for being late.
We decided to proceed with the long-position strategy according to today's voting.
There are many sideways crossings and many branching points.
The headache got worse, so I kept thinking about it and it was late.
Red arrow one-way long position strategy.
The final match was placed on the green support line.
In case of vertical drop, it can go down to the bottom
In today's flow, I marked the danger zone up to the light blue finger.
* When the red arrow moves
Just like yesterday, starting with the first long
A break below the green support line today will result in the strategy failing.
1) $30526 short position switching / Stop loss when the pink resistance line is broken
2) $29368.5 long position switching / Stop loss when the green support line is broken
The final target is $31012.
I didn't mark the short entry place today.
A short position in a vertical downtrend or a downtrend is yours.
You might want to try it yourself.
There is also a retracement of the Nasdaq gap.
Because the pattern is still alive
Today, we challenge the altcoin fire again.
To those who have been holding the long since the 26th, I wish you good luck.
I'll finish it.
Thank you for reading today.

May 25 BTCUSD Bybit Chart Analysis.
Hello.
“Make it simple, make profit”
It’s BitcoinGuide.
Don’t forget to
“Follow” me and press “Likes”.
If you "follow" press,
Only 30 Min chart ,
In real time, you can check major sections and move,
Real-time "update I dea" can be checked.
I will begin BTCUSD Bybit Bitcoin Chart Analysis for May 25.
Bitcoin 30 minute chart.
More details are at the bottom of the analysis on May 24th,
I put it in a comment.
Yesterday, on a Nasdaq basis, there was a clear split between the upside and the downside.
*Upward Gap + Daily chart MACD Golden Cross
*Downside was a BB 4 6 12 MACD deadcross collapse.
According to the indicator announcement at 1:20,
For a rebound from the current position or a major rebound from the bottom
It was a win.
Red resistance line / green support line
The pole sidewalk has been completed.
Bitcoin is also marked with a black finger in major sections.
Like the Nasdaq,
Finishing the pole sideways without breaking the green support line.
From the 23rd Gap retracement to the breakout of the green support line
Those who are maintaining a long position
You may be making a profit.
or at the green support line,
Those who entered the long position seem to be able to start comfortably.
Let's take a closer look today.
This is the Nasdaq 4 hour chart.
Today's approximate Top and Bottom prices are displayed.
around the green support line
Check the red up/light blue down movement path
In the medium term, the current position
Breakthrough resistance line -> breakout
Or , monthly support line -> major rebound
In case of failure or downward direction,
Please note that it may continue to decline in the month of June.
It has been substituted for Bitcoin.
Bitcoin 4 hour chart
Today's approximate Top and Bottom prices are displayed.
Green support line
Red up / sky blue down movement path check
I made today's trading strategy.
Forgive me for being late.
We decided to proceed with the long-position strategy according to today's voting.
There are many sideways crossings and many branching points.
The headache got worse, so I kept thinking about it and it was late.
Red arrow one-way long position strategy.
The final match was placed on the green support line.
In case of vertical drop, it can go down to the bottom
In today's flow, I marked the danger zone up to the light blue finger.
* When the red arrow moves
Just like yesterday, starting with the first long
A break below the green support line today will result in the strategy failing.
1) $30526 short position switching / Stop loss when the pink resistance line is broken
2) $29368.5 long position switching / Stop loss when the green support line is broken
The final target is $31012.
I didn't mark the short entry place today.
A short position in a vertical downtrend or a downtrend is yours.
You might want to try it yourself.
There is also a retracement of the Nasdaq gap.
Because the pattern is still alive
Today, we challenge the altcoin fire again.
To those who have been holding the long since the 26th, I wish you good luck.
I'll finish it.
Thank you for reading today.

May 24 BTCUSD Bybit Chart Analysis.
Hello.
“Make it simple, make profit”
It’s BitcoinGuide.
Don’t forget to
“Follow” me and press “Likes”.
If you "follow" press,
Only 30 Min chart ,
In real time, you can check major sections and move,
Real-time "update I dea" can be checked.
I will begin BTCUSD Bybit Bitcoin Chart Analysis for May 24.
After writing the analysis on May 23rd, this is a movement.
More details are provided in the comments.
Bitcoin 30 Minute Chart
I marked the main sections with black fingers.
The sky blue finger section I marked
From $30338 to $29234 Gap Reversal
Nasdaq goes sideways after Gap retracement
Bitcoin fell strongly until the Gap retracement.
Based on counting, it is making 1113.5 dollars.
It was completed neatly until the gap return,
I'm watching the Nasdaq.
Congratulations to all who made a profit.
It looks like it'll be fun today, so let's take a look at it in general.
This is the Nasdaq 30-minute chart.
As I concentrated, I analyzed this.
Around the maximum green support line
It's a big long strategy.
2, 3 hour chart MACD dead cross is uncomfortable, so please refer to it.
The rationale for the long strategy is
*Upper gap / daily chart MACD Golden Cross / 1:20 indicator announcement.
around the maximum green support line
Even if the indicator presentation is not good, it is upward
In the case of great success, we expect to advance to the Great section.
It has been substituted for Bitcoin.
Bitcoin 4 hour chart.
Approximate top price and bottom price are displayed.
around the green support line
Check the red up/light blue down movement path
I made today's trading strategy.
This is a 30-minute chart one-way long position strategy.
6 hour chart MACD dead cross is pressing
It's not a very dangerous sign.
While walking sideways, check the possibility of being engraved.
According to the pattern, it should fall one more time, but
only focused on the Nasdaq movement.
30 minutes 1 hour 4 hours Because the luck is thin
It is a strategy for the possibility of rising without adjustment.
The variable is today's Nasdaq indicator release or
The Nasdaq could be on a downtrend from the current position.
Pay attention to the bottom section, the finger at the bottom.
* When the red arrow moves
Long -> Short -> Long Switching Strategy
Start with the first long
1) $30489 short position switching section / Stop loss when the green resistance line is broken
2) $29117.5 long position switching section / Stop loss when deviating from the green support line
If only the purple parallel support line does not break today
There is a possibility that it will rise to the top section, so please keep that in mind.
If the strategy is successful
Altcoins can become a sea of fire,
For spot exchanges, pay attention to the timing of entering long positions and the movement of Nasdaq.
My analysis is for reference only.
Principle trading / Stop loss is essential, I hope you operate safely.
thank you.


May 23 BTCUSD Bybit Chart Analysis.
Hello.
“Make it simple, make profit”
It’s BitcoinGuide.
Don’t forget to
“Follow” me and press “Likes”.
If you "follow" press,
Only 30 Min chart ,
In real time, you can check major sections and move,
Real-time "update I dea" can be checked.
I will begin BTCUSD Bybit Bitcoin Chart Analysis for May 23.
After the final finish on May 20th, this is a move.
The details are summarized in the comments at the bottom of the analysis on the 20th.
please note.
Bitcoin 30 minute chart.
I marked the main sections with black fingers.
in the final finish
Can't break the orange resistance line
It followed the Nasdaq and started to decline at the same time.
Likewise, it went down to near the Bottom.
First, starting with a long at $30034.5,
Achieved $241 profit section,
We expected an upswing aggressively, but it was a short stop loss.
In the downward wave, in the light blue finger movement path,
Achieved 1143 dollar profit zone.
At the bottom, there was a gap of 29246.5 dollars.
Same as Nasdaq, about the gap section below
It seems important how the reversion will proceed.
I'll take a look at it in its entirety.
This is the Nasdaq 4 hour chart.
The 4-hour chart MACD Golden Cross is in progress.
It can be connected up to 6 hours -> daily chart.
The important part is the gap section at the bottom.
When ascending directly from the current position,
There may be a fall again in the early morning hours.
It is good to touch in advance, and it is quick and the rebound is connected.
Because most gap rollbacks occur,
It's a plan to focus on getting back.
around the purple support line
Check the red up/light blue down movement path
It has been substituted for Bitcoin.
Bitcoin 4 hour chart.
The probability of gap reversal is greater than 95%.
A rebound from the current position is highly likely to decline again in the future.
If the gap section is not reached
There are times when trends change.
For chart analysts,
You should choose the direction with the highest realistic possibility.
There doesn't seem to be any important announcements today.
around the green support line
Red up / light blue down movement path check
I made today's trading strategy.
This is a 30-minute chart one-way short position strategy.
To be precise, it is a long -> short -> long switching strategy.
Because the gap between the bottom and the bottom is large
If today's trend does not die, until this week until the gap section
A reversal is likely.
In Bitcoin
Considering various conditions, it is also a condition for vertical rise, but
In the end, I followed the Nasdaq movement, so I went with a short position strategy.
If it's not a rebound, it looks like it's going to come down eventually.
* When the red arrow moves
Long -> Short -> Long Switching Strategy
On condition that it does not deviate from the purple support line
I started with a long one from my current position.
1. $31059 short position entry section / Stop loss when the purple resistance line is broken
2. $29193.5 long position switching / Stop loss when breaking the sky blue support line
Because the Nasdaq movement is so bizarre,
It is not easy to understand the flow even in Bitcoin.
From now on, the gap retracement must be progressed to some extent before proceeding with the long position strategy.
As the Nasdaq rises,
It is not possible to construct a downward channel.
Please note that there is a very low possibility that it can ignore the gap retracement and rise.
(Uptrend Reversal)
I hope that you operate safely as a principle of trading/stop loss is essential.
thank you.

May 20 BTCUSD Bybit Chart Analysis.
Hello.
“Make it simple, make profit”
It’s BitcoinGuide.
Don’t forget to
“Follow” me and press “Likes”.
If you "follow" press,
Only 30 Min chart ,
In real time, you can check major sections and move,
Real-time "update I dea" can be checked.
I will begin BTCUSD Bybit Bitcoin Chart Analysis for May 20.
This is the movement after the analysis on the 19th.
More details are at the bottom of the analysis on the 19th.
Please refer to the comments, as I have summarized them in detail.
Above is the Bitcoin 30-minute chart.
I marked the main sections with black fingers.
According to the Nasdaq movement,
I thought it would end after a moderate rebound.
Without any adjustments, it was finished with a weak rebound.
It was a short -> long -> short strategy.
in case of bitcoin
There were no danger signs.
When the Nasdaq was closed, it rose one more time.
It's very difficult to match the timing with the Nasdaq haha
Still, I'm happy to support you and make a comeback.
Estimated price Top price was exactly finished.
Strategically indicated,
It broke the pink/purple resistance line but took a short stop loss.
Let's take a look at the Nasdaq movement as a whole.
Nasdaq 4 hour chart.
Today's highlight is the imprint of the 12-hour chart MACD dead cross.
Nasdaq is such a weird stock.
By forcing an uptrend,
Remember, you can go up to 12 hours resistance.
If it is normal, after the 12-hour chart MACD dead cross is engraved,
There should be a rebound.
Today's approximate top price and bottom price are left.
Check the red up/light blue down movement path
It has been substituted for Bitcoin.
Bitcoin 4 hour chart.
Today's approximate Top and Bottom prices are displayed.
around the purple support line
Red up / sky blue down movement path check
I made today's trading strategy.
(If it was within the normal range that did not follow the Nasdaq
I think I would have bravely fought with the purple support line.
Because of the variable, it is safely a green support line.)
This is a 30-minute chart one-way long position strategy.
just in case ,
In preparation for the Nasdaq variable, the sky blue finger is hidden.
If the pattern is within the normal range
Do not break the purple support line.
The biggest anxiety factor is when it is pushed down.
I couldn't touch the resistance line on the 4 hour chart.
It can be pushed up to the green support line.
Please note.
Today is an aggressive strategy.
* When the red arrow moves
Long -> Short -> Long Switching Strategy
1) $30034.5 long position entry section / Stop loss price when departing from purple support line
2) $30907 short position switching / Stop loss when the purple resistance line is broken
3) 30438.5 USD long position switching / Stop loss when the purple support line is broken
Today, I organized it to a moderately strong right-hand side.
Gap futures market closing price check
When the top is broken, the blue resistance line becomes the maximum target until the weekend.
If the Nasdaq 12-hour chart MACD dead cross is engraved, it is about the sky blue finger section / green support line hand loss.
Will it work?
Don't forget to buy in principle / stop loss is essential
Have a nice weekend.
thank you.

May 19 BTCUSD Bybit Chart Analysis.
Hello.
“Make it simple, make profit”
It’s BitcoinGuide.
Don’t forget to
“Follow” me and press “Likes”.
If you "follow" press,
Only 30 Min chart ,
In real time, you can check major sections and move,
Real-time "update I dea" can be checked.
I will begin BTCUSD Bybit Bitcoin Chart Analysis for May 19.
After final finishing,
Bitcoin 30 minute chart.
More details are at the bottom of the analysis on the 18th.
I've compiled it, so please take a look.
I marked the main sections with black fingers.
Following the Nasdaq movement,
Can't break the orange parallel line resistance
Finished after falling.
* Light blue finger movement path,
At 9:40 as indicated
29835.5 dollars short position entry section / 1236 dollars profit section so far.
It was not an unconditional, long strategy,
It was a short -> long switching strategy.
The fortunate part of the misfortune is
If it followed the Nasdaq and went down, the bottom section may have been broken.
So far, they have supported me well without any major departures.
I thought my strategy was perfect.
After all, it seems that the existence of Nasdaq is not easy.
The war on the Nasdaq never ends
I won't give up.
I'll take a look at it in its entirety.
This is the Nasdaq 4 hour chart.
Yesterday there was a BB 4 and 6 hour MACD deadcross.
Currently, only 12 hours of deadcross are left.
Yesterday I did not touch the resistance line for 4 hours.
Because it was engraved from a downswing dominance to a 6 hour dead cross
A strong drop occurred,
With only the previous low unbroken, there are 12 hours of dead cross left.
Approximate top price and bottom price
around the green support line
Check the red up/light blue down movement path
It has been substituted for Bitcoin.
Bitcoin 4 hour chart.
Today's approximate Top and Bottom prices are displayed.
around the green support line
Red up / light blue down movement path check
I made today's trading strategy.
This is a 30-minute chart arrow , one-way long position strategy.
The 12-hour chart failed to serve as a support on the Nasdaq.
30 minutes / 1 hour chart After thinning the good luck -> Down wave proceeds,
If the 12-hour chart MACD dead cross is imprinted and there is a strong decline,
It can be a light blue finger movement path today.
Apart from that, the Nasdaq is holding up well until tomorrow.
12-hour chart MACD Dead Cross is the best if it is engraved
If it was actually engraved, I made 4 6 12 Dead Cross yesterday.
It would have broken the previous low, but it is a psychologically confusing place in various ways.
If your brain is complicated, analysis is difficult.
I've kept it as simple as possible.
* When the red arrow moves
Short -> Long Switching Strategy
Today, I actually focused on the movement path to aim for perfection.
Please be mindful of the small waves.
largely
1) $29627.5 short / Stop loss when the pink resistance line is broken
2) $28319 long position switching / Stop loss when the green support line is broken
The final target will be the Top price, a strategy that sideways ignores.
It's a hard-hit Nasdaq low.
I have no intention of making an ignorant short strategy.
It's difficult, but I'll work hard on the rebound section
If you are here, I will never give up
Don't forget to buy in principle / stop loss is essential
Thanks for reading.

May 18 BTCUSD Bybit Chart Analysis.
Hello.
“Make it simple, make profit”
It’s BitcoinGuide.
Don’t forget to
“Follow” me and press “Likes”.
If you "follow" press,
Only 30 Min chart ,
In real time, you can check major sections and move,
Real-time "update I dea" can be checked.
I will begin BTCUSD Bybit Bitcoin Chart Analysis for May 18.
This is the movement after writing the analysis on May 17th.
The details are summarized in the comments at the bottom of the analysis article,
Please note.
Bitcoin 30 Minute Chart
I marked the main sections with black fingers.
Looking at the Nasdaq,
Up and down points along the Nasdaq
Pole sideways finish without touch.
The transaction was processed as a cancellation process.
The direction seems to be coming out this week,
Let's take a closer look at the whole thing.
This is the Nasdaq 4 hour chart.
Today's approximate top price and bottom price are left.
in a pattern
In case of an uptrend, up-ward sideways
at the top of the , The dark blue resistance line is the resistance level that has not broken through the past 8 weeks.
If it breaks through, it can be connected to Real Rebounds , right?
I couldn't touch the 4 hours resistance line.
Fortunately, there is a support line coming up at the bottom.
Except in the case of a vertical decline
There are no red flags and no important indicators.
around the purple support line
Check the red up/light blue down movement path
Applied to Bitcoin.
Bitcoin 4 hour chart.
Today's approximate Top and Bottom prices are displayed.
around the green support line
Check the red up/light blue down movement path
I made today's trading strategy.
This is a 30-minute chart long position strategy.
As you can see, at the purple support/green support level.
The direction will be different.
Pay attention to the arrow or the light blue long position entry section.
It is based on the 4-hour chart MACD dead cross.
Above all, the movement of the Nasdaq is the most important.
In the case of extreme lateral protection, within the red resistance line / within the green support line.
Please note that there may be crossing over.
Today, there is no vertical downtrend or a breakout from the sky blue support line.
If the rebound is moderate, there may be further upside after tomorrow.
* When the red arrow moves
Long -> Short -> Long Switching Strategy
If you look for the price on the right, the main position is
It's not difficult, so take it easy.
If the green support line is damaged or breaks away,
You have to watch up to the bottom section.
Since it is a short position operation section on the Nasdaq, there is a possibility of a collapse.
from the present position,
*If there is a rebound, start with the short at the top.
*If it is pushed down, it seems advantageous to wait long in the bottom section.
Check the arrow movement path / light blue finger movement path movement.
I've been leading you all the way here.
If the rebound is successful at the time of entering the long position
It can be the altcoin floor in the upper or lower part, so please keep an eye on it today.
Principle trading / Stop loss is essential, I hope you operate safely.
thank you.

May 16 BTCUSD Bybit Chart Analysis.
Hello.
“Make it simple, make profit”
It’s BitcoinGuide.
Don’t forget to
“Follow” me and press “Likes”.
If you "follow" press,
Only 30 Min chart ,
In real time, you can check major sections and move,
Real-time "update I dea" can be checked.
I will begin BTCUSD Bybit Bitcoin Chart Analysis for May 16.
After writing the analysis on May 13th, this is the Bitcoin movement.
The details are summarized in the comments at the bottom of the analysis article.
I marked the main sections with black fingers,
Apart from the Nasdaq, there is no big wave,
The sidewalk was completed by the weekend.
There is no separate entry seat, so cancellation proceeds.
This is the section before the gap retracement.
Nasdaq is all over the touch of the resistance line on the 4-hour chart
Bitcoin is the period after the 4-hour resistance line touch.
30 minutes / 1 hour chart In the state where the positive luck is kept thin
The current position is a short position operation section.
I'll take a look at the whole
This is the Nasdaq 4 hour chart.
Today's approximate Top and Bottom prices are displayed.
around the green support line
Check the red up/light blue down movement path
I made today's trading strategy.
Bitcoin 4 hour chart.
The position is very ambiguous.
Following Nasdaq, if the decline accelerates
It is a seat that can be opened all the way to the bottom.
(4 , 6, 12 MACD deadcross)
around the purple support line
Red up / sky blue down movement path check
I made today's trading strategy.
This is a 30-minute chart one-way long position strategy.
There are no important indicators to be announced today.
The 12-hour MACD Golden Cross is in progress on the NASDAQ side.
In terms of fast turnover and patterns, Bitcoin is more expensive than Nasdaq.
There seems to be a high probability of hitting the lower side first.
If the purple support line is broken, it can be pushed up to the bottom.
Please be careful.
I have left the main time zone and price, so please refer to it.
1) $27675.5 long position entry section / Stop loss price when the purple support line is broken
2) 33466 short position switching section / Stop loss when the green resistance line is broken
In spot exchanges, according to the timing of entering long positions,
You may want to try short-term management of major altcoins.
Please note that there is a high possibility of sidewalking.
Principle trading / Stop loss required
Hope you operate safely
thank you.
