USDCAD: 2-week horizon🛠 Technical Analysis: On the 4-hour timeframe, USDCAD has invalidated its ascending channel structure, triggering a "Global bearish signal" confirmed by the death cross of the SMA 50 below the SMA 100 and 200. The pair is currently under strong selling pressure but is approaching a major support zone near 1.3730, which aligns with previous accumulation levels. The projected trade setup anticipates a stabilization at this support floor, followed by a corrective rally targeting the breakdown point and the SMA cluster around 1.3980 - 1.4000.
———————————————
❗️ Trade Parameters (BUY)
———————————————
➡️ Entry Point: Buy Limit at the support zone (approx. 1.3730 – 1.3750)
🎯 Take Profit: 1.3980 – 1.4015 (Resistance)
🔴 Stop Loss: Below the support structure (approx. 1.3600)
⚠️ Disclaimer: This is a potential trade idea based on current analysis; market conditions and price direction are subject to change based on news factors and volatility.
CAD (Canadian Dollar)

CADCHF: Bulls Will Push Higher
It is essential that we apply multitimeframe technical analysis and there is no better example of why that is the case than the current CADCHF chart which, if analyzed properly, clearly points in the upward direction.
Disclosure: I am part of Trade Nation's Influencer program and receive a monthly fee for using their TradingView charts in my analysis.
❤️ Please, support our work with like & comment! ❤️

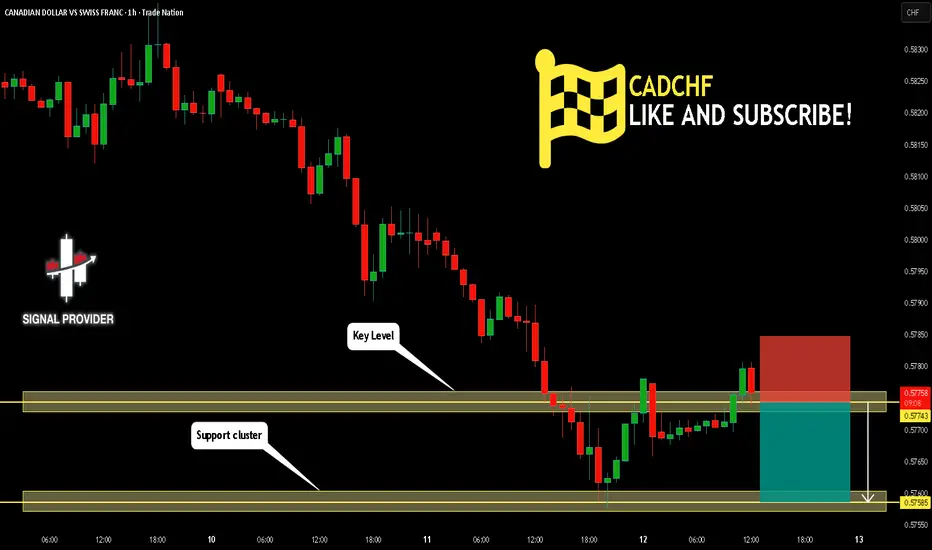
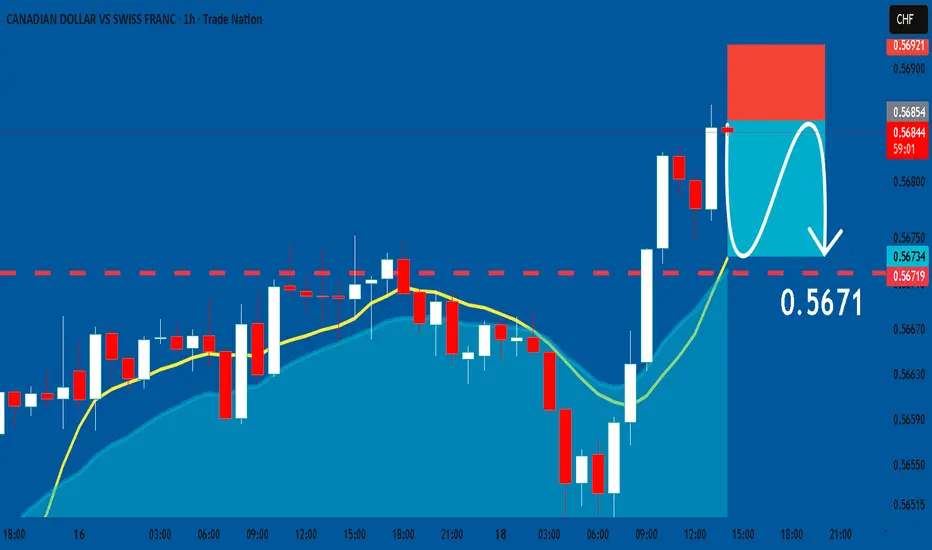
CADCHF Will Move Lower! Short!
Here is our detailed technical review for CADCHF.
Time Frame: 1h
Current Trend: Bearish
Sentiment: Overbought (based on 7-period RSI)
Forecast: Bearish
The market is trading around a solid horizontal structure 0.576.
The above observations make me that the market will inevitably achieve 0.575 level.
P.S
Please, note that an oversold/overbought condition can last for a long time, and therefore being oversold/overbought doesn't mean a price rally will come soon, or at all.
Like and subscribe and comment my ideas if you enjoy them!

Bullish bounce off?CAD/CHF has bounced off the pivot, which is acting as pullback support, and could rise toward the 1st resistance.
Pivot: 0.5756
1st Support: 0.57192
1st Resistance: 0.5804
Disclaimer:
The opinions given above constitute general market commentary and do not constitute the opinion or advice of IC Markets or any form of personal or investment advice.
Any opinions, news, research, analyses, prices, other information, or links to third-party sites contained on this website are provided on an "as-is" basis, are intended to be informative only, and are not advice, a recommendation, research, a record of our trading prices, an offer of, or solicitation for, a transaction in any financial instrument and thus should not be treated as such. The information provided does not involve any specific investment objectives, financial situation, or needs of any specific person who may receive it. Please be aware that past performance is not a reliable indicator of future performance and/or results. Past performance or forward-looking scenarios based upon the reasonable beliefs of the third-party provider are not a guarantee of future performance. Actual results may differ materially from those anticipated in forward-looking or past performance statements. IC Markets makes no representation or warranty and assumes no liability as to the accuracy or completeness of the information provided, nor any loss arising from any investment based on a recommendation, forecast, or any information supplied by any third party

CADCHF Will Go UP!
HI,Traders !
#CADCHF is trading in an
Uptrend and the pair is
Hovering just above the
Horizontal support level
Around 0.57502 so we
Are bullish biased and
We will be expecting a
Swing move up !
Comment and subscribe to help us grow !

CADCHF Will Move Lower! Short!
Take a look at our analysis for CADCHF.
Time Frame: 1h
Current Trend: Bearish
Sentiment: Overbought (based on 7-period RSI)
Forecast: Bearish
The market is testing a major horizontal structure 0.577.
Taking into consideration the structure & trend analysis, I believe that the market will reach 0.575 level soon.
P.S
The term oversold refers to a condition where an asset has traded lower in price and has the potential for a price bounce.
Overbought refers to market scenarios where the instrument is traded considerably higher than its fair value. Overvaluation is caused by market sentiments when there is positive news.
Like and subscribe and comment my ideas if you enjoy them!
Bulllish bounce of 38.2% Fibonacci support?CAD/CHF has bounced off the pivot, which serves as pullback support, and could rise to the 1st resitance, which is a pullback resistance that aligns with the 50% Fibonacci retracement.
Pivot: 0.5756
1st Support: 0.5719
1st Resistance: 0.5804
Disclaimer:
The opinions given above constitute general market commentary and do not constitute the opinion or advice of IC Markets or any form of personal or investment advice.
Any opinions, news, research, analyses, prices, other information, or links to third-party sites contained on this website are provided on an "as-is" basis, are intended to be informative only, and are not advice, a recommendation, research, a record of our trading prices, an offer of, or solicitation for, a transaction in any financial instrument and thus should not be treated as such. The information provided does not involve any specific investment objectives, financial situation, or needs of any specific person who may receive it. Please be aware that past performance is not a reliable indicator of future performance and/or results. Past performance or forward-looking scenarios based upon the reasonable beliefs of the third-party provider are not a guarantee of future performance. Actual results may differ materially from those anticipated in forward-looking or past performance statements. IC Markets makes no representation or warranty and assumes no liability as to the accuracy or completeness of the information provided, nor any loss arising from any investment based on a recommendation, forecast, or any information supplied by any third party

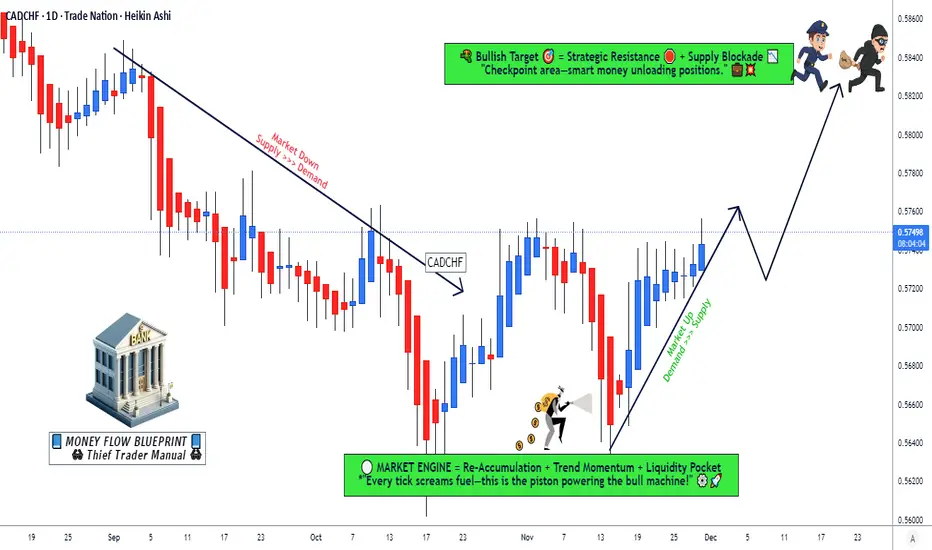
CAD/CHF Technical Roadmap for a Potential Upside Push📌 CAD/CHF Swing Trade — Thief Layer Strategy | Bullish Opportunity 🚀🇨🇦🇨🇭
Asset: CAD/CHF — “CANADIAN DOLLAR VS SWISS FRANC”
Market Type: Forex Swing Trade Setup
📈 Trade Plan (Bullish Bias)
This setup is based on Thief Strategy Layer Entries, a method that scales into the market using multiple limit orders to capture value zones and reduce average entry cost.
✅ Entry Plan — “Thief Layer Style”
Using multiple buy-limit layers, entering at:
0.56800
0.57000
0.57200
(You can increase or modify layers depending on your own market confidence and capital rotation.)
🛡️ Stop Loss (Manage With Discipline)
Thief SL: 0.56600
Dear Ladies & Gentlemen (Thief OG’s), adjust your SL according to your personal risk tolerance and strategy.
I am NOT recommending you to use my SL as your fixed level — protect your capital the way you see fit.
🎯 Take Profit (Escape With Profits)
Price faces moving-average resistance, overbought signals, and potential bull traps, so take profits without hesitation.
Primary TP: 0.58400
Again — this is NOT a fixed TP for you.
Make money and take money based on your own risk and your own timing.
📚 Market Logic & Why Bullish?
CAD is gaining momentum due to improved risk sentiment.
CHF weakness appears in correlated safe-haven flows.
Technical structure shows bullish demand zones aligning with MA support.
Layered buys allow high flexibility during any intraday volatility.
🔍 Related Pairs to Watch (Correlations & Key Notes)
💵 USD/CHF
When USD strengthens and CHF weakens, it often pushes CAD/CHF upward as well.
Watch for risk-on sentiment and U.S. macro prints — they indirectly drive CHF’s safe-haven behavior.
💵 CAD/JPY
A strong CAD here often confirms broad Canadian Dollar strength.
If CAD/JPY is bullish, it reinforces confidence in CAD/CHF longs.
💵 USD/CAD
If USD/CAD is falling, that means CAD is strengthening — supportive for CAD/CHF upside.
Oil prices also influence CAD heavily; rising oil generally lifts CAD.
💵 EUR/CHF
Good for tracking CHF strength/weakness cycles.
If EUR/CHF is climbing, that shows CHF weakening — positive for CAD/CHF bulls.
🔥 Final Words (Thief OG Style)
Stay patient. Let the layers fill.
Protect your capital. Book profits smart.
Trade your plan — not someone else’s emotions.
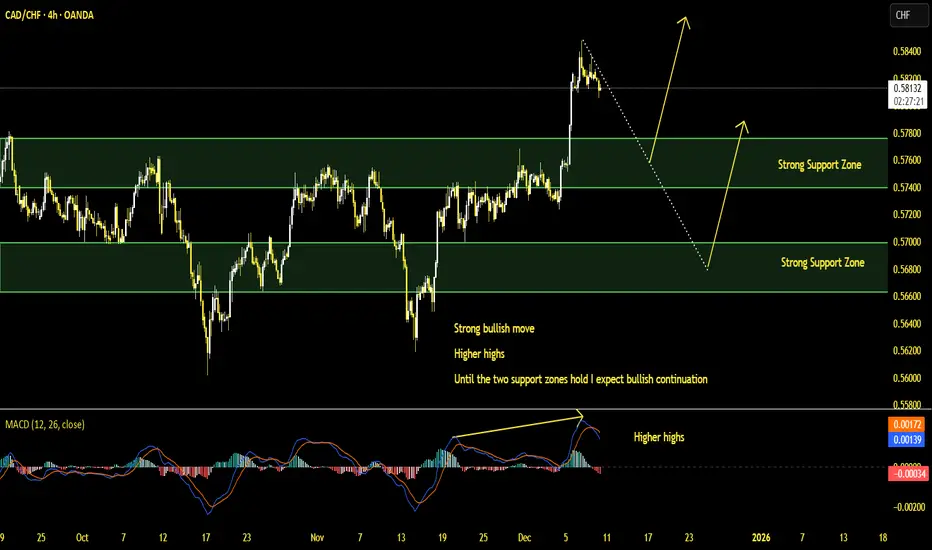
CADCHF Short Term Buy Trading Opportunity SpottedH4 - Strong bullish move
Higher highs
No opposite signs
Until the two support zones hold I expect bullish continuation
👉 If you enjoy this analysis, please Like, Follow, and Support the profile! Your engagement motivates us to share more quality setups.
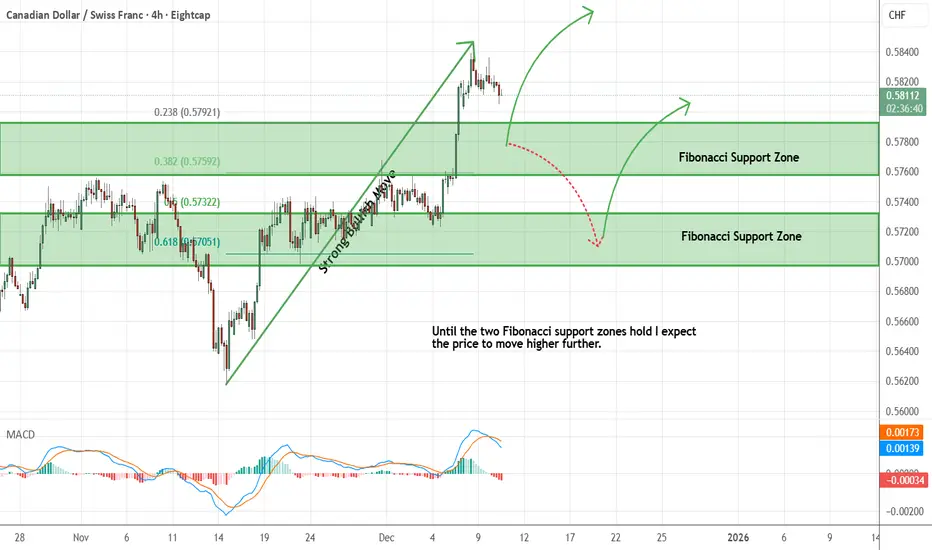
CADCHF - Looking To Buy Pullbacks In The Short TermH4 - Strong bullish move.
Currently it looks like a pullback is happening.
Until the two Fibonacci support zones hold I expect the price to move higher further.
If you enjoy this idea, don’t forget to LIKE 👍, FOLLOW ✅, SHARE 🙌, and COMMENT ✍! Drop your thoughts and charts below to keep the discussion going. Your support helps keep this content free and reach more people! 🚀
--------------------------------------------------------------------------------------------------------
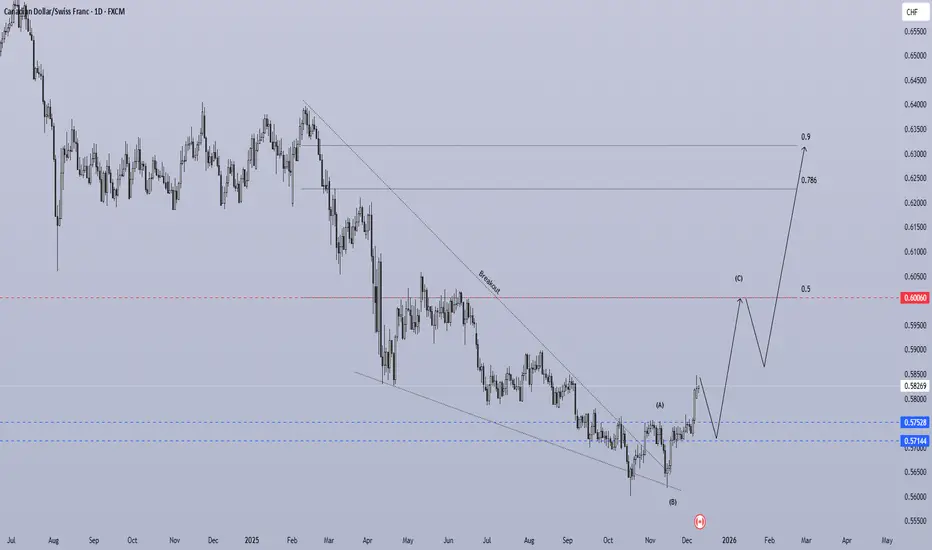
CADCHF D1✅ 1. Long-Term Context
CAD/CHF has been in a heavy downtrend for months, but several key reversal signals now appear:
🔹 Trendline Breakout
A major descending trendline has been cleanly broken.
Breakout signals a shift of momentum from bearish to neutral/bullish.
Price is now retesting the broken structure.
🔹 Bullish Divergence at the Low
(Not shown in the image, but the wick structure suggests exhaustion)
A classic sign of bearish trend exhaustion.
Fits with wave (B) being the final liquidity sweep.
✅ 2. Elliott Wave Structure (ABC Correction)
Your chart shows:
Wave (A)
First impulsive upward move breaking minor structure.
Establishes new bullish sentiment.
Wave (B)
Price retraced downward but did NOT break the major low, forming a higher low.
Price taps liquidity around 0.57144 – 0.57528, shown by the blue levels.
This is a classic B-wave liquidity sweep.
Wave (C) – upcoming bullish leg
Projected to be a strong rally targeting key Fibonacci zones:
0.60060 → 0.5 retracement
0.62000 area → 0.786 retracement
0.63500–0.64000 → 0.90 extension
Your wave projection is consistent: Wave C tends to be equal or stronger than Wave A.
✅ 3. Liquidity & Zone Structure
🔹 Demand Zone (support)
0.57144 (major liquidity pool)
0.57528 (secondary liquidity level)
Price is reacting from this zone, confirming demand.
🔹 First Target (C)
0.60060, which is the 0.5 retracement
This is also previous structure resistance → likely a reaction before continuation.
🔹 Major Targets
0.786 retracement at ~0.62000
0.90 extension at ~0.63500–0.64000
These zones also align with multiple horizontal levels on the weekly timeframe.
✅ 4. Market Behavior Outlook
🎯 Bullish Scenario (Primary)
Price forms a support above 0.5750–0.5800
Retest completes wave (B) or minor substructure
Strong push upward toward 0.60060
Short correction after hitting 0.60060
Wave (C) continues toward 0.62–0.64
This is the most likely scenario based on your structure.
USDCHF: bullish breakout🛠 Technical Analysis: On the 4-hour timeframe, USDCHF triggered a "Global bullish signal" with the completion of a SMA lines (100 and 200), confirming a shift in momentum. The price has successfully broken out of a local descending correction channel and is currently stabilizing above the significant SMA cluster support. The technical setup projects a continuation of the rally towards the immediate resistance at 0.81115, with a potential growth to the 0.8200 handle.
———————————————
❗️ Trade Parameters (BUY)
———————————————
➡️ Entry Point: Approx. 0.8050
🎯 Take Profit: 0.81115 (Resistance), medium-term target at 0.8200
🔴 Stop Loss: Below the recent consolidation structure and SMA cluster (approx. 0.80200)
⚠️ Disclaimer: This is a potential trade idea based on current analysis; market conditions and price direction are subject to change based on news factors and volatility.

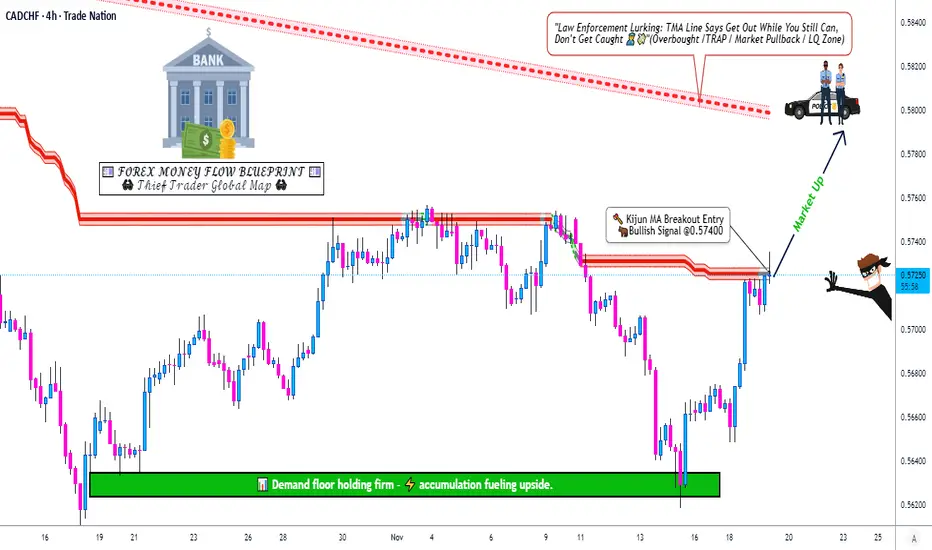
CAD/CHF ∫ Swing Trade Plan and Price RoadmapCAD/CHF Bullish Swing Setup 🚀 | Kijun Breakout & Retest in Play! 🇨🇦🇨🇭
TradingView Idea Description:
🎯 Hey Traders! Welcome to a detailed swing trade opportunity on the CAD/CHF. Let's break it down for maximum clarity and potential profits! 👍 & 💬 if you're following!
📈 Trade Thesis: Bullish Swing
The setup is simple: We are waiting for a decisive breakout and a successful retest of the Kijun-sen (Baseline from the Ichimoku Cloud) to confirm bullish momentum.
Asset: CAD/CHF (Canadian Dollar vs. Swiss Franc)
Strategy: Breakout & Retest | Swing Trade
Bias: BULLISH ✅
⚙️ Trade Plan & Execution
Trigger Zone: Watch price action around 0.57400.
Entry Signal: A clean breakout above the Kijun-sen, followed by a retest of it as new support. A bullish rejection candle (like a hammer or bullish engulfing) on the retest is your ideal confirmation.
Entry: You can enter on the retest confirmation or any point after a confirmed breakout closes above the level.
🛑 Dear Ladies & Gentleman (Thief OG's) - Risk Management is KEY! 🛑
Stop Loss (SL): My strategic stop loss is placed at 0.56800, below the recent structure.
⚠️ IMPORTANT NOTE: I am NOT recommending you use only my SL. Adjust your position size and stop loss based on your own risk tolerance and strategy. You are the captain of your own ship! 🧭
🎯 Profit Targets (PT):
TP 1: Our primary target is 0.58000.
Why Here? This level is where multiple technical factors converge:
🟥 Triangular Moving Average (TMA) acting as strong dynamic resistance.
📊 Potential overbought conditions on lower timeframes.
⚠️ A classic "trap zone" where corrections can begin.
Smart Move: This is a zone to escape with profits! Consider taking partial profits here.
⚠️ REMINDER: Just like the SL, this is MY target. You are free to take profits earlier or manage your trade based on your own analysis. Make your money, your way! 💰
🔍 Market Context & Related Pairs to Watch
Diversifying your view is crucial. Here are key pairs to keep on your radar and why:
USD/CAD ( OANDA:USDCAD ): 🔥 INVERSE Correlation. A weaker USD often means a stronger CAD (bullish for CAD/CHF). If USD/CAD is falling, it can support our bullish CAD/CHF thesis.
USD/CHF ( OANDA:USDCHF ): 🔥 POSITIVE Correlation. The CHF is a safe-haven. Often, USD/CHF and CAD/CHF can move in similar directions against the USD. A strong USD/CHF can sometimes lend strength to CAD/CHF.
EUR/CHF ( OANDA:EURCHF ): 🔥 POSITIVE Correlation. The Swiss Franc is often traded as a bloc against European currencies. Watch this for general CHF strength/weakness.
WTI Crude Oil ( BLACKBULL:WTI ): 💎 Key for CAD. The Canadian Dollar is a commodity currency, heavily linked to Oil prices. Rising Oil prices are generally BULLISH for the CAD. A strong rally in Oil could be the fundamental driver for this technical breakout.
Let's have a green and profitable trade! 🍀
#TradingView #Forex #CADCHF #SwingTrading #Ichimoku #Breakout #TechnicalAnalysis #ForexSetup #TradingIdeas #CommodityCurrencies #SafeHaven #ThiefOGs
CAD/CHF BEARS ARE STRONG HERE|SHORT
Hello, Friends!
CAD-CHF uptrend evident from the last 1W green candle makes short trades more risky, but the current set-up targeting 0.571 area still presents a good opportunity for us to sell the pair because the resistance line is nearby and the BB upper band is close which indicates the overbought state of the CAD/CHF pair.
Disclosure: I am part of Trade Nation's Influencer program and receive a monthly fee for using their TradingView charts in my analysis.
✅LIKE AND COMMENT MY IDEAS✅

CAD/CHF – Price Action Analysis (SELL Bias) Take Profit: 0.57171Institutional Technical Breakdown | All Sessions
CAD/CHF has activated a SELL signal driven entirely by Price Action, supported by pattern recognition from the last 200 bars and aligned with bearish structural flow. The pair is trading near a well-protected supply zone, where repeated rejections are signaling weakening buyer strength and increasing downside probability.
This is a clean, technically driven setup with no major news distortions.
📌 Signal Summary
Bias: SELL
Model: Price Action
Risk/Reward: ~1:2.5
Conditions: All Sessions
Volatility: Moderate & stable
The algorithm identifies consistent bearish reaction patterns when price approaches the current resistance zone.
📊 Technical Outlook
1. Price Action & Structure
Price is currently reacting below the 0.57535 – 0.57565 resistance band, which has acted as a strong intraday supply zone.
Upper-wick rejections indicate aggressive sell pressure at higher levels.
Candle structure is compressing — often a precursor to a decisive breakout toward the nearest liquidity pocket.
Market flow shows a lower-high formation, supporting continuation to the downside.
2. Momentum Alignment
Even though this is primarily a price-action signal, supporting indicators show:
Bearish divergence formation
Weakening bullish momentum
Increased probability of a downside break
This adds strong confluence to the bearish idea.
3. Market Context
CAD remains neutral-to-weak across cross-pairs.
CHF remains supported by safe-haven flows.
No major news for CAD or CHF, keeping this setup purely technical.
All sessions provide stable liquidity for execution.
📌 Key Technical Levels
Type Level
Immediate Resistance 0.57535
Immediate Support 0.57475
Major Resistance 0.57565
Major Support 0.57445
Price is currently sitting just below these resistance levels — ideal for a bearish continuation setup.
🎯 Trade Parameters
Entry Price: 0.57505
Stop Loss: 0.57671
Take Profit: 0.57171
The stop-loss placement is safely above major resistance, protecting the trade from short-term volatility spikes.
The take-profit level targets the next liquidity zone, aligning with the broader bearish rhythm.
🧠 Trade Rationale
Rejection from multi-layered resistance (0.57535 / 0.57565).
Bearish divergence confirms momentum failure.
Strong supply overhead restricting bullish expansion.
Clean liquidity void down to 0.57171.
Structural lower highs support continuation.
Overall, this setup represents a textbook bearish price-action continuation opportunity.
📉 Risk Management Recommendations
Use 1–2% risk per trade maximum.
Optionally take partial TP at 0.57445, the first liquidity shelf.
Enable trailing stop once price breaks below 0.57445.
If a candle closes above 0.57671, bearish bias becomes invalid.
📌 Analyst Conclusion
CAD/CHF shows a high-quality bearish setup backed by clean price action, structural confluence, and momentum alignment. As long as price stays below 0.57535–0.57565, downside continuation toward 0.57171 remains the most probable path.

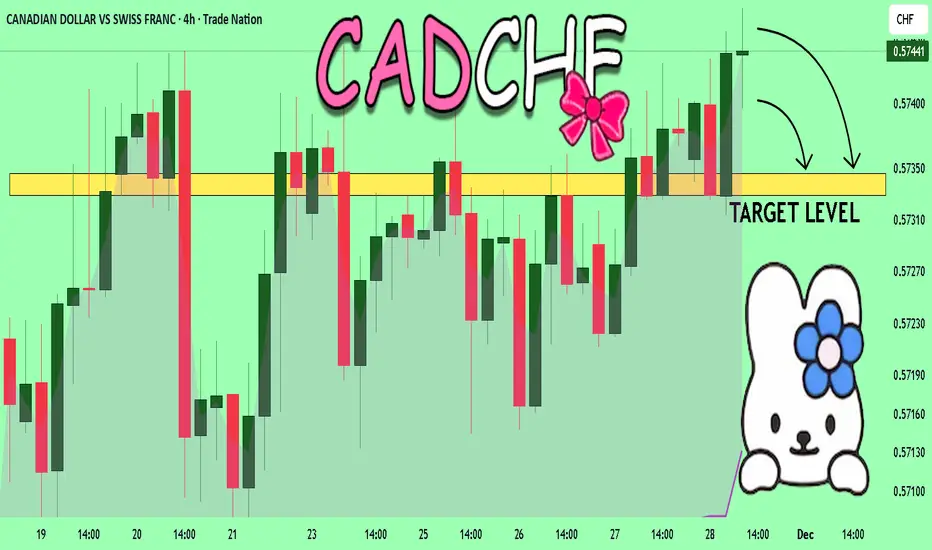
CADCHF What Next? SELL!
My dear friends,
Please, find my technical outlook for CADCHF below:
The instrument tests an important psychological level 0.5744
Bias - Bearish
Technical Indicators: Supper Trend gives a precise Bearish signal, while Pivot Point HL predicts price changes and potential reversals in the market.
Target - 0.5734
About Used Indicators:
Super-trend indicator is more useful in trending markets where there are clear uptrends and downtrends in price.
Disclosure: I am part of Trade Nation's Influencer program and receive a monthly fee for using their TradingView charts in my analysis.
———————————
WISH YOU ALL LUCK
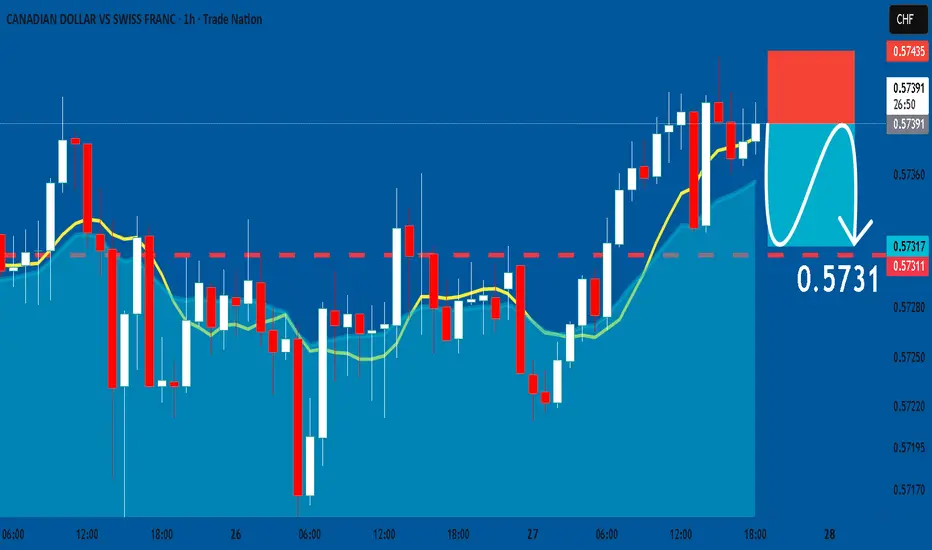
CADCHF: Bearish Continuation & Short Signal
CADCHF
- Classic bearish formation
- Our team expects pullback
SUGGESTED TRADE:
Swing Trade
Short CADCHF
Entry - 0.5739
Sl - 0.5743
Tp - 0.5731
Our Risk - 1%
Start protection of your profits from lower levels
Disclosure: I am part of Trade Nation's Influencer program and receive a monthly fee for using their TradingView charts in my analysis.
❤️ Please, support our work with like & comment! ❤️
Bounce from support ?! USD/CAD short-term long opportunityNot much movement expected for today. But CXY bounced from support recently and DXY currently showing weakness. Not unlikely that tomorrow's GDP news for Canada triggers a push upwards for USDCAD. We'll see...

CAD/CHF SELLERS WILL DOMINATE THE MARKET|SHORT
CAD/CHF SIGNAL
Trade Direction: short
Entry Level: 0.573
Target Level: 0.570
Stop Loss: 0.575
RISK PROFILE
Risk level: medium
Suggested risk: 1%
Timeframe: 6h
Disclosure: I am part of Trade Nation's Influencer program and receive a monthly fee for using their TradingView charts in my analysis.
✅LIKE AND COMMENT MY IDEAS✅

CADCHF According to the current quarter, price has been below the average. There was a sign of weakness on the week on 11/2/25 and since then, price is testing a resistance zone. I want to see if price can test the current target. If not, remember that trading is simply a game of probabilities.

CADCHF Will Go Down!
HI,Traders !
#CADCHF keeps growing
But will soon hit a horizontal
Resistance of 0.57502 and as
The pair is locally overbought
So after the retest we will
Be expecting a local
Bearish correction !
Comment and subscribe to help us grow !
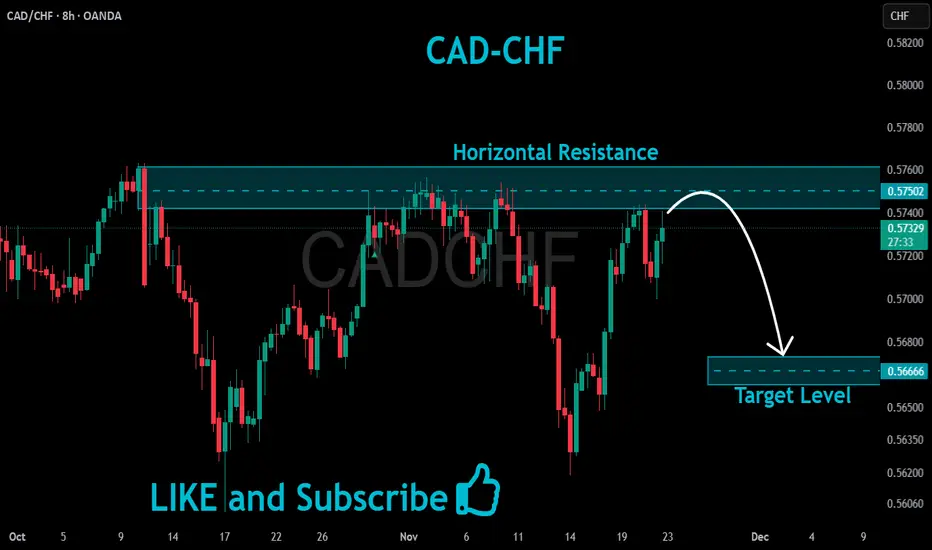
CADCHF: Short Signal with Entry/SL/TP
CADCHF
- Classic bearish formation
- Our team expects pullback
SUGGESTED TRADE:
Swing Trade
Short CADCHF
Entry - 0.5685
Sl - 0.5692
Tp - 0.5671
Our Risk - 1%
Start protection of your profits from lower levels
Disclosure: I am part of Trade Nation's Influencer program and receive a monthly fee for using their TradingView charts in my analysis.
❤️ Please, support our work with like & comment! ❤️
CADCHF FREE SIGNAL|SHORT|
✅CADCHF price taps a clean supply block after an aggressive displacement lower, forming a premium-zone retracement ideal for continuation. Liquidity above minor highs has been harvested, favoring downside flow.
———————————
Entry: 0.56650
Stop Loss: 0.56740
Take Profit: 0.56480
Time Frame: 2H
———————————
SHORT🔥
✅Like and subscribe to never miss a new idea!✅
