Bearish drop off?AUD/CAD is rising towards the resistance level which is a pullback resistance that aligns with the 38.2% Fibonacci retracement and could reverse from this level to our take profit.
Entry: 0.91961
Why we like it:
There is a pullback resistance that aligns with the 38.2% Fibonacci retracement.
Stop loss: 0.92566
Why we like it:
There is a swing high resistance.
Take profit: 0.91181
Why we like it:
There is a pullback support level that is slightly below the 61.8% Fibonacci retracement.
Enjoying your TradingView experience? Review us!
Please be advised that the information presented on TradingView is provided to Vantage (‘Vantage Global Limited’, ‘we’) by a third-party provider (‘Everest Fortune Group’). Please be reminded that you are solely responsible for the trading decisions on your account. There is a very high degree of risk involved in trading. Any information and/or content is intended entirely for research, educational and informational purposes only and does not constitute investment or consultation advice or investment strategy. The information is not tailored to the investment needs of any specific person and therefore does not involve a consideration of any of the investment objectives, financial situation or needs of any viewer that may receive it. Kindly also note that past performance is not a reliable indicator of future results. Actual results may differ materially from those anticipated in forward-looking or past performance statements. We assume no liability as to the accuracy or completeness of any of the information and/or content provided herein and the Company cannot be held responsible for any omission, mistake nor for any loss or damage including without limitation to any loss of profit which may arise from reliance on any information supplied by Everest Fortune Group.
CAD

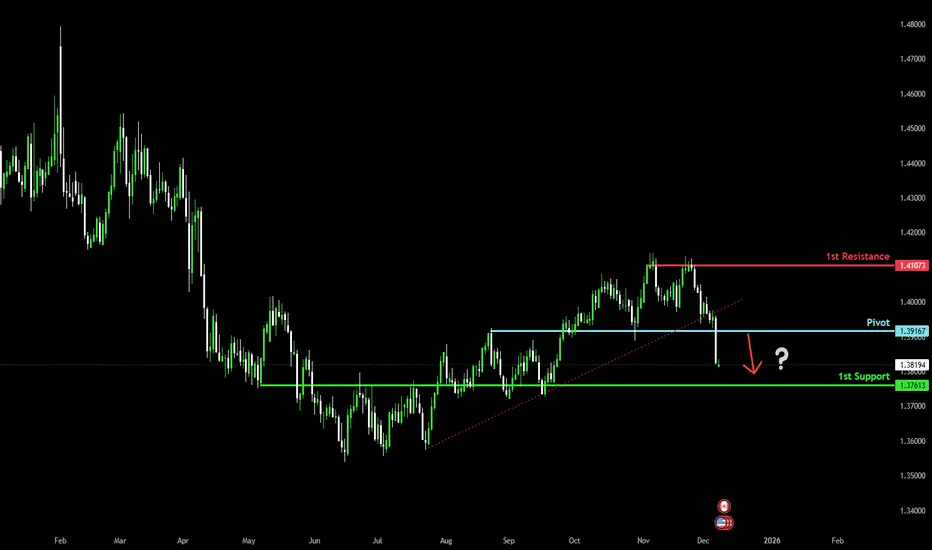
Bearish continuation setup?Loonie (USD/CAD) could rise to the pivot, which acts as an overlap resistance, and could reverse to the 1st support, which has been identified as an overlap support.
Pivot: 1.3916
1st Support: 1.3761
1st Resistance: 1.4107
Disclaimer:
The opinions given above constitute general market commentary and do not constitute the opinion or advice of IC Markets or any form of personal or investment advice.
Any opinions, news, research, analyses, prices, other information, or links to third-party sites contained on this website are provided on an "as-is" basis, are intended to be informative only, and are not advice, a recommendation, research, a record of our trading prices, an offer of, or solicitation for, a transaction in any financial instrument and thus should not be treated as such. The information provided does not involve any specific investment objectives, financial situation, or needs of any specific person who may receive it. Please be aware that past performance is not a reliable indicator of future performance and/or results. Past performance or forward-looking scenarios based upon the reasonable beliefs of the third-party provider are not a guarantee of future performance. Actual results may differ materially from those anticipated in forward-looking or past performance statements. IC Markets makes no representation or warranty and assumes no liability as to the accuracy or completeness of the information provided, nor any loss arising from any investment based on a recommendation, forecast, or any information supplied by any third party.
Bearish reevrsal off key resistance?EUR/CAD is rising towards the pivot, which acts as an overlap resistance that aligns witht he 127.2% Fibonacci extension and could reverse to the 1st support.
Pivot: 1.62915
1st Support: 1.62393
1st Resistance: 1.63225
Disclaimer:
The opinions given above constitute general market commentary and do not constitute the opinion or advice of IC Markets or any form of personal or investment advice.
Any opinions, news, research, analyses, prices, other information, or links to third-party sites contained on this website are provided on an "as-is" basis, are intended to be informative only, and are not advice, a recommendation, research, a record of our trading prices, an offer of, or solicitation for, a transaction in any financial instrument and thus should not be treated as such. The information provided does not involve any specific investment objectives, financial situation, or needs of any specific person who may receive it. Please be aware that past performance is not a reliable indicator of future performance and/or results. Past performance or forward-looking scenarios based upon the reasonable beliefs of the third-party provider are not a guarantee of future performance. Actual results may differ materially from those anticipated in forward-looking or past performance statements. IC Markets makes no representation or warranty and assumes no liability as to the accuracy or completeness of the information provided, nor any loss arising from any investment based on a recommendation, forecast, or any information supplied by any third party.

GBPCAD | long idea Looking for a bounce here on GBPCAD
Put up a target zone you will find on the chart.
Weekly bias on GBPCAD made me interested in this bounce from previous weekly low.
Let me know what you think!
Stay safe out there and do your own due diligence, this is not investment advise!

Potential bearish drop off?Loonie (USD/CAD) has reacted off the pivot and could drop to the 1st support.
Pivot: 1.3986
1st Support: 1.3879
1st resistance: 1.4048
Disclaimer:
The opinions given above constitute general market commentary and do not constitute the opinion or advice of IC Markets or any form of personal or investment advice.
Any opinions, news, research, analyses, prices, other information, or links to third-party sites contained on this website are provided on an "as-is" basis, are intended to be informative only, and are not advice, a recommendation, research, a record of our trading prices, an offer of, or solicitation for, a transaction in any financial instrument and thus should not be treated as such. The information provided does not involve any specific investment objectives, financial situation, or needs of any specific person who may receive it. Please be aware that past performance is not a reliable indicator of future performance and/or results. Past performance or forward-looking scenarios based upon the reasonable beliefs of the third-party provider are not a guarantee of future performance. Actual results may differ materially from those anticipated in forward-looking or past performance statements. IC Markets makes no representation or warranty and assumes no liability as to the accuracy or completeness of the information provided, nor any loss arising from any investment based on a recommendation, forecast, or any information supplied by any third party.

Bearish drop off?GBP/CAD could rise to the resistance level, which is a pullback resistance and could potentially drop from this level to our take profit.
Entry: 1.8540
Why we like it:
There is a pullback resistance level.
Stop loss: 1.8624
Why we like it:
There is a pullback resistance level.
Take profit: 1.8537
Why we like it:
There is a multi-swing low support level.
Enjoying your TradingView experience? Review us!
Please be advised that the information presented on TradingView is provided to Vantage (‘Vantage Global Limited’, ‘we’) by a third-party provider (‘Everest Fortune Group’). Please be reminded that you are solely responsible for the trading decisions on your account. There is a very high degree of risk involved in trading. Any information and/or content is intended entirely for research, educational and informational purposes only and does not constitute investment or consultation advice or investment strategy. The information is not tailored to the investment needs of any specific person and therefore does not involve a consideration of any of the investment objectives, financial situation or needs of any viewer that may receive it. Kindly also note that past performance is not a reliable indicator of future results. Actual results may differ materially from those anticipated in forward-looking or past performance statements. We assume no liability as to the accuracy or completeness of any of the information and/or content provided herein and the Company cannot be held responsible for any omission, mistake nor for any loss or damage including without limitation to any loss of profit which may arise from reliance on any information supplied by Everest Fortune Group.

USD/CAD Outlook: The Bearish Reversal & BoC PivotThe currency markets are witnessing a decisive shift. After months of dominance, the US Dollar is faltering against the Canadian Dollar (Loonie), driving a sharp USD/CAD bearish reversal . Traders who previously bet on continued divergence are now scrambling to reprice their portfolios. This is not merely a technical correction; it is a fundamental realignment driven by surprising Canadian resilience and a cooling US rate trajectory.
Macroeconomics: The Great Divergence
The central narrative has flipped. For much of 2025, markets assumed the Bank of Canada (BoC) would cut rates aggressively while the Federal Reserve held firm. That assumption is dead.
* The BoC Pause: Traders now expect the BoC to have concluded its easing cycle at **2.25%**. With inflation sticky and growth rebounding, the "rate cut" trade is unwinding.
* The Fed Pivot: Conversely, swaps markets now price in **four 25-point cuts** from the Fed over the next year.
* The Impact: This narrowing yield spread reduces the incentive to hold USD, fueling downside momentum in USD/CAD.
Economics & Data Science: The Citi Surprise
Market sentiment is often driven by data deviations rather than absolute numbers. The Citi Economic Surprise Index quantifies this "shock factor."
* Canada (Red Line): At a reading of **30.7**, Canadian data is beating expectations at the highest rate since August.
* USA (Blue Line): While positive, US data is clouded by dated releases due to the recent government shutdown.
This divergence proves that Canada’s economy is outperforming consensus models, forcing algorithmic trading systems to buy CAD.
Geopolitics & Strategy: The Trade Tension Paradox
While macroeconomics drives the current reversal, geopolitics remains the "wild card." The BoC’s October guidance cited "trade tensions with the United States" as a key risk. However, the market’s reaction suggests investors believe these fears are priced in or overstated. The resilience of Canada's export sector, despite tariff rhetoric, demonstrates a geostrategic robustness that is supporting the Loonie. Traders are betting that the deep integration of North American supply chains will prevent a catastrophic breakdown.
Technical Analysis & High-Tech: The Bearish Engulfing
Algorithmic execution desks are reacting to a powerful signal on the weekly timeframe. The USD/CAD chart has printed a Bearish Engulfing Candle , a technical pattern where a week of gains is completely erased and overtaken by selling pressure.
* The Signal: This pattern, appearing after a prolonged uptrend, indicates buyer exhaustion.
* The Target: Quants and technical traders view this as a green light to initiate short positions, targeting lower support levels as we enter December.
Management & Leadership: The Governing Council
The psychology of central banking is shifting. The BoC’s Governing Council, led by Tiff Macklem, is pivoting from "defensive easing" to "data-dependent holding." Their guidance has moved from cautious to neutral. This leadership shift mirrors the Reserve Bank of New Zealand’s recent hawkish hold, which triggered a massive rally in its local currency. If the BoC confirms this stance on **December 10**, the USD/CAD sell-off could accelerate.
Conclusion: The December Catalyst
The USD/CAD pair stands at a precipice. The convergence of a hawkish BoC, a dovish Fed, and robust Canadian data has created a "perfect storm" for a bearish trend. The immediate focus turns to **Friday’s jobs report**; another strong print would hammer the final nail into the coffin of the 2025 USD bull run. For traders, the trend is clear: the path of least resistance is now lower.

Bullish continuation?Loonie (USD/CAD) is falling towards the pivot which is an overlap support and could bounce to the 1st resistance.
Pivot: 1.3916
1st Support: 1.3761
1st Resistance: 1.4264
Disclaimer:
The opinions given above constitute general market commentary and do not constitute the opinion or advice of IC Markets or any form of personal or investment advice.
Any opinions, news, research, analyses, prices, other information, or links to third-party sites contained on this website are provided on an "as-is" basis, are intended to be informative only, and are not advice, a recommendation, research, a record of our trading prices, an offer of, or solicitation for, a transaction in any financial instrument and thus should not be treated as such. The information provided does not involve any specific investment objectives, financial situation, or needs of any specific person who may receive it. Please be aware that past performance is not a reliable indicator of future performance and/or results. Past performance or forward-looking scenarios based upon the reasonable beliefs of the third-party provider are not a guarantee of future performance. Actual results may differ materially from those anticipated in forward-looking or past performance statements. IC Markets makes no representation or warranty and assumes no liability as to the accuracy or completeness of the information provided, nor any loss arising from any investment based on a recommendation, forecast, or any information supplied by any third party.

Falling towards key support?USD/CAD is falling towards the support level which is an overlap support that i slightly below the 38.2% Fibonacci retracement and could bounce from this level to our take profit.
Entry: 0.8006
Why we like it:
There is an overlap support that i slightly below the 38.2% Fibonacci retracement.
Stop loss: 0.7968
Why we like it:
There is a pullback support level that aligns with the 61.8% Fibonacci retracement.
Take profit: 0.8067
Why we like it:
There is a pullback resistance level.
Enjoying your TradingView experience? Review us!
Please be advised that the information presented on TradingView is provided to Vantage (‘Vantage Global Limited’, ‘we’) by a third-party provider (‘Everest Fortune Group’). Please be reminded that you are solely responsible for the trading decisions on your account. There is a very high degree of risk involved in trading. Any information and/or content is intended entirely for research, educational and informational purposes only and does not constitute investment or consultation advice or investment strategy. The information is not tailored to the investment needs of any specific person and therefore does not involve a consideration of any of the investment objectives, financial situation or needs of any viewer that may receive it. Kindly also note that past performance is not a reliable indicator of future results. Actual results may differ materially from those anticipated in forward-looking or past performance statements. We assume no liability as to the accuracy or completeness of any of the information and/or content provided herein and the Company cannot be held responsible for any omission, mistake nor for any loss or damage including without limitation to any loss of profit which may arise from reliance on any information supplied by Everest Fortune Group.

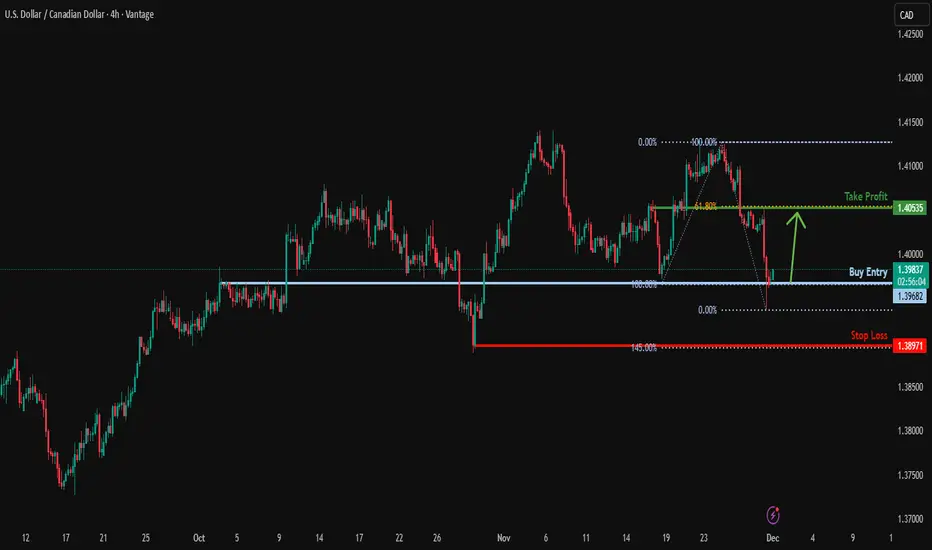
Potential bullish reversal?USD/CAD is reacting off the support level which is a pullback support and could bounce from this level to our take profit.
Entry: 1.3968
Why we like it:
There is a pullback support level.
Stop loss: 1.3897
Why we like it:
There is a swing low support level that aligns with the 145% Fibonacci extension.
Take profit: 1.4053
Why we like it:
There is a pullback resistance level that aligns with the 61.8% Fibonacci retracement.
Enjoying your TradingView experience? Review us!
Please be advised that the information presented on TradingView is provided to Vantage (‘Vantage Global Limited’, ‘we’) by a third-party provider (‘Everest Fortune Group’). Please be reminded that you are solely responsible for the trading decisions on your account. There is a very high degree of risk involved in trading. Any information and/or content is intended entirely for research, educational and informational purposes only and does not constitute investment or consultation advice or investment strategy. The information is not tailored to the investment needs of any specific person and therefore does not involve a consideration of any of the investment objectives, financial situation or needs of any viewer that may receive it. Kindly also note that past performance is not a reliable indicator of future results. Actual results may differ materially from those anticipated in forward-looking or past performance statements. We assume no liability as to the accuracy or completeness of any of the information and/or content provided herein and the Company cannot be held responsible for any omission, mistake nor for any loss or damage including without limitation to any loss of profit which may arise from reliance on any information supplied by Everest Fortune Group.
USDCAD Potential DownsidesHey Traders, in today's trading session we are monitoring USDCAD for a selling opportunity around 1.30600 zone, USDCAD is trading in a downtrend and currently is in a correction phase in which it is approaching the trend at 1.30600 support and resistance area.
Trade safe, Joe.

Multi swing high resistance ahead?AUD/CAD is rising towards the resistance level, which is a multi swing high resistance and could reverse from this level to our take profit.
Entry: 0.91961
Why we like it:
There is a multi-swing high resistance
Stop loss: 0.92483
Why we like it:
There is a resistance level at the 127.2% Fibonacci extension.
Take profit: 0.91181
Why we like it:
There is a pullback support level.
Enjoying your TradingView experience? Review us!
Please be advised that the information presented on TradingView is provided to Vantage (‘Vantage Global Limited’, ‘we’) by a third-party provider (‘Everest Fortune Group’). Please be reminded that you are solely responsible for the trading decisions on your account. There is a very high degree of risk involved in trading. Any information and/or content is intended entirely for research, educational and informational purposes only and does not constitute investment or consultation advice or investment strategy. The information is not tailored to the investment needs of any specific person and therefore does not involve a consideration of any of the investment objectives, financial situation or needs of any viewer that may receive it. Kindly also note that past performance is not a reliable indicator of future results. Actual results may differ materially from those anticipated in forward-looking or past performance statements. We assume no liability as to the accuracy or completeness of any of the information and/or content provided herein and the Company cannot be held responsible for any omission, mistake nor for any loss or damage including without limitation to any loss of profit which may arise from reliance on any information supplied by Everest Fortune Group.

Bearish drop off?USD/CAD has reacted off the support level and could drop from this level to our take profit.
Entry; 1.4059
Why we like it:
There is an overlap resistance level.
Stop loss: 1.4133
Why we like it:
There is a multi swing high resistance.
Take profit: 1.3973
Why we like it:
There an overlap support level
Enjoying your TradingView experience? Review us!
Please be advised that the information presented on TradingView is provided to Vantage (‘Vantage Global Limited’, ‘we’) by a third-party provider (‘Everest Fortune Group’). Please be reminded that you are solely responsible for the trading decisions on your account. There is a very high degree of risk involved in trading. Any information and/or content is intended entirely for research, educational and informational purposes only and does not constitute investment or consultation advice or investment strategy. The information is not tailored to the investment needs of any specific person and therefore does not involve a consideration of any of the investment objectives, financial situation or needs of any viewer that may receive it. Kindly also note that past performance is not a reliable indicator of future results. Actual results may differ materially from those anticipated in forward-looking or past performance statements. We assume no liability as to the accuracy or completeness of any of the information and/or content provided herein and the Company cannot be held responsible for any omission, mistake nor for any loss or damage including without limitation to any loss of profit which may arise from reliance on any information supplied by Everest Fortune Group.

GBP/CAD - H1 - UK Budget Boosts!📝 Description & Technical Setup FX:GBPCAD
GBP/CAD is trading inside a strong Ascending Broadening Wedge, showing bullish momentum with higher highs & higher lows.Price is currently holding above the trendline and Ichimoku support, indicating continued upward strength.
We expect a bullish continuation toward the next resistance levels after price breaks and sustains above the minor consolidation.
🟩 Resistance Levels
1st Resistance: 1.86736
2nd Resistance: 1.87198
🔥 Fundamental Update – 27 Nov 2025
1️⃣ UK Budget Surplus Boosts GBP - The UK government's Budget provided more extra money than expected, allowing the government to cover expenses & debts more comfortably.
➡ This increases fiscal stability, boosting investor confidence in the Pound.
#gbpcad #forex #forextrading #priceaction #technicalanalysis #chartanalysis #fxsignals
#tradingviewanalysis #forexsetup #ukbudget #poundsterling #canadiandollar
⚠️ Disclaimer
This is not financial advice.
Market conditions can change rapidly — always manage your risk & use stop-loss.
🙏 Support the Analysis
If you found this helpful, please Like ❤️ & Comment 💬 — it motivates me to post more high-quality setups daily!
Disclosure: I am part of the Headway Influencer Program for my chart analysis.

USDCAD starting a massive 2-year rally.The USDCAD pair has been trading within a Channel Up since the May 31 2021 market bottom. In recent weeks it broke above its 1W MA50 (blue trend-line) following a June 16 2025 Higher Low, just above the 1W MA200 (orange trend-line), which has been holding as the natural Support since September 2022.
Given the potential peak on the 1W CCI and the similarities with the previous Higher Low bottom formations, we expect the pair to start the new long-term Bullish Leg. With the previous two Bullish Legs rising by at least +13.00%, we anticipate the price to reach 1.53000 within 2 years time.
---
** Please LIKE 👍, FOLLOW ✅, SHARE 🙌 and COMMENT ✍ if you enjoy this idea! Also share your ideas and charts in the comments section below! This is best way to keep it relevant, support us, keep the content here free and allow the idea to reach as many people as possible. **
---
💸💸💸💸💸💸
👇 👇 👇 👇 👇 👇

Bearish reversal off key resistance?EUR/CAD has rejected off the pivot and could reverse to the 1st support, which acts as an overlap support that is slightly below the 61.8% Fibonacci retracement.
Pivot: 1.63347
1st Support: 1.62212
1st Resistance: 1.63918
Disclaimer:
The opinions given above constitute general market commentary and do not constitute the opinion or advice of IC Markets or any form of personal or investment advice.
Any opinions, news, research, analyses, prices, other information, or links to third-party sites contained on this website are provided on an "as-is" basis, are intended to be informative only, and are not advice, a recommendation, research, a record of our trading prices, an offer of, or solicitation for, a transaction in any financial instrument and thus should not be treated as such. The information provided does not involve any specific investment objectives, financial situation, or needs of any specific person who may receive it. Please be aware that past performance is not a reliable indicator of future performance and/or results. Past performance or forward-looking scenarios based upon the reasonable beliefs of the third-party provider are not a guarantee of future performance. Actual results may differ materially from those anticipated in forward-looking or past performance statements. IC Markets makes no representation or warranty and assumes no liability as to the accuracy or completeness of the information provided, nor any loss arising from any investment based on a recommendation, forecast, or any information supplied by any third party.

Bullish breakout confirmed?GBP/CAD could fall towards the support level which is a pullback support and could bounce from this level to our take profit.
Entry: 1.8540
Why we like it:
There is a pullback support level.
Stop loss: 1.8436
Why we like it:
There is a pullback support level.
Take profit: 1.8710
Why we like it:
There is a pullback resistance level.
Enjoying your TradingView experience? Review us!
Please be advised that the information presented on TradingView is provided to Vantage (‘Vantage Global Limited’, ‘we’) by a third-party provider (‘Everest Fortune Group’). Please be reminded that you are solely responsible for the trading decisions on your account. There is a very high degree of risk involved in trading. Any information and/or content is intended entirely for research, educational and informational purposes only and does not constitute investment or consultation advice or investment strategy. The information is not tailored to the investment needs of any specific person and therefore does not involve a consideration of any of the investment objectives, financial situation or needs of any viewer that may receive it. Kindly also note that past performance is not a reliable indicator of future results. Actual results may differ materially from those anticipated in forward-looking or past performance statements. We assume no liability as to the accuracy or completeness of any of the information and/or content provided herein and the Company cannot be held responsible for any omission, mistake nor for any loss or damage including without limitation to any loss of profit which may arise from reliance on any information supplied by Everest Fortune Group.

#042: Long Investment Opportunity on AUD/CAD
The Australian dollar/Canadian dollar pair is moving within a broad compression phase that has been developing for several sessions. Hello, I'm Forex Trader Andrea Russo, author of the book "The Institutional Code of Forex, 14 Steps to Read the Markets Like a Bank," available on Amazon. I'm an independent trader and money manager, and I thank you in advance for your time.
This structure has created a clear area of inefficiency just below the current market, while liquidity remains relatively flat and concentrated around the most recent lows.
From a technical perspective, the pair is reacting after a prolonged period of downside pressure, forming a sequence of higher rejection wicks near a key support region. This behavior suggests that short-side exhaustion is beginning to emerge. The market is no longer making momentum-driven lows and is instead moving toward a classic accumulation pattern, often observed before a corrective upside expansion.
Intermarket flows also support this interpretation. The Australian dollar is beginning to stabilize after a period of weakness triggered by commodity repricing and the reprioritization of macroeconomic priorities. Meanwhile, the Canadian dollar is showing signs of deceleration, partly influenced by the weaker tone of energy markets. The combination of a stabilizing AUD and a slower CAD creates a favorable environment for a bullish retracement on this cross.
Volatility conditions remain moderate, and the recovery in short-term momentum indicators is consistent with the idea that the pair may attempt a rotation toward the middle range of the broader structure. The pair is currently near the lower limit of this range, making the risk-reward profile more attractive for a controlled long position, especially for traders seeking to anticipate institutional accumulation rather than chasing breakout moves.
Price action offers an initial reversal signal, supported by a sharper rejection from discounted levels. If the market maintains this behavior and continues to respect the support zone it has repeatedly defended, a bullish continuation toward upper liquidity pockets becomes the most consistent scenario.
In summary, AUDCAD represents a strategic opportunity for bullish exposure within a controlled and well-defined structure. The pair is showing the first signs of accumulation, improving sentiment dynamics, and an intermarket environment favoring an upward correction. This configuration is consistent with an institutional approach that favors discounted entries, asymmetric risk, and positioning relative to the retail sentiment curve.

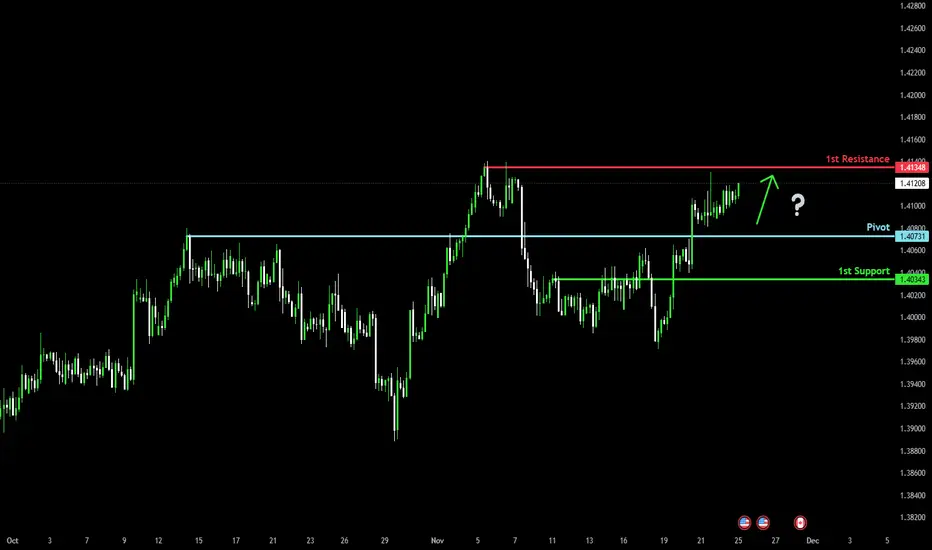
Bullish momentum to set to continue?Loonie (USD/CAD) could fall towards the pivot, which is a pullback support and could bounce to the 1st resistance.
Pivot: 1.4073
1st Support: 1.4034
1st Resistance: 1.4134
Disclaimer:
The opinions given above constitute general market commentary and do not constitute the opinion or advice of IC Markets or any form of personal or investment advice.
Any opinions, news, research, analyses, prices, other information, or links to third-party sites contained on this website are provided on an "as-is" basis, are intended to be informative only, and are not advice, a recommendation, research, a record of our trading prices, an offer of, or solicitation for, a transaction in any financial instrument and thus should not be treated as such. The information provided does not involve any specific investment objectives, financial situation, or needs of any specific person who may receive it. Please be aware that past performance is not a reliable indicator of future performance and/or results. Past performance or forward-looking scenarios based upon the reasonable beliefs of the third-party provider are not a guarantee of future performance. Actual results may differ materially from those anticipated in forward-looking or past performance statements. IC Markets makes no representation or warranty and assumes no liability as to the accuracy or completeness of the information provided, nor any loss arising from any investment based on a recommendation, forecast, or any information supplied by any third party.
Weekly FOREX Forecast: USDCAD, USDCHF & USDJPY Are Bullish!Welcome to Part 2 of The Weekly FOREX FORECAST!
Part 1 covered USD, EU, GU, AU, NU in the previous video.
In this video, we will analyze the following FX markets:
USD Index, USDCAD, USDCHF, and USDJPY.
Enjoy!
May profits be upon you.
Leave any questions or comments in the comment section.
I appreciate any feedback from my viewers!
Like and/or subscribe if you want more accurate analysis.
Thank you so much!
Disclaimer:
I do not provide personal investment advice and I am not a qualified licensed investment advisor.
All information found here, including any ideas, opinions, views, predictions, forecasts, commentaries, suggestions, expressed or implied herein, are for informational, entertainment or educational purposes only and should not be construed as personal investment advice. While the information provided is believed to be accurate, it may include errors or inaccuracies.
I will not and cannot be held liable for any actions you take as a result of anything you read here.
Conduct your own due diligence, or consult a licensed financial advisor or broker before making any and all investment decisions. Any investments, trades, speculations, or decisions made on the basis of any information found on this channel, expressed or implied herein, are committed at your own risk, financial or otherwise.

Bullish bounce off?Loonie (USD/CAD) has bounced off the pivot and could potentially rise to the 78.6% Fibonacci resistance.
Pivot: 1.3976
1st Support: 1.3865
1st Resistance: 1.4308
Disclaimer:
The opinions given above constitute general market commentary and do not constitute the opinion or advice of IC Markets or any form of personal or investment advice.
Any opinions, news, research, analyses, prices, other information, or links to third-party sites contained on this website are provided on an "as-is" basis, are intended to be informative only, and are not advice, a recommendation, research, a record of our trading prices, an offer of, or solicitation for, a transaction in any financial instrument and thus should not be treated as such. The information provided does not involve any specific investment objectives, financial situation, or needs of any specific person who may receive it. Please be aware that past performance is not a reliable indicator of future performance and/or results. Past performance or forward-looking scenarios based upon the reasonable beliefs of the third-party provider are not a guarantee of future performance. Actual results may differ materially from those anticipated in forward-looking or past performance statements. IC Markets makes no representation or warranty and assumes no liability as to the accuracy or completeness of the information provided, nor any loss arising from any investment based on a recommendation, forecast, or any information supplied by any third party.

NZDCADAccording to the current quarter, price has been below the average. There was a sign of weakness on the week on 11/16/25 and since then, price has some bullish momentum going on. I want to see if price can test the current target. If not, remember that trading is simply a game of probabilities. It's not much to grab according to my target but I have to stick to my strategy.

CADCHF According to the current quarter, price has been below the average. There was a sign of weakness on the week on 11/2/25 and since then, price is testing a resistance zone. I want to see if price can test the current target. If not, remember that trading is simply a game of probabilities.
