CAD-CHF Free Signal! Buy!
Hello,Traders!
CADCHF sharp sell-side liquidity sweep into a well-defined HTF demand zone. Strong rejection suggests smart-money absorption, with price poised for a corrective expansion toward the nearest imbalance.
--------------------
Entry: 0.5627
Stop Loss: 0.5599
Take Profit: 0.5665
Time Frame: 8H
--------------------
Buy!
Comment and subscribe to help us grow!
Check out other forecasts below too!
Disclosure: I am part of Trade Nation's Influencer program and receive a monthly fee for using their TradingView charts in my analysis.
CADCHF

CADCHF Will Go Up! Long!
Here is our detailed technical review for CADCHF.
Time Frame: 4h
Current Trend: Bullish
Sentiment: Oversold (based on 7-period RSI)
Forecast: Bullish
The market is approaching a key horizontal level 0.566.
Considering the today's price action, probabilities will be high to see a movement to 0.570.
P.S
The term oversold refers to a condition where an asset has traded lower in price and has the potential for a price bounce.
Overbought refers to market scenarios where the instrument is traded considerably higher than its fair value. Overvaluation is caused by market sentiments when there is positive news.
Like and subscribe and comment my ideas if you enjoy them!

Swiss franc safe haven strength to continue!Swiss franc looking strong across the board. CAD just broke down and is looking weak, which should see further downside here!

kvmev - GBPCHF FORECAST - 25/01/2026 - 30/01/2026*High risk trade*
Will wait for strong confirmation below support zone and clear rejection before taking sell position.
Price double top, failed to create HH & BoS, expecting price to drop unless fundamentals push it back up.

kvmev - CADCHF FORECAST - 25/01/2026 - 30/01/2026Expecting a continuation to the downside following a retest of the zone above.

Breakout + Retest of Inverse H&S on CADCHFOANDA:CADCHF is currently making a Retest of the Breakout of the Neckline or Resistance Level @ .57377 that helped create the Inverse Head and Shoulders Pattern.
If Price continues to be Supported, this will generate Long Opportunities!
CAD had impressive Retail Sales this morning with Core Retail Sales coming in @ 1.7% ( .7% increase from Forecast), this strengthens CAD and fundamentally feeds the Bullish Bias on the pair.

#CADCHF: Three Target Swing Buy For 2026! Dear Traders
Overview On #CADCHF👨💻📈
🔺CADCHF has recently accumulated and we believe the price is likely to enter a distribution phase. This phase will likely act as a swing target and is expected to hit all three of our targets.
🔺We’re still waiting for enough volume in the market to confirm our prediction.
Entry Zone, Exit Zone, Take Profit! 📊
🔺Enter the market when it’s fully formed with sufficient volume and momentum. Use a small stop-loss of 100 pips and set three standard take-profit targets.
🔺When trading the forex market, always use strict risk management.
Team SetupsFX_
⚠️ Disclaimer: Like, comment and follow for more trading setups. Get ready for 2026!

CAD/CHF SELLERS WILL DOMINATE THE MARKET|SHORT
CAD/CHF SIGNAL
Trade Direction: short
Entry Level: 0.572
Target Level: 0.569
Stop Loss: 0.573
RISK PROFILE
Risk level: medium
Suggested risk: 1%
Timeframe: 1h
Disclosure: I am part of Trade Nation's Influencer program and receive a monthly fee for using their TradingView charts in my analysis.
✅LIKE AND COMMENT MY IDEAS✅

Key resistance ahead?CAD/CHF is rising towards the pivot, which is an overlap resistance that is slightly below the 50% Fibonacci retracement and could reverse to the 1st support.
Pivot: 0.57349
1st Support: 0.56750
1st Resistance: 0.57579
Disclaimer:
The opinions given above constitute general market commentary and do not constitute the opinion or advice of IC Markets or any form of personal or investment advice.
Any opinions, news, research, analyses, prices, other information, or links to third-party sites contained on this website are provided on an "as-is" basis, are intended to be informative only, and are not advice, a recommendation, research, a record of our trading prices, an offer of, or solicitation for, a transaction in any financial instrument and thus should not be treated as such. The information provided does not involve any specific investment objectives, financial situation, or needs of any specific person who may receive it. Please be aware that past performance is not a reliable indicator of future performance and/or results. Past performance or forward-looking scenarios based upon the reasonable beliefs of the third-party provider are not a guarantee of future performance. Actual results may differ materially from those anticipated in forward-looking or past performance statements. IC Markets makes no representation or warranty and assumes no liability as to the accuracy or completeness of the information provided, nor any loss arising from any investment based on a recommendation, forecast, or any information supplied by any third party

CAD/CHF BEST PLACE TO SELL FROM|SHORT
Hello, Friends!
CAD/CHF pair is in the downtrend because previous week’s candle is red, while the price is clearly rising on the 9H timeframe. And after the retest of the resistance line above I believe we will see a move down towards the target below at 0.575 because the pair is overbought due to its proximity to the upper BB band and a bearish correction is likely.
Disclosure: I am part of Trade Nation's Influencer program and receive a monthly fee for using their TradingView charts in my analysis.
✅LIKE AND COMMENT MY IDEAS✅

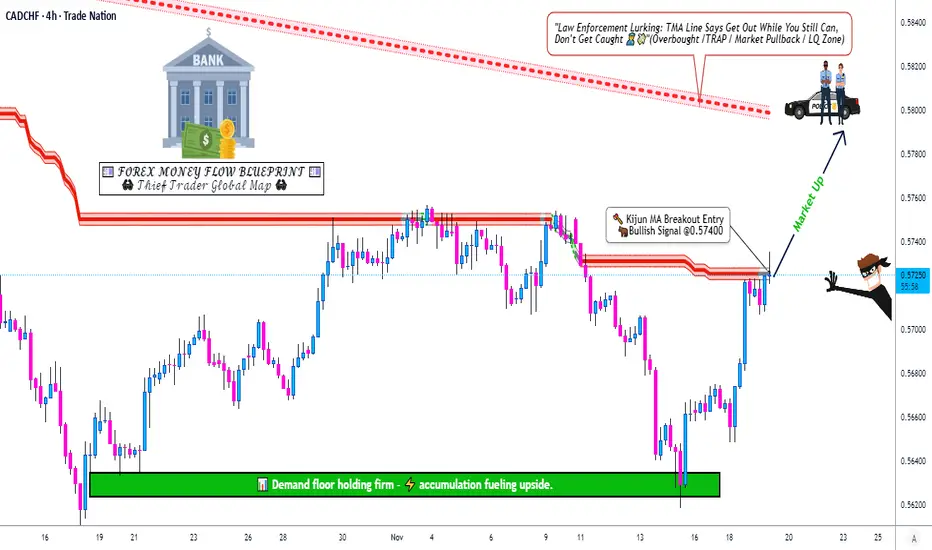
CAD/CHF ∫ Swing Trade Plan and Price RoadmapCAD/CHF Bullish Swing Setup 🚀 | Kijun Breakout & Retest in Play! 🇨🇦🇨🇭
TradingView Idea Description:
🎯 Hey Traders! Welcome to a detailed swing trade opportunity on the CAD/CHF. Let's break it down for maximum clarity and potential profits! 👍 & 💬 if you're following!
📈 Trade Thesis: Bullish Swing
The setup is simple: We are waiting for a decisive breakout and a successful retest of the Kijun-sen (Baseline from the Ichimoku Cloud) to confirm bullish momentum.
Asset: CAD/CHF (Canadian Dollar vs. Swiss Franc)
Strategy: Breakout & Retest | Swing Trade
Bias: BULLISH ✅
⚙️ Trade Plan & Execution
Trigger Zone: Watch price action around 0.57400.
Entry Signal: A clean breakout above the Kijun-sen, followed by a retest of it as new support. A bullish rejection candle (like a hammer or bullish engulfing) on the retest is your ideal confirmation.
Entry: You can enter on the retest confirmation or any point after a confirmed breakout closes above the level.
🛑 Dear Ladies & Gentleman (Thief OG's) - Risk Management is KEY! 🛑
Stop Loss (SL): My strategic stop loss is placed at 0.56800, below the recent structure.
⚠️ IMPORTANT NOTE: I am NOT recommending you use only my SL. Adjust your position size and stop loss based on your own risk tolerance and strategy. You are the captain of your own ship! 🧭
🎯 Profit Targets (PT):
TP 1: Our primary target is 0.58000.
Why Here? This level is where multiple technical factors converge:
🟥 Triangular Moving Average (TMA) acting as strong dynamic resistance.
📊 Potential overbought conditions on lower timeframes.
⚠️ A classic "trap zone" where corrections can begin.
Smart Move: This is a zone to escape with profits! Consider taking partial profits here.
⚠️ REMINDER: Just like the SL, this is MY target. You are free to take profits earlier or manage your trade based on your own analysis. Make your money, your way! 💰
🔍 Market Context & Related Pairs to Watch
Diversifying your view is crucial. Here are key pairs to keep on your radar and why:
USD/CAD ( OANDA:USDCAD ): 🔥 INVERSE Correlation. A weaker USD often means a stronger CAD (bullish for CAD/CHF). If USD/CAD is falling, it can support our bullish CAD/CHF thesis.
USD/CHF ( OANDA:USDCHF ): 🔥 POSITIVE Correlation. The CHF is a safe-haven. Often, USD/CHF and CAD/CHF can move in similar directions against the USD. A strong USD/CHF can sometimes lend strength to CAD/CHF.
EUR/CHF ( OANDA:EURCHF ): 🔥 POSITIVE Correlation. The Swiss Franc is often traded as a bloc against European currencies. Watch this for general CHF strength/weakness.
WTI Crude Oil ( BLACKBULL:WTI ): 💎 Key for CAD. The Canadian Dollar is a commodity currency, heavily linked to Oil prices. Rising Oil prices are generally BULLISH for the CAD. A strong rally in Oil could be the fundamental driver for this technical breakout.
Let's have a green and profitable trade! 🍀
#TradingView #Forex #CADCHF #SwingTrading #Ichimoku #Breakout #TechnicalAnalysis #ForexSetup #TradingIdeas #CommodityCurrencies #SafeHaven #ThiefOGs
CADCHF Sellers In Panic! BUY!
My dear followers,
I analysed this chart on CADCHF and concluded the following:
The market is trading on 0.5770 pivot level.
Bias - Bullish
Technical Indicators: Both Super Trend & Pivot HL indicate a highly probable Bullish continuation.
Target - 0.5777
Safe Stop Loss - 0.5766
About Used Indicators:
A super-trend indicator is plotted on either above or below the closing price to signal a buy or sell. The indicator changes color, based on whether or not you should be buying. If the super-trend indicator moves below the closing price, the indicator turns green, and it signals an entry point or points to buy.
Disclosure: I am part of Trade Nation's Influencer program and receive a monthly fee for using their TradingView charts in my analysis.
———————————
WISH YOU ALL LUCK

USDCAD: mid-term view🛠 Technical Analysis: On the 4-hour (H4) timeframe, USDCAD has undergone a significant bearish correction following a breakdown from its long-term Ascending channel. A "Global bearish signal" was confirmed in early December, leading to a sharp drop that pushed the price below all major moving averages (SMA 50, 100, and 200).
Currently, the pair is trading near the support at 1.37300. The price action suggests a "v-shaped" recovery attempt as the downward momentum slows down near this multi-month low. The analysis anticipates a technical reversal (mean reversion) back toward the previous breakout zone and the SMA 50, SMA 100 cluster, targeting the resistance around 1.39500.
———————————————
❗️ Trade Parameters (BUY)
———————————————
➡️ Entry Point: Buy only after the price closes above the support of 1.37300 (approx. 1.37340).
🎯 Take Profit: 1.39500 (Resistance).
🔴 Stop Loss: 1.36175 (Below the most recent swing low).
⚠️ Disclaimer: This is a potential trade idea based on current analysis; market conditions and price direction are subject to change based on news factors and volatility.

CADCHF | SHORT | Shift in Momentum: Trendline Break & RetestThe 4H bullish structure for CAD/CHF has been significantly compromised following a decisive break below the ascending purple trendline.
Price is currently retesting the horizontal resistance at 0.57584, providing a strategic vantage point to observe if this support-turned-resistance level holds.
The broader bearish bias remains intact as long as the price continues to trade beneath the primary descending trendline.
Order Setup: SHORT
Entry: 0.57584 - Positioned at the structure retest zone.
Stop Loss: 0.57808 - Placed above the recent swing high for risk protection.
Take Profit: Targeting 0.56987 with a secondary objective at 0.56739.
Note: If the price closes above 0.57808 or shows a strong pin-bar or bullish engulfing at the resistance zone, the bearish thesis is invalidated. Always wait for price action confirmation.
⚠️ DISCLAIMER: This post is for educational purposes and personal opinion only; it is not financial advice. Trading involves significant risk. Please Do Your Own Research (DYOR) and manage your risk strictly.

CADCHF Will Grow! Long!
Here is our detailed technical review for CADCHF.
Time Frame: 1h
Current Trend: Bullish
Sentiment: Oversold (based on 7-period RSI)
Forecast: Bullish
The market is on a crucial zone of demand 0.576.
The oversold market condition in a combination with key structure gives us a relatively strong bullish signal with goal 0.577 level.
P.S
We determine oversold/overbought condition with RSI indicator.
When it drops below 30 - the market is considered to be oversold.
When it bounces above 70 - the market is considered to be overbought.
Like and subscribe and comment my ideas if you enjoy them!

CADCHF: Price Action & Swing Analysis
Looking at the chart of CADCHF right now we are seeing some interesting price action on the lower timeframes. Thus a local move down seems to be quite likely.
Disclosure: I am part of Trade Nation's Influencer program and receive a monthly fee for using their TradingView charts in my analysis.
❤️ Please, support our work with like & comment! ❤️

CADCHF Forming a Solid Base | Slow Pair, Strong Targets 🧱📈 CADCHF Forming a Solid Base | Slow Pair, Strong Targets 🎯
Overview:
CADCHF is showing gradual bullish strength. This pair typically moves slowly, but the current price action indicates a well-established base, often seen before sustained upside moves.
Buy Zone (Focus Area):
🟢 0.5750
This level acts as a strong base where buyers are accumulating with patience.
Upside Targets:
🎯 Target 1: 0.5770 – Initial upside reaction
🎯 Target 2: 0.5790 – Continuation target
🎯 Target 3: 0.5800 – Psychological resistance
🎯 Target 4: 0.5820 – Extended upside target
🚀 Long-Term Target: 0.5850 – Broader bullish objective
Why This Setup Works:
✔ Strong base formation at support
✔ Bullish structure building slowly but cleanly
✔ Slow-moving pair reduces noise and false breakouts
Trade Management Insight:
This setup favors patient position management. Booking partial profits at each target helps secure gains while holding for long-term potential.
Execution Guidance:
Allow price time to develop from the base. Avoid overtrading—this pair rewards discipline and patience.
Final Note:
As long as the base remains intact, the probability favors a steady move toward higher targets.

Potential bullish rise?CAD/CHF has reacted off the pivot and could rise to the 1st resistance.
Pivot: 0.57802
1st Support: 0.57621
1st Resistance: 0.58186
Disclaimer:
The opinions given above constitute general market commentary and do not constitute the opinion or advice of IC Markets or any form of personal or investment advice.
Any opinions, news, research, analyses, prices, other information, or links to third-party sites contained on this website are provided on an "as-is" basis, are intended to be informative only, and are not advice, a recommendation, research, a record of our trading prices, an offer of, or solicitation for, a transaction in any financial instrument and thus should not be treated as such. The information provided does not involve any specific investment objectives, financial situation, or needs of any specific person who may receive it. Please be aware that past performance is not a reliable indicator of future performance and/or results. Past performance or forward-looking scenarios based upon the reasonable beliefs of the third-party provider are not a guarantee of future performance. Actual results may differ materially from those anticipated in forward-looking or past performance statements. IC Markets makes no representation or warranty and assumes no liability as to the accuracy or completeness of the information provided, nor any loss arising from any investment based on a recommendation, forecast, or any information supplied by any third party

CAD/CHF SENDS CLEAR BEARISH SIGNALS|SHORT
Hello, Friends!
Bearish trend on CAD/CHF, defined by the red colour of the last week candle combined with the fact the pair is overbought based on the BB upper band proximity, makes me expect a bearish rebound from the resistance line above and a retest of the local target below at 0.569.
Disclosure: I am part of Trade Nation's Influencer program and receive a monthly fee for using their TradingView charts in my analysis.
✅LIKE AND COMMENT MY IDEAS✅

USDCAD: 2-week horizon🛠 Technical Analysis: On the 4-hour timeframe, USDCAD has invalidated its ascending channel structure, triggering a "Global bearish signal" confirmed by the death cross of the SMA 50 below the SMA 100 and 200. The pair is currently under strong selling pressure but is approaching a major support zone near 1.3730, which aligns with previous accumulation levels. The projected trade setup anticipates a stabilization at this support floor, followed by a corrective rally targeting the breakdown point and the SMA cluster around 1.3980 - 1.4000.
———————————————
❗️ Trade Parameters (BUY)
———————————————
➡️ Entry Point: Buy Limit at the support zone (approx. 1.3730 – 1.3750)
🎯 Take Profit: 1.3980 – 1.4015 (Resistance)
🔴 Stop Loss: Below the support structure (approx. 1.3600)
⚠️ Disclaimer: This is a potential trade idea based on current analysis; market conditions and price direction are subject to change based on news factors and volatility.

CADCHF: Bulls Will Push Higher
It is essential that we apply multitimeframe technical analysis and there is no better example of why that is the case than the current CADCHF chart which, if analyzed properly, clearly points in the upward direction.
Disclosure: I am part of Trade Nation's Influencer program and receive a monthly fee for using their TradingView charts in my analysis.
❤️ Please, support our work with like & comment! ❤️

CADCHF Will Move Lower! Short!
Here is our detailed technical review for CADCHF.
Time Frame: 1h
Current Trend: Bearish
Sentiment: Overbought (based on 7-period RSI)
Forecast: Bearish
The market is trading around a solid horizontal structure 0.576.
The above observations make me that the market will inevitably achieve 0.575 level.
P.S
Please, note that an oversold/overbought condition can last for a long time, and therefore being oversold/overbought doesn't mean a price rally will come soon, or at all.
Like and subscribe and comment my ideas if you enjoy them!

Bullish bounce off?CAD/CHF has bounced off the pivot, which is acting as pullback support, and could rise toward the 1st resistance.
Pivot: 0.5756
1st Support: 0.57192
1st Resistance: 0.5804
Disclaimer:
The opinions given above constitute general market commentary and do not constitute the opinion or advice of IC Markets or any form of personal or investment advice.
Any opinions, news, research, analyses, prices, other information, or links to third-party sites contained on this website are provided on an "as-is" basis, are intended to be informative only, and are not advice, a recommendation, research, a record of our trading prices, an offer of, or solicitation for, a transaction in any financial instrument and thus should not be treated as such. The information provided does not involve any specific investment objectives, financial situation, or needs of any specific person who may receive it. Please be aware that past performance is not a reliable indicator of future performance and/or results. Past performance or forward-looking scenarios based upon the reasonable beliefs of the third-party provider are not a guarantee of future performance. Actual results may differ materially from those anticipated in forward-looking or past performance statements. IC Markets makes no representation or warranty and assumes no liability as to the accuracy or completeness of the information provided, nor any loss arising from any investment based on a recommendation, forecast, or any information supplied by any third party
