CAKE/USDT – Post-Dump Consolidation and Key Levels to WatchCAKE is currently consolidating after a sharp 28% drop earlier in December, setting the stage for potential liquidity sweeps and reactive plays.
🔼 Upside Scenario
Stop Hunt Setup: Price is pushing toward stops above the Dec 29 high at $1.920. A sweep here may provide bulls a clean exit or set up a reversal.
Key Resistance: Watch the $1.9775 level – the top of the unfilled bearish daily gap from Dec 17, aligned with the 18-day EMA, creating technical confluence.
Extended Bull Case: If momentum continues and BTC stays strong, price may target the Dec 15 gap at $2.0843. This zone marks the next major upside liquidity area.
🔽 Downside Scenario / Support Zones
Immediate Support: Around $1.8665, particularly if Monday’s low holds above Saturday’s high, forming a bullish daily gap.
Rejection Zone: Multiple bearish rejections since Dec 20 reinforce this support area.
Deeper Pullback:
Equal lows at $1.7890 and $1.7670 could become bearish targets.
$1.7943 (Dec 18 rejection) may act as a reaction level for bulls.
Below $1.7670, next structural supports are weak until $1.7200 and $1.7000, which are psychological levels where bulls may step in.
CAKE

FireHoseReel | CAKE at a Critical Support Zone🔥 Welcome To FireHoseReel !
Let's dive into Cake analysis, the native token of PancakeSwap DEX.
👀 CAKE – Short-Term Market Breakdown
After breaking its newly formed support at $2.342, CAKE moved sharply lower and formed a temporary support around $2.233.
A breakdown below $2.233 could activate the next major downside trigger.
📊 Volume Analysis
Selling pressure on CAKE has intensified aggressively.
In a single 4H candle, sellers dominated the market with heavy force.
If sell volume expands again, the current downtrend is likely to continue with momentum.
🔁 CAKE/BTC Perspective
The CAKE/BTC pair is still holding a bullish structure, but a loss of its current support could trigger a corrective phase in the BTC pair as well.
📌 Trading Scenario
This scenario can be used alongside your own trading strategy and risk management.
🔴 Short Scenario
Breakdown below the newly formed support at $2.233
Must be accompanied by a strong increase in sell volume
This could push CAKE lower and may also trigger a support breakdown on CAKE/BTC, adding further downside pressure.
❤️ Risk Management & Emotional Discipline
Crypto trading is highly risky. Without proper risk management and emotional control, trading is no different from gambling.
Logic must always come before emotions. Learn to manage your trades—and enjoy the process of trading with control and discipline.

CAKEUSD - PancakeSwap enter bull phaseHi
Pancake Swap has around 3B TVL into his DEX and its still the most used.
Owned by Binance.
Even though is a big range, this kind of altcoin could be highly speculative and can reach unimaginative prices.
This is not a trading advice.
Thanks
Gex

#CAKE/USDT – Potential Recovery Setup Amid BNB Ecosystem Stren#CAKE
The price is moving in an ascending channel on the 1-hour frame, adhering well to it, and is heading for a strong breakout and retest.
We have a bearish trend on the RSI indicator that is about to be broken and retested, which supports the upward breakout.
There is a major support area in green at 2.70, representing a strong support point.
We are heading for consolidation above the 100 moving average.
Entry price: 2.74
First target: 2.82
Second target: 2.90
Third target: 2.99
Don't forget a simple matter: capital management.
When you reach the first target, save some money and then change your stop-loss order to an entry order.
For inquiries, please leave a comment.
Thank you.

TradeCityPro | CAKE: Range Squeeze, Breakout Imminent👋 Welcome to TradeCity Pro!
In this analysis, I want to review the CAKE coin, one of the DeFi projects active on the BNB network with a market cap of 916 million USD, ranked 74th on CoinMarketCap.
⏳ 1-Hour Timeframe
This coin is currently in a small range box on the 1-hour timeframe, and this tight range has reduced its price fluctuation.
✨ This compression indicates that, if the box is broken, price could make a sharp move.
⭐ Currently, price is at the bottom of this compression and has entered a key support zone.
✔️ If the support zone breaks, the downward move for CAKE will resume, so we can open a short position if the level is broken.
📊 However, if price finds support at this level and moves upward, we can open a long position once 2.785 is broken.
💥 Both triggers for long and short are highly risky. For more reliable triggers, for a long position, we should wait for the break of 3.017, and for a short, we would look for a lower high and low below the support zone.
📝 Final Thoughts
Stay calm, trade wisely, and let's capture the market's best opportunities!
This analysis reflects our opinions and is not financial advice.
Share your thoughts in the comments, and don’t forget to share this analysis with your friends! ❤️

CAKEUSDT – Potential Recovery Setup Amid BNB Ecosystem StrengthCAKE remains one of the most active decentralized exchanges by volume, maintaining strong relevance alongside UNI. With renewed bullish momentum across the BNB ecosystem, CAKE may be poised for a recovery after a recent breakdown.
Price action is approaching a key support zone between $1.93 and $2.09, which could serve as a base for accumulation. If the level holds and broader sentiment improves, this area offers a strategic long setup targeting higher resistance zones.
Upside targets are defined at $2.70 and $4.20, with a stop loss below $1.66 to manage risk. This idea hinges on stabilization in the crypto market and continued strength in BNB-related projects.
Levels:
Entry Zone: $1.93–$2.09
Targets: $2.70, $4.20
Stop Loss: Below $1.66

CAKE About to Dump Hard? Bearish Signals FlashingYello Paradisers, are you ignoring CAKE while it's quietly screaming bearish right now? The setup is getting too juicy to overlook – and if you're on the wrong side, this could get painful fast...
💎CAKEUSDT is flashing multiple warning signs of a potential downward move after reacting from a key resistance zone. On the 1H timeframe, we’ve already seen a Change of Character (CHoCH), along with clear bearish divergences on MACD, RSI, and Stochastic RSI. That’s a strong confluence of signals that significantly increases the probability of a bearish continuation.
💎Price is now approaching a 4H Fair Value Gap (FVG) – a zone that could act as a perfect entry area for bears. For an even better risk-to-reward (RR), a slight pullback toward the resistance level would offer a more optimal short opportunity.
💎However, stay sharp. If CAKE breaks out and closes a candle above our invalidation level, then the bearish scenario will be completely invalidated. In that case, we’ll need to step aside and wait patiently for a new setup with clearer price action.
🎖Strive for consistency, not quick profits. Treat the market as a businessman, not as a gambler. Be a PRO💰
MyCryptoParadise
iFeel the success🌴

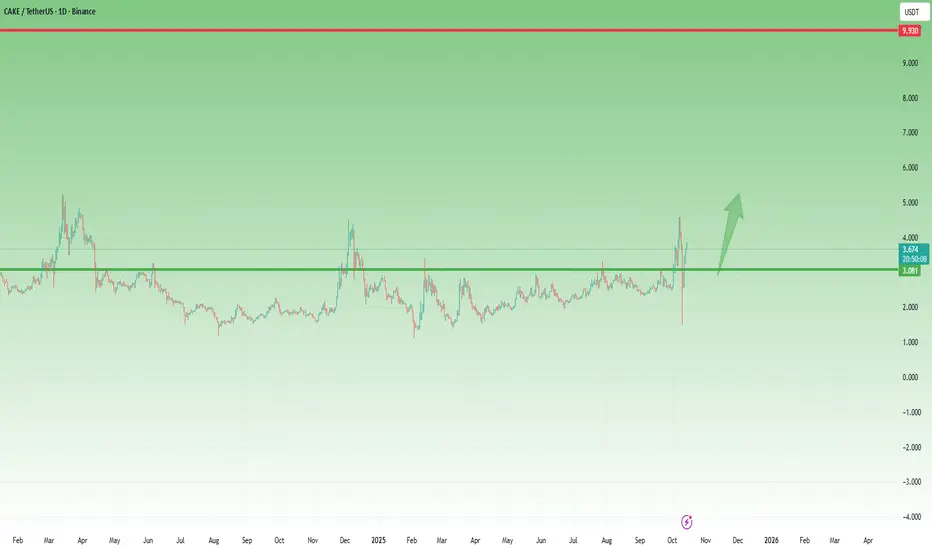
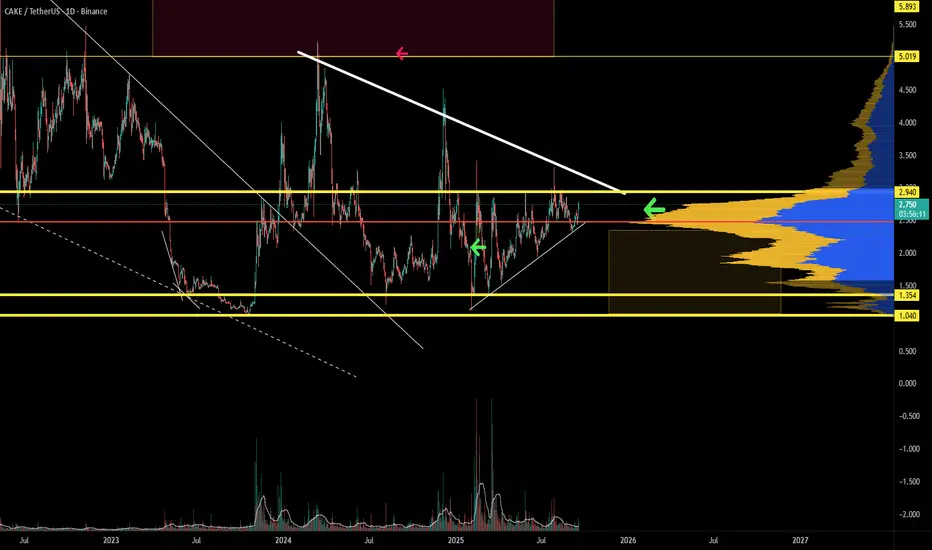
CAKE Analysis — Bulls Still in the GameIn my previous CAKE analysis, I mentioned that the coin could rise to at least 5 USD, following a breakout above the 1.5-year accumulation resistance.
That projection worked well, with CAKE reaching a high around 4.5 USD before entering what initially looked like a normal correction. However, Friday’s massive liquidation event turned that pullback into a sharp drop.
Yet, unlike many other altcoins that are still trading below their broken supports, CAKE showed an impressive recovery, quickly reclaiming the lost level. This kind of V-shaped recovery often signals strong underlying bullish pressure and confident buyers.
Technical outlook:
• Bias: Bullish again
• Key support: 3.00 USD (as long as price holds above, trend remains constructive)
• Target zone: 5.00 USD
• Strategy: Look for entry points near 3.00 USD or during healthy dips above that level
Momentum has shifted back to the bulls, and as long as 3 USD holds, the path of least resistance remains upward. 🚀
Buy $CAKE - HUGE NARRATIVE SHIFT CAME TO BNB - DONT WAITIn short Cake is close to breaking out of a 3 year range and the upside is huge.
The power driving this is a memecoin meta taking place on BNB.
Lots of inflow from solana coming in.
Four.meme is a launchpad that launches tokens on the pancakeswap liquidity pool.
The revenue its generating is 6X more then it was in the past so the token is criminally undervalued.
My buys may feel late but I think this can easily 5x from here.

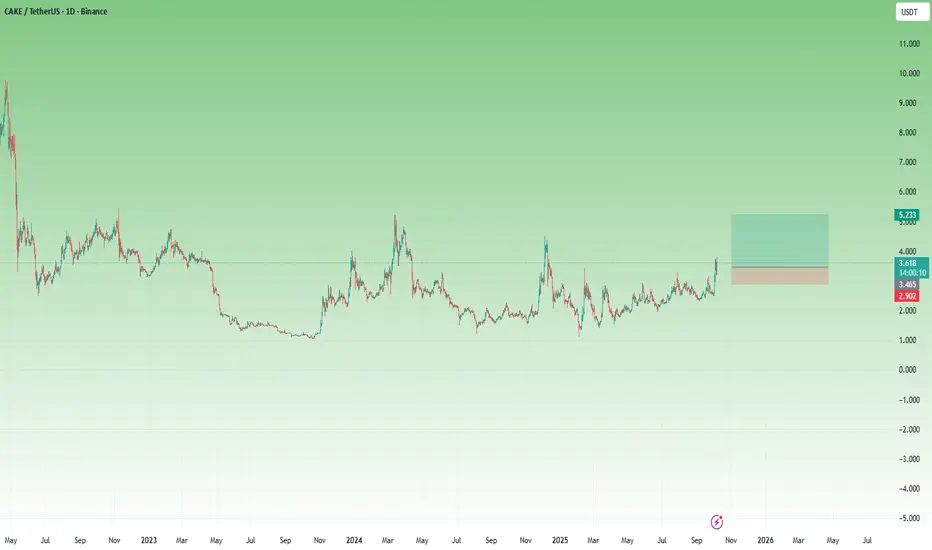
CAKE – Ready for Continuation After a Perfect Breakout RetestAfter the low from April, which aligned almost perfectly with the 2023 bottom, CAKE has shown remarkably constructive price action, steadily forming higher lows and repeatedly pressing against the $3 resistance zone.
Last week, the price finally broke above this major resistance and, in a textbook technical fashion, came back to retest the breakout level before rebounding strongly — confirming buyer commitment.
At the moment, CAKE trades around $3.5, holding well above the former resistance and showing signs of a potential upside continuation.
________________________________________
Key Levels & Outlook
• Support: $3.0 (former resistance, now key support)
• Intermediate target: $5.0
• Extended target: $10.0 (if momentum and broader market sentiment remain strong)
________________________________________
Trading Plan
My preferred strategy is to buy dips against the $3 level, aiming for $5 as a soft target, while keeping a runner for a potential test of $10 if the bullish momentum accelerates.
CAKE has proven resilience — now it’s time to see if it can turn this constructive structure into a sustained breakout.
CAKEUSDT Forming Bullish MomentumCAKEUSDT is currently showing strong bullish momentum, indicating a potential shift in market sentiment toward the upside. The pair has been gradually building strength after consolidating at lower levels, suggesting that sellers are losing control and buyers are stepping in with confidence. This momentum pattern is often a signal that accumulation has been taking place and a breakout rally could soon follow, especially as trading volume continues to show steady growth and increasing participation.
Over the past few sessions, CAKEUSDT has maintained a positive structure with higher lows forming consistently, which reflects strong buying interest and improved investor confidence. The coin’s recent price behavior aligns with the broader market recovery, adding to the bullish case. With expectations of a 50% to 60% potential gain, traders may look for continuation signals confirming upward pressure and a possible breakout above key resistance zones.
Investor sentiment appears optimistic as interest in CAKE continues to grow across the market. The combination of rising volume, positive momentum indicators, and renewed confidence suggests that CAKEUSDT could be gearing up for a sustained bullish trend. As long as price action holds above support levels, the probability of an extended upward move remains high.
✅ Show your support by hitting the like button and
✅ Leaving a comment below! (What is You opinion about this Coin)
Your feedback and engagement keep me inspired to share more insightful market analysis with you!

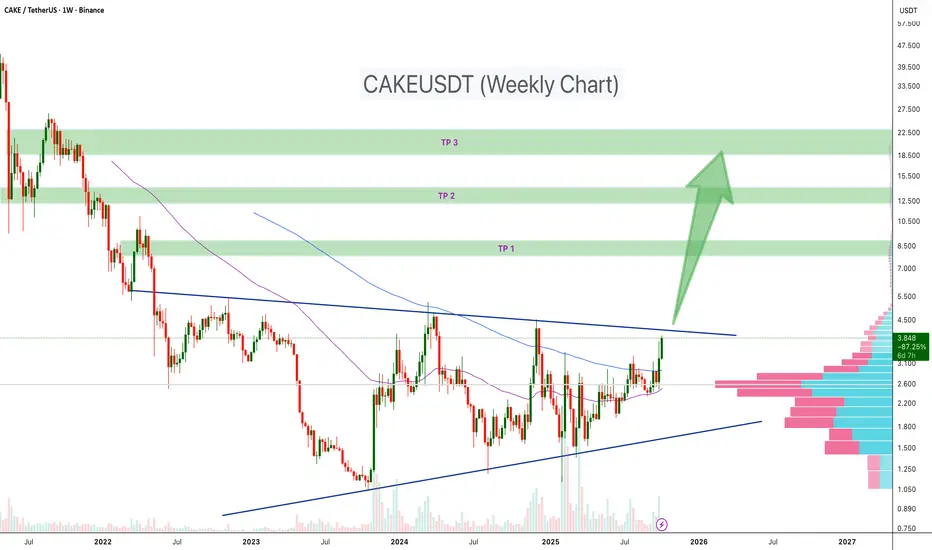
PancakeSwap Ready for a Major Rally!CAKE is showing strong signs of a potential long-term breakout after consolidating inside a symmetrical triangle pattern for nearly two years. The price recently broke above the mid-term resistance trendline, supported by increasing volume and a solid weekly close above the 50 and 100-week moving averages.
Technical Highlights:
🔷 Pattern: Symmetrical triangle formation in the weekly chart
🔷 Trend Confirmation: Price reclaiming above 50 and 100 EMA
🔷 Volume Profile: Strong accumulation between $1.8–$2.5 zone (visible on VPVR)
Target Zone
🟢 TP 1: $8.00 – $9.00
🟢 TP 2: $12.00 – $14.00
🟢 TP 3: $20.00 – $23.00
Bullish – Breakout confirmation on higher timeframes could initiate a strong mid-term rally toward TP2–TP3 levels.
Cheers
Hexa
Disclaimer:
This analysis is for educational purposes only and not financial advice. Always DYOR and manage risk responsibly.
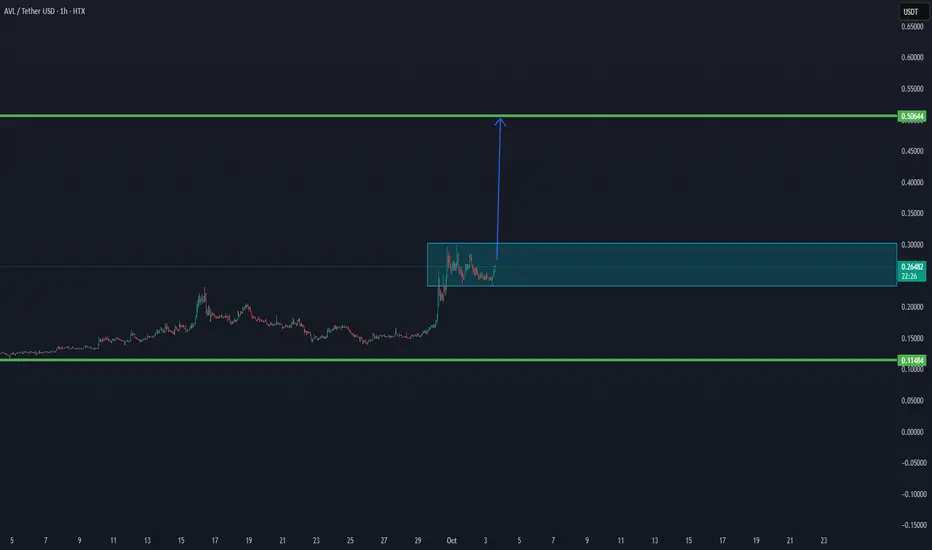
AVL/USDT IS ABLE TO BREAK IN THE COMING TIME TO $0,50✅ AVL has confirmed above both the low time frame and the main trend, showing strong bullish structure.
📈 With this setup, the chart is signaling a potential continuation move toward the $0.50 zone – the next major resistance.
Current support zone is holding well, which adds strength to the bullish case.
As long as AVL stays above the trend confirmations, momentum remains in favor of a breakout.
⚡ Outlook: Structure is positive, and upside potential toward $0.50 is active.
#CAKE/USDT : Trying to break horizontal resistance#CAKE
The price is moving within an ascending channel on the 1-hour frame, adhering well to it, and is on track to break it strongly upwards and retest it.
We have support from the lower boundary of the ascending channel, at 2.58.
We have a downtrend on the RSI indicator that is about to break and retest, supporting the upside.
There is a major support area in green at 2.55, which represents a strong basis for the upside.
Don't forget a simple thing: ease and capital.
When you reach the first target, save some money and then change your stop-loss order to an entry order.
For inquiries, please leave a comment.
We have a trend to hold above the 100 Moving Average.
Entry price: 2.61
First target: 2.63
Second target: 2.66
Third target: 2.71
Don't forget a simple thing: ease and capital.
When you reach your first target, save some money and then change your stop-loss order to an entry order.
For inquiries, please leave a comment.
Thank you.


CAKEUSDTThe price of $CAKUSDT has been in an uptrend but recently dropped from its high to a correction level at $3.260. Right now, it has pulled back to $2.610, which looks like a great area to buy. This price is a good spot because it’s where the price might bounce back up, making it a smart entry point for a trade.

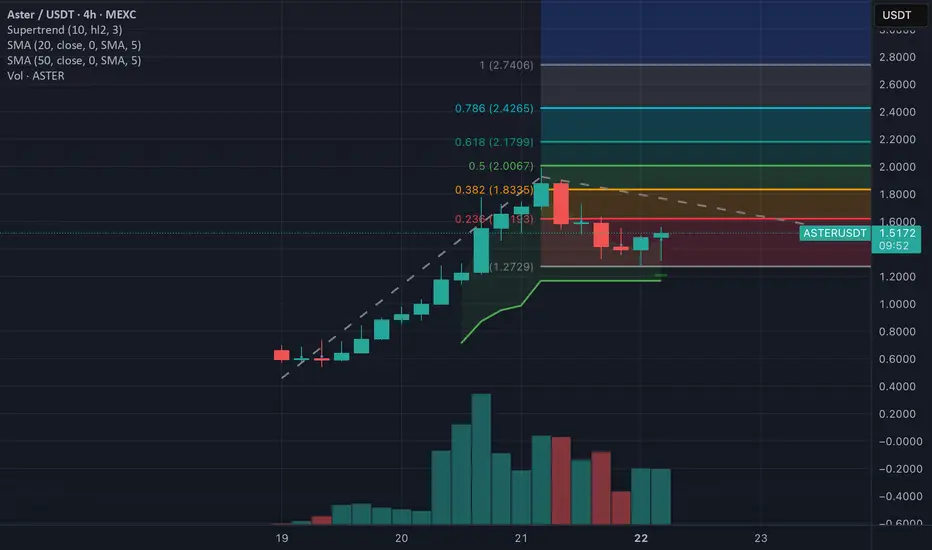
$ASTER to $4 - CZ would like thisMost of you have forgotten what happened with CAKE (biggest DEX on BSC) last cycle.
CAKE has gone from $3 million mcap to $6.6 billion mcap for 5/6 months. At that point of time biggest DEX and competitor to Pancakeswap was Uniswap which grew in the same time from $500 million mcap to $21.5 billion mcap (ATH)
Now we can see similar pattern. Just that Hyperliquid has been live already for a whole year.
-> This means BCS competitor doesn't have the same time to boost their token and will do it much faster.
Hype is trading around $17 and $20 billion mcap and there is still some time to break it's ATH mcap.
Very similar mcap as Uniswap at it's ATH moment.
Now with CZ backing personally ASTER and taking the $1000 per BNB moment, I see huge potential in the token price and both the fundamentals behind - ASTER exchange performance.
Minimum mcap of ASTER which I am looking to sell is same as in past cycle CAKE ATH mcap - $6.6 billion, which means at 1.65 billion tokens in circulation exactly $4 price per ASTER.
CZ's favourite number :)
1.65 billion tokens in circulation but if you take in consideration that 94% of total tokens are in founders hands, only 480 million tokens stay in real circulation. This means that pumping the token is much easier and needs less buy volume.
From the low info the graph gives us, we can predict the Fib levels.
CAKEUSDT | Green Zone Holding StrongCAKEUSDT has solid support around the green box levels. These zones have shown clean reactions in the past, and structure still favors buyers holding the line.
If price dips into that area again with low timeframe confirmation, it could offer a high-probability entry.
No hype, just structure and discipline.
📌I keep my charts clean and simple because I believe clarity leads to better decisions.
📌My approach is built on years of experience and a solid track record. I don’t claim to know it all but I’m confident in my ability to spot high-probability setups.
📌If you would like to learn how to use the heatmap, cumulative volume delta and volume footprint techniques that I use below to determine very accurate demand regions, you can send me a private message. I help anyone who wants it completely free of charge.
🔑I have a long list of my proven technique below:
🎯 ZENUSDT.P: Patience & Profitability | %230 Reaction from the Sniper Entry
🐶 DOGEUSDT.P: Next Move
🎨 RENDERUSDT.P: Opportunity of the Month
💎 ETHUSDT.P: Where to Retrace
🟢 BNBUSDT.P: Potential Surge
📊 BTC Dominance: Reaction Zone
🌊 WAVESUSDT.P: Demand Zone Potential
🟣 UNIUSDT.P: Long-Term Trade
🔵 XRPUSDT.P: Entry Zones
🔗 LINKUSDT.P: Follow The River
📈 BTCUSDT.P: Two Key Demand Zones
🟩 POLUSDT: Bullish Momentum
🌟 PENDLEUSDT.P: Where Opportunity Meets Precision
🔥 BTCUSDT.P: Liquidation of Highly Leveraged Longs
🌊 SOLUSDT.P: SOL's Dip - Your Opportunity
🐸 1000PEPEUSDT.P: Prime Bounce Zone Unlocked
🚀 ETHUSDT.P: Set to Explode - Don't Miss This Game Changer
🤖 IQUSDT: Smart Plan
⚡️ PONDUSDT: A Trade Not Taken Is Better Than a Losing One
💼 STMXUSDT: 2 Buying Areas
🐢 TURBOUSDT: Buy Zones and Buyer Presence
🌍 ICPUSDT.P: Massive Upside Potential | Check the Trade Update For Seeing Results
🟠 IDEXUSDT: Spot Buy Area | %26 Profit if You Trade with MSB
📌 USUALUSDT: Buyers Are Active + %70 Profit in Total
🌟 FORTHUSDT: Sniper Entry +%26 Reaction
🐳 QKCUSDT: Sniper Entry +%57 Reaction
📊 BTC.D: Retest of Key Area Highly Likely
📊 XNOUSDT %80 Reaction with a Simple Blue Box!
📊 BELUSDT Amazing %120 Reaction!
📊 Simple Red Box, Extraordinary Results
📊 TIAUSDT | Still No Buyers—Maintaining a Bearish Outlook
📊 OGNUSDT | One of Today’s Highest Volume Gainers – +32.44%
I stopped adding to the list because it's kinda tiring to add 5-10 charts in every move but you can check my profile and see that it goes on..

PancakeSwap creating its floor price.. Time to DCACAKE is forming its bottom with market participation, clearly defined by volume. The range that it is in defines a structure in which accumulation can begin. In fact, the price can still visit the bottom of the range and still maintain a bullish stance. As long as the price does not make a 1D LL, the bulls still have a good chance.
CAKE : Like a delicious cakeHello friends
Given the entry of buyers and the creation of higher price floors and ceilings, now in the price pullback in the support areas marked with Fibonacci, there are points that can grow the price to the specified limits and in these areas I buy.
*Trade safely with us*

Is #CAKE About to Crumble? Breakdown Alert Below Key SupportYello Paradisers! Are you watching what’s unfolding on #CAKEUSDT? Because if you’re not, you might get into a trap. Let’s break down #PanCakeSwap setup:
💎#CAKE has been respecting a clean ascending channel since mid-June, riding between dynamic support and resistance levels. However, after multiple rejections from the resistance zone near $3.00–$3.20, momentum has started to fade. The structure is now showing early signs of potential reversal.
💎A clear breakout below the ascending support has just taken place, and this opens the door to a potential bearish leg—especially if we get a successful retest of that broken support, which would now act as resistance. This is a crucial signal that smart traders are watching.
💎The bearish setup invalidation sits above $3.09. Only a clean breakout and hold above this level would invalidate the short bias and reintroduce the potential for a bullish expansion. Until then, the market structure remains vulnerable.
💎Currently trading around $2.63, #CAKEUSD is eyeing the $2.33 support zone. If this level fails to hold, we expect a deeper move toward the strong demand zone at $1.79, which also aligns with key high-volume nodes on the VRVP—making it a magnet for smart money accumulation.
Trade smart, Paradisers. This setup will reward only the disciplined.
MyCryptoParadise
iFeel the success🌴

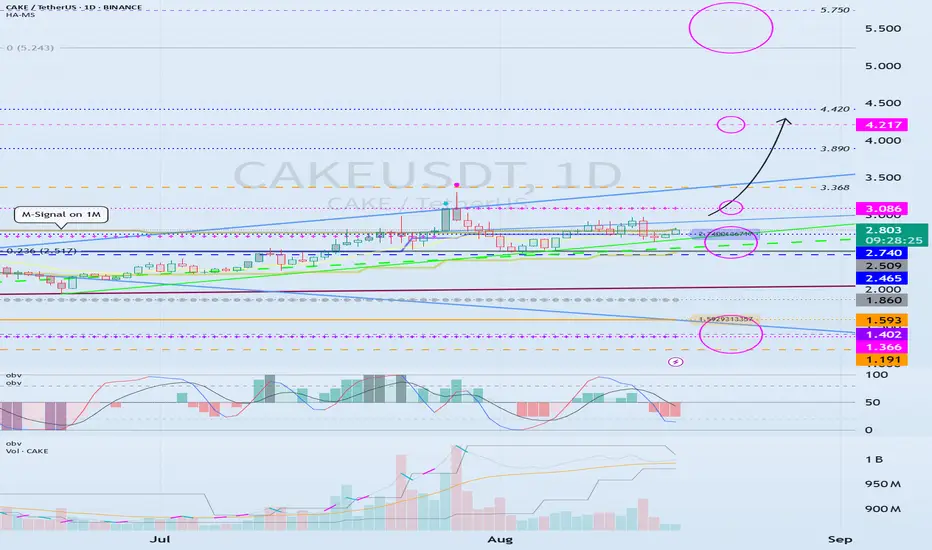
The key is whether it can rise above 3.086
Hello, fellow traders.
Follow us to get the latest information quickly.
Have a great day.
-------------------------------------
(CAKEUSDT 1W chart)
For the uptrend to begin, the price must rise above 5.750 and hold.
-
(1D Chart)
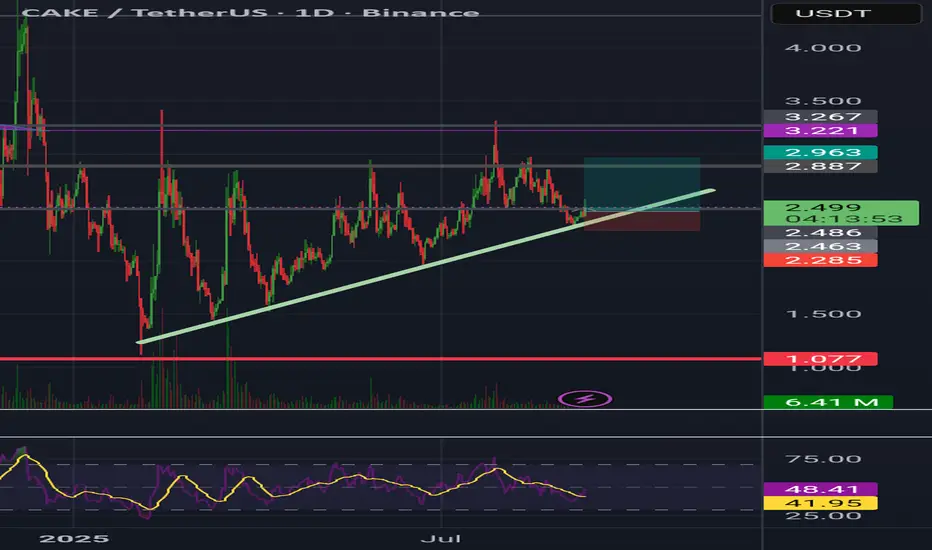
The key is whether the price can maintain support around 2.465-2.740 and rise above 3.086.
If the price holds above 3.086, a stepwise upward trend is highly likely.
At this point, the key point to watch is whether it can rise above 4.217.
If it finds support around 2.465-2.740 and rises, a medium- to long-term uptrend is likely, so you can develop a trading strategy based on this.
-
If it falls below 2.465, it could fall below 1.860, so you should stop trading and wait and see how things go.
The strong support area is 1.191-1.593, so if it finds support around this area, it would be a good time to buy.
-
Thank you for reading.
I wish you successful trading.
--------------------------------------------------
- Here's an explanation of the big picture.
(3-year bull market, 1-year bear market pattern)
I'll explain more in detail when the bear market begins.
------------------------------------------------------