CATI/USDT — Critical Zone: Make or Break MomentCurrently, CATI/USDT is trading around $0.086, right on the major support zone at $0.07–$0.09, which has been tested multiple times since May 2025. This area acts as a strong demand zone / accumulation base, and it may soon decide whether we see a reversal or a breakdown continuation.
---
🔎 Technical Analysis
1. Macro Trend:
From the peak near $0.91, the market has been in a strong downtrend.
Since May, however, the downward momentum has slowed, forming a sideways structure.
2. Price Structure & Pattern:
Price has been consolidating between $0.07–$0.11 for months.
A potential double bottom is forming with a neckline at $0.1115 → a breakout above this level could trigger a significant rally.
Multiple wick rejections at the lower bound highlight buying pressure around the demand zone.
3. Key Levels:
Major Support Zone: $0.07–$0.09
Nearest Resistance / Neckline: $0.1115
Next Resistance Levels: $0.139 → $0.183 → $0.278
Long-term Resistances: $0.401 – $0.519 – $0.711 – $0.914
---
🟢 Bullish Scenario
Confirmation: Daily close above $0.1115 with strong volume.
Short-term target: $0.139
Next targets: $0.183 → $0.278
Pattern projection: Double bottom breakout points toward ~$0.15 as a conservative measured move.
---
🔴 Bearish Scenario
Confirmation: Daily close below $0.07, breaking down the demand zone.
Target: $0.05–$0.06 as the next downside support.
Continuation: If the breakdown is confirmed with a failed retest, the broader downtrend is likely to resume.
---
📊 Conclusion
CATI is at a make-or-break zone.
Holding the $0.07–$0.09 base and breaking above $0.1115 could signal a trend reversal toward $0.139–$0.183.
Failure to defend $0.07 opens the door to a deeper bearish continuation.
Traders should be cautious of false breakouts / breakdowns and watch for daily close + volume confirmation.
---
#CATI #CATIUSDT #Crypto #Altcoin #TechnicalAnalysis #PriceAction #SupportResistance #Breakout #Accumulation
Catizenanalysis

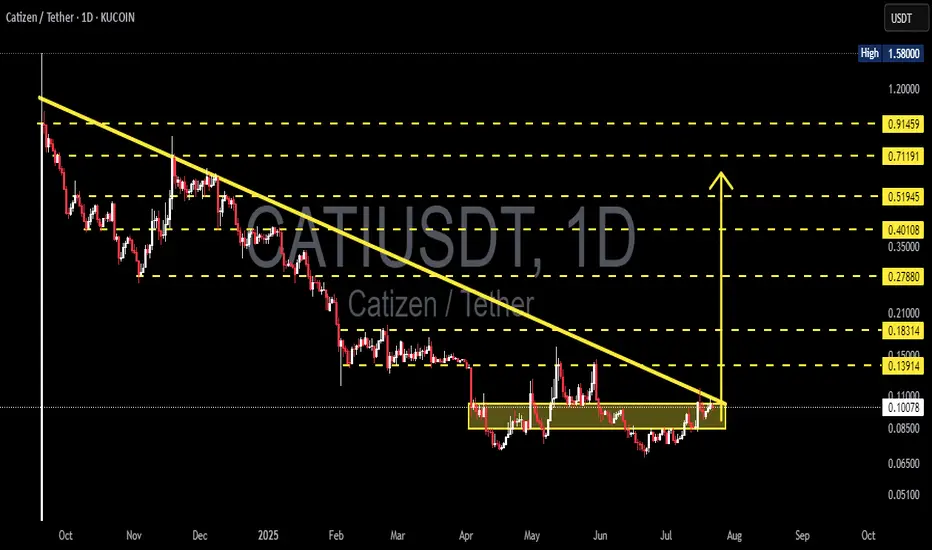
CATI/USDT – Massive Descending Trendline Breakout?🔎 Overview:
CATI/USDT is flashing a major trend reversal signal after months of accumulation and suppression under a dominant descending trendline. For the first time in almost 10 months, price action has successfully broken out of the downtrend, potentially setting the stage for a multi-layered bullish rally.
This breakout is not just a technical level — it’s a psychological shift from bearish to bullish sentiment. The consolidation zone between $0.065–$0.085 has acted as a solid accumulation base, and the breakout past $0.10 marks the beginning of a new phase.
📐 Chart Pattern Explanation:
🔻 Descending Triangle Breakout
Structure: Long-term lower highs with a flat support base.
Breakout Point: Around $0.1029, breaking the descending trendline cleanly.
Volume: A potential rise in volume post-breakout would confirm the breakout’s strength.
Target projection: Based on the height of the triangle, the potential move could extend above 200%.
This pattern is often seen at the end of a downtrend and signals a strong bullish reversal, especially when paired with horizontal accumulation like we see here.
📈 Bullish Scenario – Road to Potential 8x Gains:
If the breakout holds and gains momentum:
✅ First Target: $0.13914 – Previous local resistance.
✅ Second Target: $0.18314 – Strong resistance cluster zone.
✅ Third Target: $0.27880 – Clean psychological and structural target.
✅ Mid-term Target: $0.40108 to $0.51945 – Major Fibonacci level and previous breakdown area.
✅ Moon Target: $0.71191 to $0.91459 – If trend extends with volume and market-wide bullishness.
These targets are based on measured move projections, Fibonacci extensions, and historical price memory.
⚠️ Bearish Scenario – What Could Invalidate the Breakout?
❌ False breakout risk if price falls back below $0.095.
❌ A rejection candle or long wick at $0.13–$0.14 without volume could signal exhaustion.
❌ If Bitcoin or broader market faces correction, CATI might retrace to its base at $0.065 or even revisit $0.051.
Traders should watch for bearish divergence or sudden drop in volume as early warnings of reversal.
🧠 Strategic Notes:
Entry zone: Retest of breakout at $0.095–$0.102 could provide a low-risk entry.
Stop loss: Below $0.085 for conservative risk management.
Position sizing: Scale in during pullbacks. Don’t ape in full at resistance levels.
This setup has the classic ingredients of a low-cap altcoin explosion if momentum sustains.
🔥 Final Thoughts:
CATI/USDT is breaking free from its bearish chains and entering what could be the early stages of a parabolic move. With a textbook breakout pattern, clean structure, and well-defined levels — this is one of those charts traders dream of spotting early.
Keep your eyes on volume and structure — this could be one of the hidden gems of this cycle.
#CATIUSDT #CryptoBreakout #AltcoinGems #TechnicalAnalysis #BullishSetup #CryptoTrading #PriceAction #DescendingTriangle #BreakoutPlay #ReversalPattern
Catizen(CATI) Analysis==>FallingCatizen Telegram game has been listed with BINANCE:CATIUSDT token in various exchanges for less than 5 days .
What is Catizen!?
Catizen is a revolutionary gaming bot on Telegram that seamlessly integrates the Telegram & TON blockchain, transforming Web3 access by enabling practical mobile payments. By leveraging Telegram's immense traffic, Catizen aims to establish a Web3 traffic nexus on a scale of hundreds of billions. Catizen will become a mini-app center, combining the unique features of Launchpool with short videos and e-commerce, attracting and engaging users through gamification and strategic Play-to-Airdrop initiatives. This innovative approach aims to revolutionize the way users access and engage with the Web3 ecosystem.
-------------------------------------------------------
The opinions of Telegram users about this game are that those who spent money in the game were awarded more tokens and the number of CATI tokens did not depend only on the level of your cats in the game, and I think this was a weakness of the game and the criticism of many users brought along
------------------------------------------------------
In terms of Technical Analysis , Catizen(CATI) has succeeded in breaking the Support lines and the Support zone and it is likely to decrease at least until the next Support zone .
Did you participate in the airdrop of Catizen Telegram game!? Your personal experience of this game!?
Catizen Analyze (CATIUSDT), 1-hour Time frame ⏰.
Do not forget to put Stop loss for your positions (For every position you want to open).
Please follow your strategy; this is just my idea, and I will gladly see your ideas in this post.
Please do not forget the ✅' like '✅ button 🙏😊 & Share it with your friends; thanks, and Trade safe.
