Tia simple channel levelsSimple idea with fib (wick Daily from 10 october) BINANCE:TIAUSDT
We already at 0.61 fib but based on channel and Japan decision about rates in next few days we can see final drop to 3rd touch of channel around 23-26 December!
After that road will be to equilibrium of channel and 27 zone of fib where more than okay withdraw initial deposit or fix local trade
Celestia

Tia realistic targets. What you should know for 2026Friendly reminder: Celestia seed round in 2021 was priced at $0.01, so all those funds that participated in that round are still over 6000% in profit at current values! Even those who got in on the 2022 rounds at $0.09 cents are still over 500% in profit!
So I hope you didn't miss the main analysis I posted when TIA was at its peak values!
Everyone was laughing back then, saying I don't understand the technology, and stories about Celestia dropping below $1 seemed like pure fantasy to them! Now it's reality, and another reality is that Celestia as a protocol has about 50 active users per day + around $200 in daily profit from fees, and that's with $55 million raised in investor rounds!
Probably only now will it start to become clear to you that fundamental metrics are just a game of marketing)) The key is simply to study the price delivery algorithm!
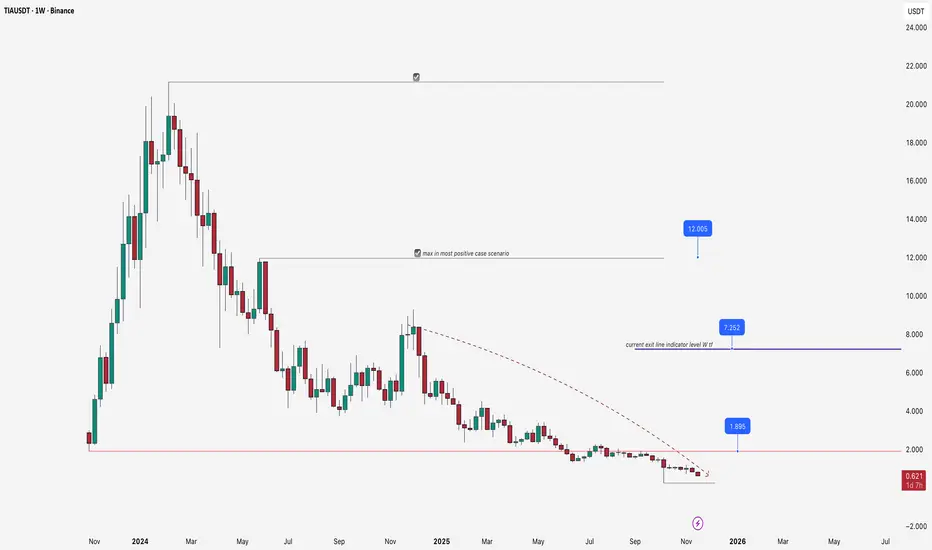
So in the worst-case scenario, TIA will just get delisted from exchanges, like they've done with many projects! Then of course the plan will be canceled!
But with positive altcoin dynamics and if Bitcoin dominance drops below 50%, then in theory we'll first close the local downward order flow, hitting the listing price first, then the exit line price for take profit, then the maximum, which in the most positive scenario is the equilibrium of the entire downward move from the peak values! Around $12!
TIA Swing Long OpportunityTIA Swing Long Opportunity
📊 Market Sentiment
Market sentiment is bullish, fueled by the FED restarting rate cuts. We’ve seen a 0.25 BPS cut in September, with expectations for two more consecutive 0.25 cuts in the coming months. In addition, institutional liquidity flow into crypto has increased as the US officially adopted crypto as part of its international reserves. While inflation remains elevated, a weakening labor market is forcing the FED to ease policy, pushing liquid capital into risk-on markets.
📈 Technical Analysis
Price created a Daily Demand Zone at $1.70 and bounced, confirming its validity.
Price also broke the bearish trendline and closed multiple candles above, signaling further upside potential toward higher liquidity targets.
📌 Game Plan
I already entered the position after rejection at $1.70 and will manage it as a swing setup, targeting highs around $3 — a potential 70% expansion.
🎯 Setup Trigger
Validation came from the rejection at $1.70.
📋 Trade Management
Stoploss: Daily close below $1.30
Target: $3 (Potential 70% expansion)
💬 Like, follow, and comment if you find this setup valuable!
⚠️ Disclaimer: This content is for informational and educational purposes only and does not constitute financial, investment, or trading advice. Always DYOR before making any financial decisions.

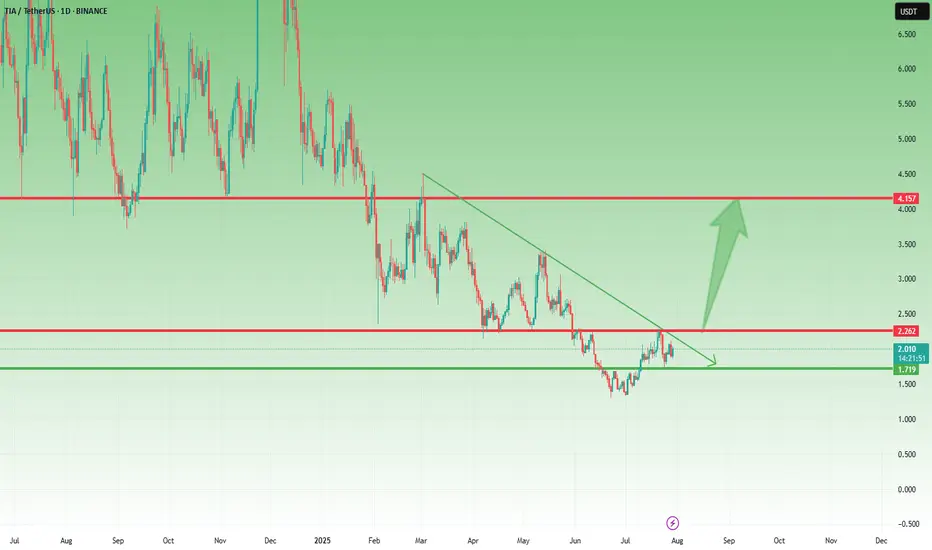
TIA Consolidation Ends? Bulls Eye 2.2 First, Then 4.0In my previous analysis, I mentioned that I am bullish on BINANCE:TIAUSDT , expecting the coin to recover at least part of the ground lost since the start of 2024.
So far, we haven’t seen real acceleration to the upside, but the price action is encouraging:
• Dips have been well defended around the 1.5 zone.
• The recent low stands above the July low, suggesting buyers are stepping in earlier.
• Two days ago, price finally managed to break above the falling trendline, a technical step in the right direction.
Putting these elements together, I maintain my bullish outlook. The first soft target for this move is 2.2.
But the real inflection point comes there: if TIA manages to stabilize above 2.2, a level that acted as support in early 2025 and resistance in late July, then the door opens for a much stronger rally. In that case, a reasonable target would be 4.0, with momentum likely to pick up sharply.

TIA/USDT — a Major Decision Point at the Downtrend Line!🔎 Overview
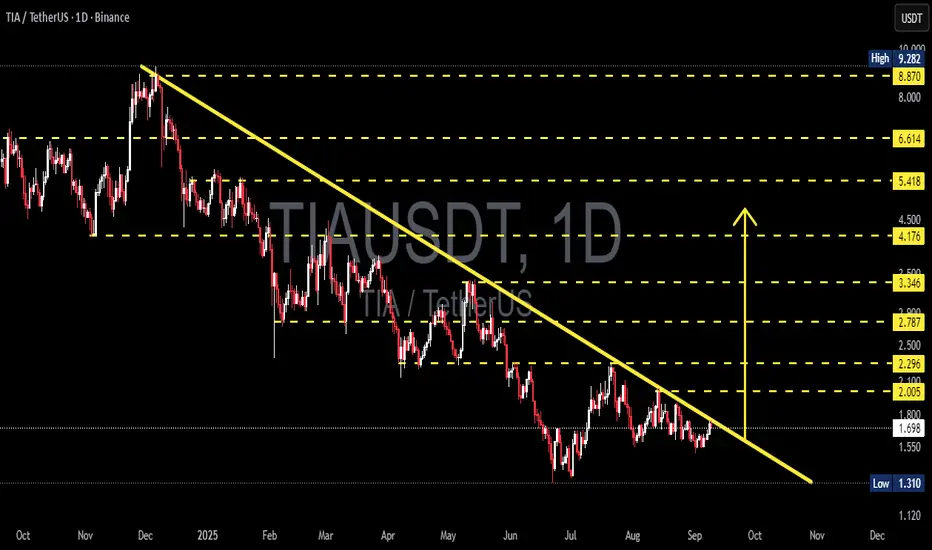
The daily chart (1D) of TIA/USDT shows that price action remains within a clear medium- to long-term downtrend. This is reflected by a series of lower highs & lower lows, all connected by the dominant descending yellow trendline.
Right now, the price is sitting at a critical crossroads — testing the trendline after months of trading below it. This is the moment that will determine whether TIA is ready to begin a bullish reversal or continue its extended bearish cycle.
---
🟢 Bullish Scenario
If TIA manages to break and close above the descending trendline with strong daily volume, the probability of a trend reversal increases significantly.
Step-by-step upside targets (based on chart levels):
2.005 USDT → first psychological resistance.
2.296 USDT → key supply zone, strong seller area.
2.787 USDT → next breakout confirmation zone.
3.346 USDT → mid-term bullish validation.
Breaking above 3.346 could open the path toward 4.176, 5.418, and higher.
Important note: a breakout without volume confirmation is often a false breakout.
---
🔴 Bearish Scenario
On the other hand, if the price fails to break the trendline and faces rejection, sellers will likely regain control.
Downside possibilities:
Price revisits 1.55 – 1.60 USDT zone.
Stronger sell pressure could drag it down to 1.310 USDT (critical support).
A breakdown below 1.310 USDT with heavy volume may trigger a capitulation wave, sending price into deeper lows.
In short: as long as price remains under the descending trendline, the overall trend stays bearish.
---
📐 Pattern & Structure
Main trend → Continuous downtrend since peak around 9.282 USDT.
Pattern → Descending trendline resistance that has rejected every rally attempt.
Critical support zone → 1.310 USDT (structural base).
Potential accumulation area → 1.3 – 1.7 USDT, seen from repeated bounces.
This structure resembles a descending channel with base-building. A breakout would shift momentum from bearish to neutral-bullish.
---
🎯 Conclusion
Bullish case → Trendline breakout + volume → upside targets at 2.0 → 2.3 → 2.7.
Bearish case → Rejection at trendline → downside toward 1.55 → 1.31.
Key focus: market’s reaction at the yellow trendline will dictate the next major move.
We are at a decision point: either TIA breaks out to start a recovery phase, or sellers take control again for another leg down.
---
#TIA #TIAUSDT #CryptoAnalysis #Altcoin #Breakout #Bearish #Bullish #ChartAnalysis #PriceAction #SwingTrade #TechnicalAnalysis #RiskManagement
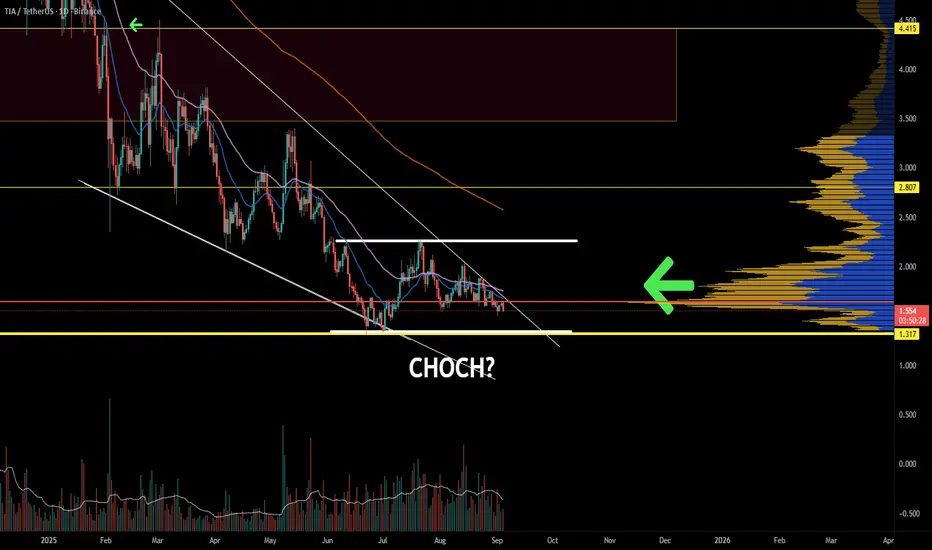
Celestia is still within range = nothing has happened. TIA could still revisit range lows and still sweep those lows before achieving a proper CHOCH. The concern is that momentum and trend oscillators are not completely oversold; however, they are stuck in the chop zone. As long as the structure does not break, a pivot point can still be achieved here.
TIA/USDT Testing Downtrend Line: Reversal or More Downside?Summary:
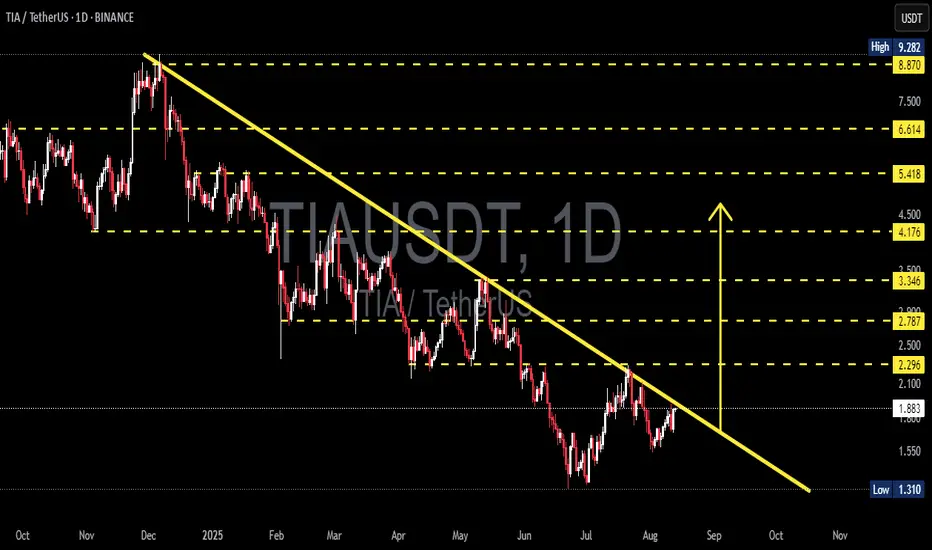
TIA price remains below the main descending trendline (yellow) drawn from the Dec–Jan peak. Price is currently hovering around $1.87–$2.00, right under the key $2.00–$2.10 resistance zone and the trendline. This is a decision zone: a breakout could trigger a reversal, while rejection could extend the bearish trend.
---
Key Structure Levels (from chart)
Support: $1.75–$1.80 (minor), $1.62, $1.31 (major low).
Resistance: $2.00–$2.10, $2.296, $2.787, $3.346, $4.176, $5.418, $6.614, $8.870 (near ATH $9.282)**.
---
Pattern & Context
Daily downtrend still dominant (series of lower highs) with the descending trendline acting as dynamic resistance.
Since mid-July, price has formed higher lows from $1.31 → gradually consolidating toward the trendline.
If $2.10 is treated as a “neckline” of a short-term accumulation, measured move = (2.10 − 1.31) ≈ $0.79 → conservative upside target ≈ $2.90 (aligns with $2.787 level).
---
Bullish Scenario
Trigger:
Daily close above the trendline + $2.10, ideally followed by a retest of $2.00–$2.10 as support.
Step targets:
$2.296 → $2.787 → $3.346 → $4.176.
Structure projection: ≈ $2.90 (around $2.787).
Invalidation / Risk:
Daily close back below $1.80 after breakout, or a failed breakout above $2.10 without follow-through.
---
Bearish Scenario
Trigger:
Strong rejection at the trendline / $2.00–$2.10 with a decisive bearish candle.
Downside targets:
$1.80 → $1.62 → $1.31 (key low).
Break below $1.31 opens deeper bearish territory ($1.20–$1.00 psychological zone).
Invalidation / Risk:
Daily close above $2.10 would cancel the short-term rejection setup.
---
Action Plan (not financial advice)
Bullish: Wait for confirmation above $2.10 with volume/follow-through; target $2.29 / $2.79 / $3.35; manage risk below retest level.
Bearish: Watch for pin bar/engulfing rejection at the trendline/$2.00–$2.10; target $1.80 / $1.62; invalidation if daily closes > $2.10.
#TIA #Celestia #TIAUSDT #CryptoTA #PriceAction #SupportResistance #Trendline #BreakoutWatch #DailyTimeframe #BearishVsBullish
TIA Holding Support – Break Above $2.20 Could Trigger Big MoveLast week, I mentioned that TIA could be preparing for a move and that buying dips around $1.75 might be a good opportunity.
Well, price dropped exactly into that support zone, bounced slightly, and is now consolidating, which could be the calm before the next wave.
________________________________________
📌 Here’s what I’m watching:
• The $2.10–$2.20 zone is now a confluence resistance area (horizontal + descending pressure)
• A break and daily close above this level could trigger a strong leg up, with the next major target around $4.00
________________________________________
📈 Bias remains bullish
As long as $1.70 holds, this setup stays valid, and dips continue to be buyable.
________________________________________
🎯 Trading Plan:
• Looking to buy dips toward $1.80–1.85
• Acceleration expected only above $2.20
• Bearish invalidation only below $1.70
________________________________________
Conclusion:
TIA is respecting structure perfectly. If it breaks above $2.20, we could be looking at a potential double in price toward $4.
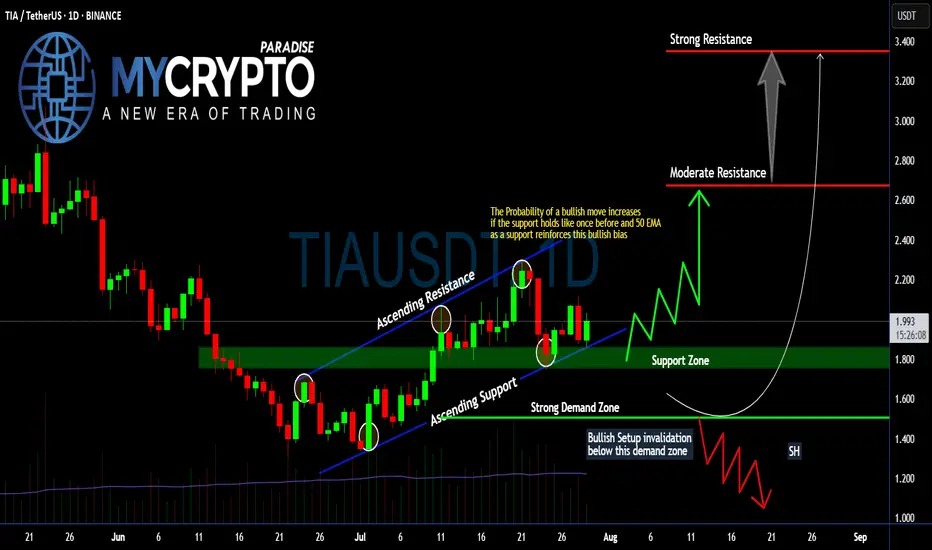
Will #TIA Continue to Soar or Bears Can Halt it? Must Watch Yello, Paradisers! Will we see #TIA continue to soar from here, or can bears halt its momentum? Let's see the latest setup of #Celestia to see what's going to happen:
💎Following a textbook ascending channel structure, #TIAUSDT has been respecting both its ascending resistance and ascending support, with each touchpoint confirming trader participation and growing confidence. Price is currently holding above the 50 EMA and within a crucial support zone between $1.80–$1.90—an area that previously triggered a strong impulse move to the upside.
💎The probability of a bullish continuation increases significantly as long as the #TIAUSD respects this support zone and the 50 EMA acts as dynamic support. If this level continues to hold, we expect a move toward the moderate resistance around $2.67, the key area where sellers previously stepped in aggressively.
💎But that’s not all—if bulls gain momentum and break above $2.67 with strong volume, the next price magnet becomes the $3.34 level, where strong resistance and high-volume node overlap. This level would likely be the point of exhaustion unless broader market momentum takes over.
💎However, caution is critical here. If price breaks below the strong demand zone around $1.507, this invalidates the bullish structure entirely and opens the door for a swift move down toward the $1.20–$1.00 range, where a potential market shakeout could occur. Remember, a failed bullish setup often becomes a powerful bear trap for undisciplined traders.
Stay patient, Paradisers. Let the breakout confirm, and only then do we strike with conviction.
MyCryptoParadise
iFeel the success🌴
Celestia · A Strong Bullish Wave of GrowthCelestia right now looks pretty good. This one was called to my attention by one of my followers in the comments. The truth is that we've been looking at TIAUSDT and right now it continues to look good. The candles message is that the action is about to transform into a very strong advance. The action has been sideways for so long, with a bearish bent, that we can forget that the market always changes. We might forget that right around the corner there is big change. Everything is about to change and for the better that's what I know after looking at hundreds of charts. Celestia is the same.
Looking at the chart from a neutral standpoint, it is hard to predict what I am predicting because all we see is the same followed by more of the same. And that's my point, the market is always seeking change. It has been the same for too long and so everything changes now. The change is always the contrary to what was previously happening. So Celestia was down then sideways moving lower, and this will change into higher highs and higher lows. A strong bullish wave of growth.
Namaste.

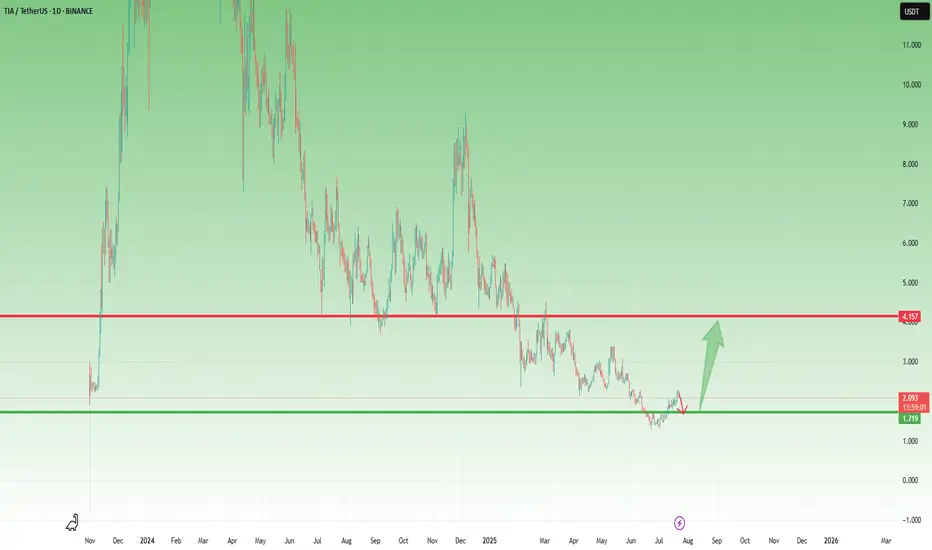
TIA- Is the Coin Finally Ready to Wake Up?After its launch on Binance in November 2023 and the immediate 10x pump, BINANCE:TIAUSDT has been, to put it mildly, a constant disappointment.
Since then, the hype has faded, and the price slowly deflated — leaving holders frustrated and the chart uninspiring.
🔍 Recent Signs of Life
However, something has started to shift.
After a fresh dip to 1.35, the coin formed a small double bottom and managed to recover above the 2.00 zone.
⚠️ Important to note: the rise hasn’t been impulsive.
But in the context of a broader altcoin revival — which I've outlined in my recent dominance analyses — TIA could become a decent candidate for a relief rally.
🔽 What I’m Watching
The recent structure looks like a bearish flag, and there’s a decent chance the pattern breaks down first before any real rally begins.
That’s why I’m watching the 1.70 area closely.
If price dips into that zone and gives a positive reversal signal, I’ll look to buy the dip.
🎯 Target and Potential
My upside target for this move is around 4.00, which would represent over 100% potential from the entry zone.
No moon calls. Just technical setup + potential market rotation + favorable risk/reward.
✅ Conclusion
TIA isn’t a favorite.
But sometimes, unloved charts offer the cleanest reversals.
I’ll let the market speak near 1.70.
If it holds and gives confirmation — I’m in. 🚀
CelesTIA, All-Time Low Last Month, Trend Change—2025 Bull MarketI am showing multiple charts but my prediction is that the market will turn—the entire Cryptocurrency market—the altcoins market will turn bullish.
CelesTIA
There is an uptrend between late 2023 and early 2024, the same with the rest of the market. There was also a bullish wave late 2024. Huhhh, there will be an uptrend in late 2025 and early 2026.
Ok. Celestia. TIAUSDT.
It is easy to distinguish the downtrend vs no more downtrend.
The period drawn orange did produce lower lows but it is very different compared to the "downtrend," red on the chart.
So this is the transition. Strong down, then sideways, then up.
This pair is producing lower lows in its consolidation period but I also showed you many pairs that are producing higher lows, it makes no difference. Lower lows or higher lows, the action is very different compared to the "downtrend." The downtrend is no more.
My thesis concludes with a change of trend. This is where everything is leading, hundreds and hundreds of charts, more than 500 since 7-April. They all say the same.
In short, these hundreds of charts are saying that the market is about to become extremely bullish and that is something that we welcome with open arms. Actually, we have been waiting patiently, and some not so patiently, for this change to occur.
Many trust me; trusted me;
Many doubted me and that is also ok.
I love the truster and the doubter...
I love the reader and the follower...
I love TradingView and the Cryptocurrency market; but I will be proven right in the end.
I accept the fact that it is impossible to get it always right. I accept the fact that many times I am so, so very wrong.
You have to accept the fact that time is running out, Crypto is going up.
Celestia just hit a new all-time low and this is awesome news for me and for you, because, from this bottom low we will grow. You can mark these words... Just watch!
I would like to take just a few seconds of your time to say, thank you. Time is precious, and you took the time to read this long. If you enjoy the content, make sure to follow.
Thanks a lot for your continued support.
There is only one Cryptocurrency market, this is us.
It is you and me, it is all of us. It is not the whales or the exchanges. We are the whales and the exchanges. We are the government, the institutions, the programmers, the designers; the owners, the planners, the coders, the security expert, the writer, the reporter, the auditor; the professor, the mom, the father and the son. You are the market. You are it. You are the whole thing, the whole world.
You might think yourself unimportant as just a tiny ray of light, but there is no life without the sun. You being light, you permeate everything that exist around us. So you are the Cryptocurrency market. You are Bitcoin and you are the altcoins.
Namaste.

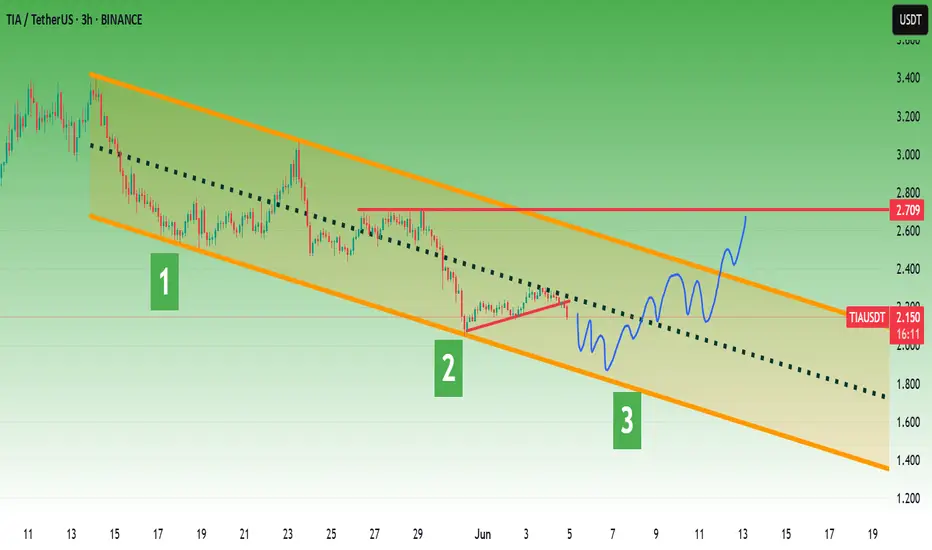
Celestia (TIA) – Ascending Triangle Setup (4H)BINANCE:TIAUSDT is printing a clean ascending triangle on the 4H chart, signalling a potential reversal.
Key Levels
• Support: Ascending trendline
• Resistance: $2.30 – a key level that acted as support since early April
• Measured Target: $2.50–$2.55 – aligns with prior support area
• Watch out for the longer-term descending trendline, which could act as resistance on breakout around ~$2.40
Breakout Trigger
A solid 4H close above $2.30 with convincing volume could confirm the move
Invalidation
A sustained break below the ascending support would fully invalidate the setup and potentially lead to a drop to $1.70

Tia bearish short term.To me the view is pretty clear.
* The purpose of my graphic drawings is purely educational.
* What i write here is not an investment advice. Please do your own research before investing in any asset.
* Never take my personal opinions as investment advice, you may lose your money.
Celestia TIA price analysis#TIA price currently looks “weak,” gradually sliding down and updating lows.
A “ray of hope” may be a repeat of the fractal behavior of the OKX:TIAUSDT price from last year, when, after the third slight update of the low, the price began to rebound upward.
If we take this fractal as a basis, then in the near future, the price of the #Celestia token should rebound to $4, followed by a correction and continued growth to $5.55.
_____________________
Did you like our analysis? Leave a comment, like, and follow to get more

TIA NEXT TERMMy scenario is like this.
* The purpose of my graphic drawings is purely educational.
* What i write here is not an investment advice. Please do your own research before investing in any asset.
* Never take my personal opinions as investment advice, you may lose your money.

The key is whether it can rise above 3.211
Hello, traders.
If you "Follow", you can always get new information quickly.
Have a nice day today.
-------------------------------------
(TIAUSDT 1D chart)
The basic trading strategy is to buy near the HA-Low indicator and sell near the HA-High indicator.
However, if the HA-Low indicator falls, there is a possibility of a stepwise downtrend, and if the HA-High indicator rises, there is a possibility of a stepwise uptrend.
Therefore, when the HA-Low indicator is first created, the probability of rising is higher than the probability of falling, and when the HA-High indicator is first created, the probability of falling is higher than the probability of rising.
If the HA-Low indicator rises and then meets the previously formed HA-Low indicator again, the probability of falling is higher.
On the contrary, the HA-High indicator has a higher probability of rising.
You should check the movement of the chart with these characteristics in mind.
However, you should comprehensively judge the correlation between the OBV indicator and the StochRSI indicator.
-
From a trend perspective, since the M-Signal of the current 1D chart is < M-Signal of the 1W chart, you can see that it is in a reverse arrangement.
Therefore, when trading in a reverse arrangement, it is recommended to trade for a short period of time using day trading.
Therefore, if it shows a price that rises above the M-Signal indicator of the 1W chart and maintains the price, it is highly likely that a trend will be formed that can be traded.
In other words, when looking at the current price position, it can be seen that it can be traded for a short period of time or longer only when it rises above 3.211 and shows support.
-
Since the HA-Low indicator is formed at the 2.490 point, the price must be maintained above this point.
If not, there is a possibility of an additional stepwise downtrend, so you should think about a countermeasure for this.
-
If the average purchase price is significantly higher than the current price, you should not buy too much and increase your investment ratio.
In this case, it is better to trade with a relaxed mind and faithfully follow the basic trading strategy.
However, it is better to trade by increasing the number of coins (tokens) corresponding to the profit realization method and increasing the number of coins (tokens).
In other words, trade by purchase price.
If you bought 100 USDT at the current price of 2.840, you should sell 100 USDT when the price rises and shows resistance at 3.211.
In this case, only the number of coins (tokens) corresponding to the profit will remain.
At this time, you should be careful about the transaction fee.
Since you have to sell the purchase amount including the transaction fee, the actual selling amount when you place an order is not 100 USDT.
The transaction fee rate varies depending on the exchange.
For example, if the trading fee is 0.1%, you can trade 100USDT - (100USDT x 0.2%) = 99.8USDT.
-
Thank you for reading to the end.
I hope you have a successful trade.
--------------------------------------------------
- Here is an explanation of the big picture.
(3-year bull market, 1-year bear market pattern)
(3-year bull market, 1-year bear market pattern)
I will explain the details again when the bear market starts.
------------------------------------------------------

Celestia: Easy New ATH $33 & Mid-Term Target $14 (TAC-S6)Good afternoon my fellow Cryptocurrency genius, you have great timing and also a great choice here.
Celestia's bottom came in just a month ago, 7-April. This date is the same date when the entire Cryptocurrency market hit bottom, with some exceptions of course.
After the low 7-April TIAUSDT starts to recover but very slowly. Notice that there is no big volume candles after this low.
Now, today, notice the difference... The big green candle is supported by really high volume after a local higher low. This confirms the 7-April low as the corrective cycle bottom and thus the start of a bullish phase.
Growth will be really strong for this pair, really strong... It will be amazing that I am certain of. You can count on it.
» The first target is very easy and reaches $14 ($13.88). Profits potential from current price is 410%.
» The second target is a new All-Time High at $33 ($32.88) and this one while a new ATH should be easy to hit. High probability I mean. Profits potential reaches 1,109%. That's more than 12X.
So, all is good. Timing is right, the price is right... A great Top Altcoin Choice (TAC).
Thanks a lot for your support.
Namaste.

TIAUSDT — 2025 Technical RoadmapTIAUSDT — Daily Technical Roadmap
🕞 60-Second Read
Trend on the 1-D chart is still structurally bearish ; price (spot 2.865 USDT) just carved a higher-low off the 2.44 vector block and is knocking on the Yearly BC lid. Two large upside voids now beckon.
Hot-Zone #1 – 2.60 → 2.44 (1 D + 4 H vector demand): stacked fresh liquidity, 9-15 % under spot.
Hot-Zone #2 – 2.985 (Yearly BC): first breaker & range cap, only 4 % above; a daily close above here opens the air-pocket to 4.27.
Hot-Zone #3 – 4.932 → 6.947 (Yearly Pivot ↔ Yearly TC): macro supply shelf guarding a 72-142 % rally window.
💧 Liquidity & Imbalance
Daily vector 7.85 (77 % fill-rate inside 60 d).
Stacked 4 H vectors 9.86 / 9.83 = 2.5 % supply shelf.
Demand stack 2.69 – 2.44 only 18 d old.
⚡ Volatility & Momentum
GMMA Z-Score curling up from −2 σ; short ribbons still under long ribbons – suggests pause, not reversal.
🎲 Probability Dashboard
HTF Structure −3
Liquidity voids +1
Momentum −1
Vol-regime 0
Bear / Neutral / Bull ≈ 42 % / 33 % / 25 %
📈 Trade Playbook
Strategy 1
1. Layered Limit Grid – Aggressive Counter-Trend Long
Entry layers (size %):
2.60 – 40 % of your allocated TIAUSDT size
2.44 – 30 %
2.05 – 20 %
1.90 – 10 %
SL = 1.75 (≈ 1 ATR below extreme demand)
TP ladder:
2.985 – 25 % off-load
3.722 – 25 %
4.932 – 25 %
6.947 – 15 %
7.849 – 10 %
Weighted R:R ≈ 4.3
Strategy 2
2. Layered Limit Grid – Conservative Breakout Long
Trigger: daily close > 3.722 (Yearly Low reclaim), then place grid orders.
Entry layers (size %):
3.75 – 40 %
3.55 – 30 %
3.25 – 20 %
2.985 – 10 %
SL = 2.70
TP ladder:
4.932 – 30 %
6.947 – 30 %
7.849 – 20 %
9.860 – 15 %
12.432 – 5 %
Weighted R:R ≈ 3.8
⚠️ Risk Radar
Low-float token – slippage risk on size.
Macro event: FOMC 1 May → volatility spike possible.
BTC options IV rising – spill-over risk to alts.
Price must conquer 2.985 to open the upside magnet trail toward 4.27 → 4.93. Failure keeps 2.60 → 1.90 demand stack in play before any durable markup.
Not financial advice – do your own research & manage risk.

TIA: Crazy Risk to Reward Ratio#Tia faced steep losses since Dec 2024, underperforming similar coins.
Now near its ATL, it presents a high risk-to-reward setup.
Below $2.10 is the stop-loss, while passing above $3.80 signals a bullish reversal in trend with higher targets ahead.
#Celestia
TIA | Next Altcoin to MOON ??In the macro, it's clear that TIA has been in a downward trend for an extended period of time. This means, it's a great place to buy - because the bullish cycle is up next.
In an earlier publication, I made an update about the ideal entry point for TIA:
A key indicator to watch is the daily timeframe, when the price begins to trade ABOVE the moving averages - that's when you'll have the first confirmation of a bullish turn around. It is a bullish sign to see the gradual higher lows.
Moving Averages:

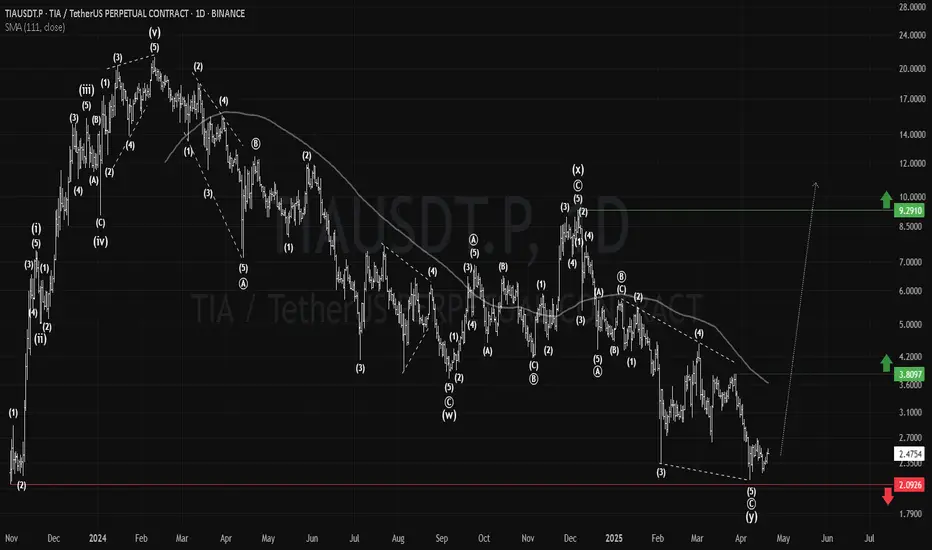
TIAUSDT - analysis of the downtrend phase and potentialProject :
Celestia is one of the key players in the new generation of modular blockchain architecture. Unlike traditional monolithic solutions, it separates the execution and consensus layers. This provides flexibility, scalability, and creates the infrastructure for rollup and L2 ecosystems.
📍 CoinMarketCap: #47
📍 Twitter (X): 397.7K
____________________________________________________________
🔎 Technical picture :
I marked the Seed / Series A / Series B zones on the chart — it's clear how early investors locked in massive profits: from listing, the price skyrocketed +634%, and their returns are many times higher!)
From the current levels, the price is down ~87% from its all-time high.
Formation: the price is moving inside a large descending channel. At the same time, a potential “cup” structure and a possibly emerging ascending channel are forming.
We are close to the lower boundary of these formations — it's an interesting zone.
A final sweep/fakeout toward the lower boundary of the descending channel is possible — keep this in mind when calculating risk.
Key level: the orange trendline marks the boundary of the secondary trend. A confident breakout and hold above it would be one of the reversal signals.
____________________________________________________________
💡 General conclusions :
Liquidity — solid.
The coin is traded on major exchanges.
Trend potential is marked on the chart.
As always — everything depends on your strategy and patience.
____________________________________________________________
📌 This review is not financial advice but my personal analysis and observations on the project.

TIA: 40% Crash in Sight – What's Next?TIA recently lost its strong $4 support, and that level is now acting as resistance. For the past two months, the price hasn’t been able to climb back above $4, leaving us with one burning question: Is more blood on the table?
Broken Support: TIA has given up its $4 support, which now serves as resistance.
Looking at November 2024: The low from November 2024 was around $1.9. Revisiting that level could provide us with a high-probability long trade.
Trade Setup Opportunity
Entry Point: Set an alarm for the $1.9 low. A successful bounce here would signal a potential long trade opportunity.
Target & Reward: With the goal of targeting the $3 level, this trade could offer a risk-to-reward ratio of at least 5:1.
Implication: If the $1.9 level is revisited and holds, we could be looking at a scenario with roughly 40% more downside in the current trend—but also a setup for a low-risk long if the bounce holds.
