CESC Set to Ignite: Key Levels Triggering a Bull MoveThis is the daily and 4-hour timeframe chart of CESC.
The stock is moving within a well-defined parallel channel, with a support zone in the 160–163 range.
The Supertrend indicator is positive and suggests an additional support zone around 165–167.
CESC is forming a rising wedge pattern, and after the breakout, the stock has retested the pattern’s resistance, which may now act as support near the 165–167 zone.
If this support zone holds, we may see higher prices in CESC.
Thank you.
CESC

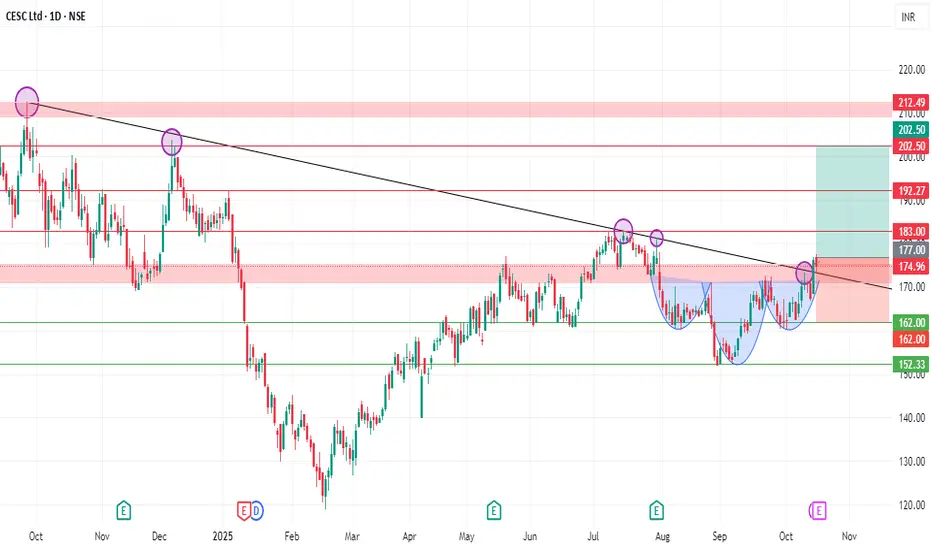
CESC Stock Looking Strong For Longterm REASON TO GO LONG:
Technically: This stock given a STRONG Trendline Breakout with STRONG Volume, Where the Trendline acts as a Resistance and rejected their many times, This stock consolidating since 3 months in a range and formed Head and Shoulder which gives more confirmation.
Fundamentally: This Company Maintaining Decent Dividend and Compared to previous quarter, Recent Quarter Sales & Operating Profit, Net Profit improved
And this stock have 52.11% Promoters Holding
Good To Buy above 177 and The Target is 192, 202+, Stoploss Should be at 165.
#Good For Short Term Also
Note: Just My View...Not a tip or advice
#Thanks For Checking My Idea, I Hope it sparked some value for you
🙏Follow for more insights
✅Boost if you found it helpful
📝Drop a comment with your thoughts below..!
CESC on the Verge of Upside Momentum – Buy SuggestedCESC Breakout Update (4H Chart)
The stock has given a breakout on the 4-hour timeframe.
The short-term polarity zone, earlier acting as resistance, is now expected to act as support around 158–160 levels.
If the stock sustains above this zone, we may see further upside momentum.
Potential Targets: 170 / 180

Review and plan for 2nd July 2025 Nifty future and banknifty future analysis and intraday plan.
Swing idea.
This video is for information/education purpose only. you are 100% responsible for any actions you take by reading/viewing this post.
please consult your financial advisor before taking any action.
----Vinaykumar hiremath, CMT

CESC Ltd – Short-Term Breakout Idea|Target: ₹171.00 CMP: ₹165.70
Recommended Buy Range: ₹164.50 – ₹165.00
Target: ₹171.00 🎯
Stop Loss: ₹161.50 🛡️
Timeframe: 15 min & 1H
Risk-Reward: ~1.4:1
Type: Momentum Breakout / Swing Trade
🔍 Technical Analysis:
✅ EMA Cross (9/13) bullish crossover
✅ Price trading above EMA-26
✅ RSI at 65 – bullish, not overbought
✅ BB %B around 1.0 – strong upper band breakout
✅ Volume spike supports the move
Watch for a strong close above ₹167 to confirm momentum toward ₹171.
For Education Purposes Only

CESC potential breakout Out of the base / Base on Base setup
High relative strength
VCP formation
Low risk entry

CESC - BREAKOUT STOCK TO BUY FOR SWING TRADINGSUPPLY ZONE & BREAKOUT STOCK
Breakout point - 150
ENTRY - 150
SL - 140
TARGETS - 180
Disclaimer - All information on this page is for educational purposes only,
we are not SEBI Registered, Please consult a SEBI registered financial advisor for your financial matters before investing And taking any decision. We are not responsible for any profit/loss you made.

#SWANENERGY 291 Tgt 30% Upside Recommended BUY - Rachit Sethia$NSE:SWANENERFY
#SWANENERGY 291
TGT 375
SL 270
TF < 6M
RR > 4
RETURN 30%
Factors: BULLISH WEDGE BREAKOUT Trend Following Rising Volume with rising Prices. Flag pattern breakout. Pennant Pattern Breakout with Bullish Candle. Retest Successful. Higher Highs & Higher Lows. Broken above RESISTANCE levels Trading at SUPPORT levels Earnings are strong. Bullish Wedge Breakout Risk Return Ratio is healthy. And Rising from Double Bottom Pattern to Flag Pattern forming. If you like my work KINDLY LIKE SHARE & FOLLOW this page for free Stock Recommendations. With 💚 from Rachit Sethia

CESC HEADING TOWARDS 154 ??cess is in tight range after a uptrend
stock is in good volume collection and getting it self ready for next move towards the 154 levels which is 13-14% from current levels
retest zone marked and all target and levels also on chart

CESC is ready to breakout channel patternNSE:CESC is ready to break channel pattern in upside.
Technically volume levels are good as up move is with high volume and down move is with less volume.
Financials too looks good.
Key note : Always follow proper risk management to avoid losing capital from false breakouts as this is common.
Caution : This is a knowledge sharing analysis, not a call.
Profits are not made from following ideas, but by following Risk Management .

CESC - Range bound in 65-95 for 15 monthsThis was after being up 3x from 20-65 in Jan-2021
Plan ahead, consider to Buy above 85
- and/ or Rejections near 65 or 50
PB 1x
PE 7x
DE 1.5
ROCE 11%
DivY 6%

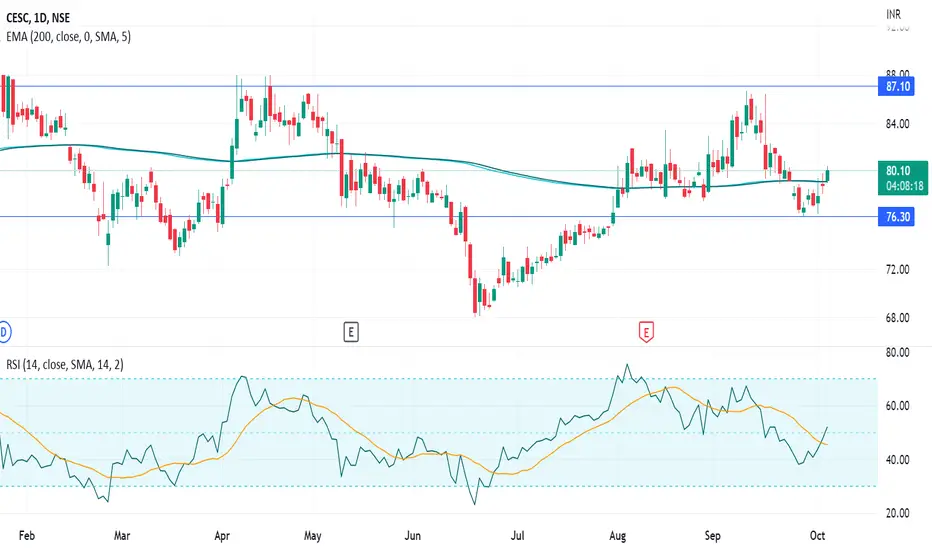
CESCI bought CESC
1. Candle breaching 200 EMA
2. RSI has a bullish crossover
SL 75 for T1 85 & T2 95
Positional trades
CESC ReversalThe stock has reached lower trendline and may undergo a reversal rally. Trade is supported by brokerage calls and Supports Nearby.
Risk Reward Ratio - 3:1
SL is placed below support zone & the lower trendline. The target is placed near resistance.
Market is bearish, so take positions carefully.

CESC LTDPassed the below parameters, weekly Congestion, fib retracement golden zone broken, RSI above 60, increasing volume. Let's wait and watch this stock

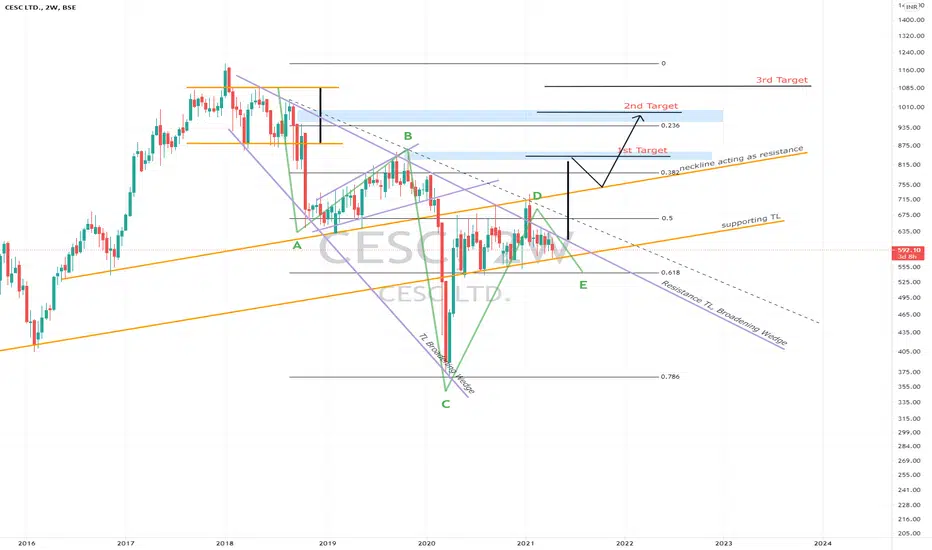
CESC LTD (Y21.P2.E1).Broadening wedge breakoutCESC LTD (Y21.P2.E1).Broadening wedge breakout
Hi Investors and traders,
I was looking to do some case studies for formations and trends for my online training and I came across this stock.
Hence while I was documenting from a TA perspective (chart below), I thought I also publish this and the potential opportunity based on the broadening wedge approach.
Its also for me to see where I get it right and wrong.
My thoughts:
Currently still some downward pressure;
Support at this level is strong for a number of factors; fib and pre existing TL.
If I was to trade this, I would be looking for a breakout from the resistance TL and depending on the level and candlestick, will decide my entrance.
If you benefit, all the better.
Please give me a tick or like for this post,
Regards,
S.SAri
Big Picture TA, a lot of it makes sense.
s3.tradingview.com
CESC - INVERTER HEAD AND SHOULDER PATTERNCESC closed exactly on resistance at 668 today and completed inverted Head and Shoulders pattern. Closing above 668 will give a good upside with an immediate target of 700-715 atleast.


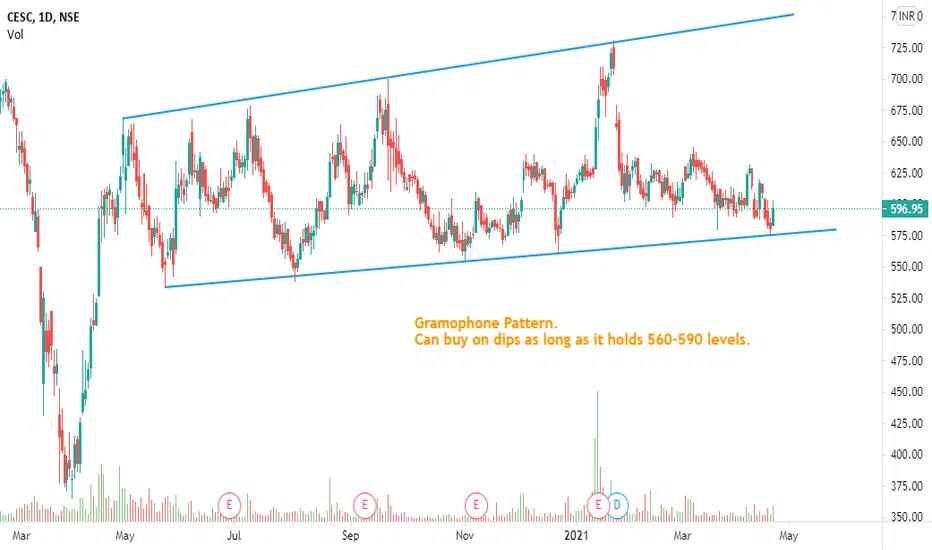
CESC VenturesCMP - 225
Simple Chart with clean patterns i.e.Flow in a range and Breakout.
The last breakout had a good volume.
*****
Help Me to Help Us.
I believe in keeping the chart simple with minimal drawings & easy to interpret.
So kindly express any disagreement & improvements so that we learn & earn together.
Please support the effort and appreciate it with a Like if you felt it deserves it and Following me would only add on to the motivation.

