CESC Set to Ignite: Key Levels Triggering a Bull MoveThis is the daily and 4-hour timeframe chart of CESC.
The stock is moving within a well-defined parallel channel, with a support zone in the 160–163 range.
The Supertrend indicator is positive and suggests an additional support zone around 165–167.
CESC is forming a rising wedge pattern, and after the breakout, the stock has retested the pattern’s resistance, which may now act as support near the 165–167 zone.
If this support zone holds, we may see higher prices in CESC.
Thank you.
Cesclong

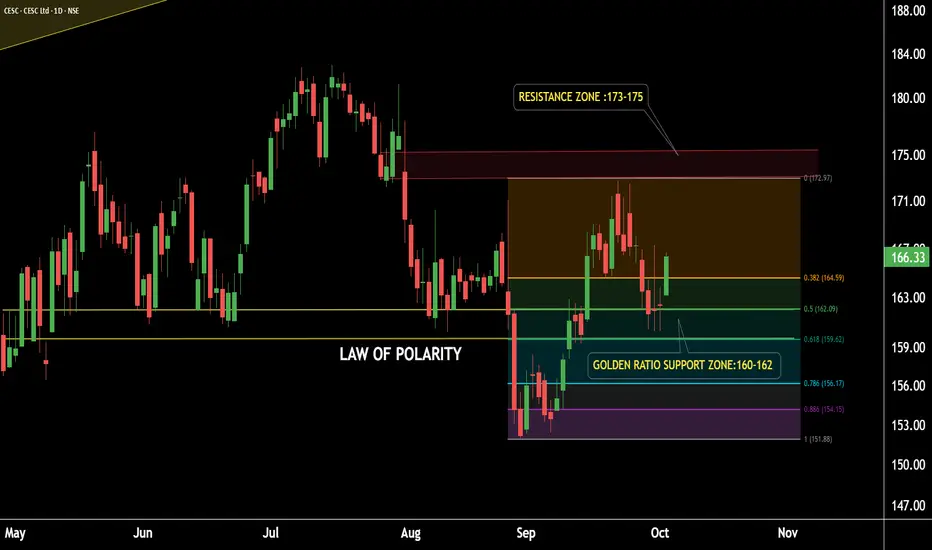
CESC on Fire - Strong Momentum Building !CESC Daily Timeframe Analysis
CESC is sustaining above its Law of Polarity (LOP) after a breakout.
The stock has successfully retested the LOP and is showing strength.
This level also aligns with the Golden Ratio Zone of Fibonacci Retracement, representing a strong support zone around 159–162.
Potential Upside Target: 172–175.
If the support zone sustains, we may see higher prices in CESC.
Thank you!
CESC HEADING TOWARDS 154 ??cess is in tight range after a uptrend
stock is in good volume collection and getting it self ready for next move towards the 154 levels which is 13-14% from current levels
retest zone marked and all target and levels also on chart

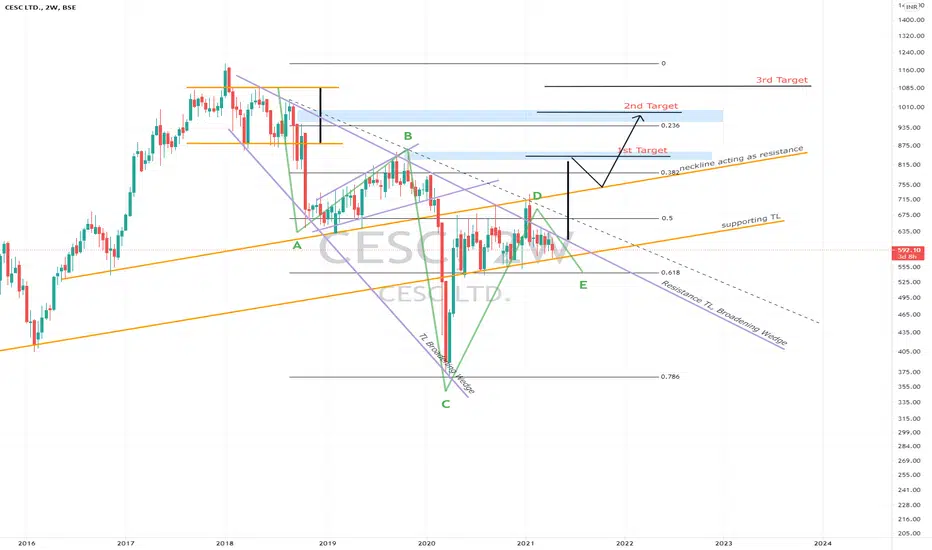
CESC LTD (Y21.P2.E1).Broadening wedge breakoutCESC LTD (Y21.P2.E1).Broadening wedge breakout
Hi Investors and traders,
I was looking to do some case studies for formations and trends for my online training and I came across this stock.
Hence while I was documenting from a TA perspective (chart below), I thought I also publish this and the potential opportunity based on the broadening wedge approach.
Its also for me to see where I get it right and wrong.
My thoughts:
Currently still some downward pressure;
Support at this level is strong for a number of factors; fib and pre existing TL.
If I was to trade this, I would be looking for a breakout from the resistance TL and depending on the level and candlestick, will decide my entrance.
If you benefit, all the better.
Please give me a tick or like for this post,
Regards,
S.SAri
Big Picture TA, a lot of it makes sense.
s3.tradingview.com
CESC Long Setup [Intraday]NSE:CESC Long at 763.90 with SL at 754.05. There are three potential targets.
Note:
Please Consult Your Financial Advisor Before Taking Any Decision
Always risk 1% of account size per trade, adjust the position size accordingly
