CESC Set to Ignite: Key Levels Triggering a Bull MoveThis is the daily and 4-hour timeframe chart of CESC.
The stock is moving within a well-defined parallel channel, with a support zone in the 160–163 range.
The Supertrend indicator is positive and suggests an additional support zone around 165–167.
CESC is forming a rising wedge pattern, and after the breakout, the stock has retested the pattern’s resistance, which may now act as support near the 165–167 zone.
If this support zone holds, we may see higher prices in CESC.
Thank you.
Cesctechnicalchartsetup

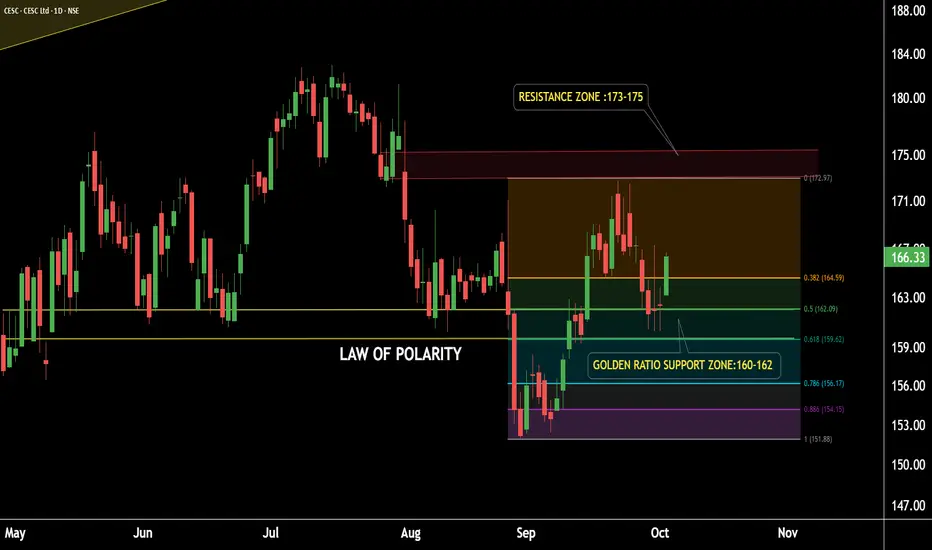
CESC on Fire - Strong Momentum Building !CESC Daily Timeframe Analysis
CESC is sustaining above its Law of Polarity (LOP) after a breakout.
The stock has successfully retested the LOP and is showing strength.
This level also aligns with the Golden Ratio Zone of Fibonacci Retracement, representing a strong support zone around 159–162.
Potential Upside Target: 172–175.
If the support zone sustains, we may see higher prices in CESC.
Thank you!