CETUSUSDT — Major Rebound or Deeper Breakdown?CETUS is now testing a critical support zone between 0.0528 and 0.043, a level that has historically acted as a major demand base since 2023. The latest 3D candle shows a massive liquidity wick down to 0.0185, followed by a sharp rebound — a strong signal of a potential bear-trap or early accumulation phase forming at the bottom.
The broader trend remains bearish, with a sequence of lower highs since the 2025 peak. However, this recent recovery suggests that buyers are trying to defend the last major support before a possible structural reversal.
---
🔹 Market Structure & Pattern
The yellow zone (0.0528–0.043) marks the last defense line for bulls.
The deep wick indicates a liquidity sweep / shakeout, often seen before major reversals.
As long as price stays above 0.043, there’s still a strong chance for a rebound setup.
---
🟢 Bullish Scenario
A confirmed 3D close above 0.0528 with strong rejection from below could mark the beginning of a new upward leg.
Potential targets on the way up:
0.084 → first resistance retest
0.119 – 0.1395 → mid-term supply zone
0.182 – 0.225 → next swing target area
A higher low above 0.043 would confirm that bulls are regaining control and building structure for a larger move.
---
🔻 Bearish Scenario
If the support box fails and price closes below 0.043, bearish continuation is likely.
Downside targets would then shift to:
0.025 – 0.020, and possibly a full retest of 0.0185 (the wick low).
That scenario would confirm that the latest recovery was only a dead cat bounce within a continuing macro downtrend.
---
⚖️ Conclusion
The 0.0528–0.043 zone is a make-or-break level for CETUS.
Holding this area could ignite a multi-stage recovery toward higher resistances, while a confirmed breakdown below it would likely lead to another capitulation leg.
This is the decision point where structure and sentiment will define the next phase of the trend.
---
📊 Trader’s Note
The long wick to 0.0185 shows that liquidity has been cleared — often a sign of smart money accumulation before a larger reversal. Wait for clear structure confirmation before entering; volatility here can easily trap both sides.
---
#CETUS #CETUSUSDT #CryptoAnalysis #BearTrap #LiquiditySweep #ReversalZone #SwingTrade #PriceAction #TechnicalAnalysis
Cetusignals

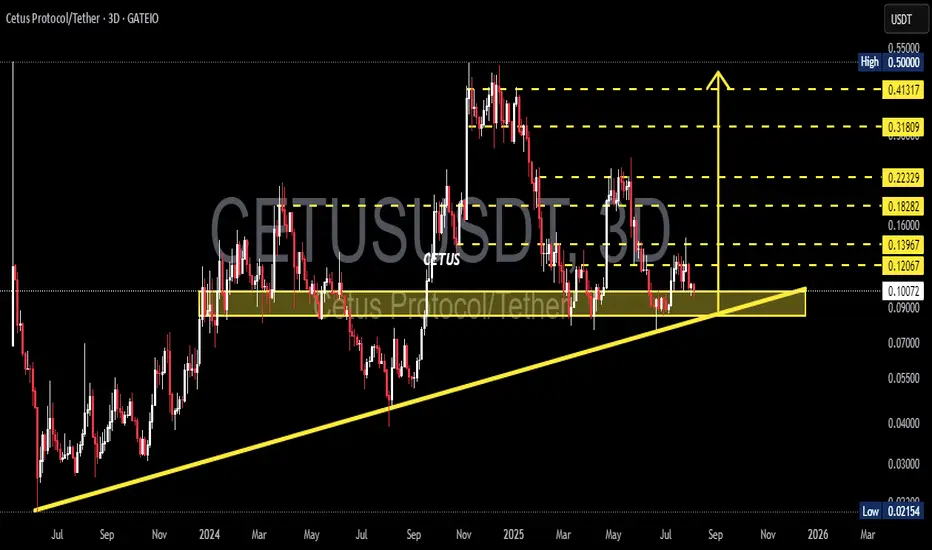
CETUS/USDT 3D — Awaiting a Major Decision at Key Support ZoneCetus Protocol (CETUS) is currently at a highly critical phase, trading just above a strong historical support zone that has repeatedly acted as a key price floor. The chart reveals a tight technical formation, signaling a potential for a significant move in the near term.
---
🔍 Technical Analysis:
Key Support Zone: $0.09000 – $0.10084
Price is currently testing a major demand area that has historically prevented deeper drops since mid-2023.
Ascending Trendline:
A medium-term trendline from 2023 remains intact, supporting a continued higher low structure.
Decreasing Volume:
Shrinking volume suggests the market is in a state of accumulation or awaiting a strong breakout catalyst.
---
🧩 Price Structure & Patterns:
Horizontal Consolidation above support → indicates potential accumulation phase.
Ascending Triangle Support (flat support + rising trendline) → this pattern is often a bullish continuation when followed by a breakout to the upside.
---
🐂 Bullish Scenario:
If price successfully bounces from the support zone, a step-by-step upward movement becomes likely, with the following targets:
Price Level Role Notes
$0.12067 Initial Resistance Minor rejection zone
$0.13967 Flip Zone Needs breakout confirmation
$0.16000 Mid-Range Resistance Key level for further upside
$0.18282 – $0.22329 Major Bullish Target Break above this signals trend recovery
$0.31809 – $0.41317 Long-term Resistance Potential full retracement zone
A clean breakout above $0.22329 with strong volume could signal a resumption of the long-term bullish trend.
---
🐻 Bearish Scenario:
If the price breaks down below $0.09000 and closes beneath the ascending trendline:
The higher low structure will be invalidated.
Potential downside targets:
$0.07000 (minor support)
$0.05500 – $0.04000 (psychological zones)
$0.02154 (historical low)
This would indicate a shift toward distribution and a broader bearish trend.
---
🧠 Suggested Trading Strategy:
🔁 Reversal Traders: Look for bullish candlestick confirmation (e.g., hammer, engulfing) at support zone.
💥 Breakout Traders: Wait for breakout and retest above $0.13967 before entering.
🛡️ Risk Management: Tight stop-loss below $0.09000, targets aligned with resistance levels.
---
📝 Conclusion:
CETUS/USDT is at a make-or-break level, sitting right above structural support and trendline confluence. A strong bounce here could offer a great risk-reward long opportunity, while a breakdown opens the door to further downside.
Patience and confirmation will be key.
#CETUSUSDT #CETUSProtocol #CryptoBreakout #TrendlineSupport #AltcoinAnalysis #ChartPattern #BullishSetup #BearishScenario #CryptoTechnicalAnalysis