CETUSUSDT — Major Rebound or Deeper Breakdown?CETUS is now testing a critical support zone between 0.0528 and 0.043, a level that has historically acted as a major demand base since 2023. The latest 3D candle shows a massive liquidity wick down to 0.0185, followed by a sharp rebound — a strong signal of a potential bear-trap or early accumulation phase forming at the bottom.
The broader trend remains bearish, with a sequence of lower highs since the 2025 peak. However, this recent recovery suggests that buyers are trying to defend the last major support before a possible structural reversal.
---
🔹 Market Structure & Pattern
The yellow zone (0.0528–0.043) marks the last defense line for bulls.
The deep wick indicates a liquidity sweep / shakeout, often seen before major reversals.
As long as price stays above 0.043, there’s still a strong chance for a rebound setup.
---
🟢 Bullish Scenario
A confirmed 3D close above 0.0528 with strong rejection from below could mark the beginning of a new upward leg.
Potential targets on the way up:
0.084 → first resistance retest
0.119 – 0.1395 → mid-term supply zone
0.182 – 0.225 → next swing target area
A higher low above 0.043 would confirm that bulls are regaining control and building structure for a larger move.
---
🔻 Bearish Scenario
If the support box fails and price closes below 0.043, bearish continuation is likely.
Downside targets would then shift to:
0.025 – 0.020, and possibly a full retest of 0.0185 (the wick low).
That scenario would confirm that the latest recovery was only a dead cat bounce within a continuing macro downtrend.
---
⚖️ Conclusion
The 0.0528–0.043 zone is a make-or-break level for CETUS.
Holding this area could ignite a multi-stage recovery toward higher resistances, while a confirmed breakdown below it would likely lead to another capitulation leg.
This is the decision point where structure and sentiment will define the next phase of the trend.
---
📊 Trader’s Note
The long wick to 0.0185 shows that liquidity has been cleared — often a sign of smart money accumulation before a larger reversal. Wait for clear structure confirmation before entering; volatility here can easily trap both sides.
---
#CETUS #CETUSUSDT #CryptoAnalysis #BearTrap #LiquiditySweep #ReversalZone #SwingTrade #PriceAction #TechnicalAnalysis
Cetusprotocol

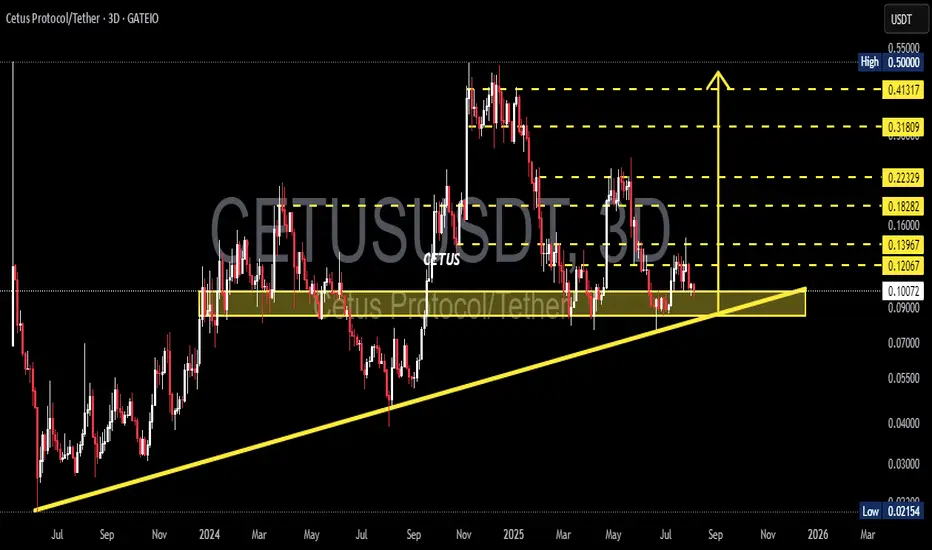
CETUS/USDT 3D — Awaiting a Major Decision at Key Support ZoneCetus Protocol (CETUS) is currently at a highly critical phase, trading just above a strong historical support zone that has repeatedly acted as a key price floor. The chart reveals a tight technical formation, signaling a potential for a significant move in the near term.
---
🔍 Technical Analysis:
Key Support Zone: $0.09000 – $0.10084
Price is currently testing a major demand area that has historically prevented deeper drops since mid-2023.
Ascending Trendline:
A medium-term trendline from 2023 remains intact, supporting a continued higher low structure.
Decreasing Volume:
Shrinking volume suggests the market is in a state of accumulation or awaiting a strong breakout catalyst.
---
🧩 Price Structure & Patterns:
Horizontal Consolidation above support → indicates potential accumulation phase.
Ascending Triangle Support (flat support + rising trendline) → this pattern is often a bullish continuation when followed by a breakout to the upside.
---
🐂 Bullish Scenario:
If price successfully bounces from the support zone, a step-by-step upward movement becomes likely, with the following targets:
Price Level Role Notes
$0.12067 Initial Resistance Minor rejection zone
$0.13967 Flip Zone Needs breakout confirmation
$0.16000 Mid-Range Resistance Key level for further upside
$0.18282 – $0.22329 Major Bullish Target Break above this signals trend recovery
$0.31809 – $0.41317 Long-term Resistance Potential full retracement zone
A clean breakout above $0.22329 with strong volume could signal a resumption of the long-term bullish trend.
---
🐻 Bearish Scenario:
If the price breaks down below $0.09000 and closes beneath the ascending trendline:
The higher low structure will be invalidated.
Potential downside targets:
$0.07000 (minor support)
$0.05500 – $0.04000 (psychological zones)
$0.02154 (historical low)
This would indicate a shift toward distribution and a broader bearish trend.
---
🧠 Suggested Trading Strategy:
🔁 Reversal Traders: Look for bullish candlestick confirmation (e.g., hammer, engulfing) at support zone.
💥 Breakout Traders: Wait for breakout and retest above $0.13967 before entering.
🛡️ Risk Management: Tight stop-loss below $0.09000, targets aligned with resistance levels.
---
📝 Conclusion:
CETUS/USDT is at a make-or-break level, sitting right above structural support and trendline confluence. A strong bounce here could offer a great risk-reward long opportunity, while a breakdown opens the door to further downside.
Patience and confirmation will be key.
#CETUSUSDT #CETUSProtocol #CryptoBreakout #TrendlineSupport #AltcoinAnalysis #ChartPattern #BullishSetup #BearishScenario #CryptoTechnicalAnalysis
#CETUSUSDT #1D (ByBit) Descending wedge breakoutCetus Protocol regained 50MA support and looks good for bullish continuation, mid-term.
⚡️⚡️ #CETUS/USDT ⚡️⚡️
Exchanges: ByBit USDT, OKX Futures, KuCoin Futures
Signal Type: Regular (Long)
Leverage: Isolated (2.0X)
Amount: 5.7%
Current Price:
0.11343
Entry Zone:
0.11331 - 0.10729
Take-Profit Targets:
1) 0.13344
1) 0.15086
1) 0.16829
Stop Targets:
1) 0.09094
Published By: @Zblaba
$CETUS BYBIT:CETUSUSDT.P #CetusProtocol cetus.zone
Risk/Reward= 1:1.2 | 1:2.1 | 1:3.0
Expected Profit= +42.0% | +73.5% | +105.1%
Possible Loss= -35.1%
Estimated Gaintime= 1-2 months

I expect CETUS to continue rising to $0.15.Hello everyone!
Today, I want to continue with the idea about CETUS. The asset successfully reached the 0.382 Fibonacci level, bringing in a 58% profit. Now, we can expect a continuation of the upward movement towards the final target at the 0.618 Fibonacci level, resulting in a total profit of 109%.
I consider it advantageous to enter a position after breaking and holding above the 0.382 Fibonacci level, with subsequent profit-taking at $0.092 (+28%) and $0.115 (+60%).
This is not financial advice; everything you do is at your own risk!

Cetus Protocol has good investment potential.Cetus Protocol. A new project positioning itself as a DEX to provide liquidity for the SUI and APTOS blockchains.
It was listed on major exchanges in May of this year.
For me, the project is an investment opportunity.
As for trading, I suggest looking at the chart. Currently, a local uptrend support line and a strong resistance level around $0.045 or 0.236 on the Fibonacci scale have formed on the chart.
If this level is broken and sustained above it, I expect the continuation of the uptrend movement to the 0.382 Fibonacci level or $0.071, a significant increase of 58%.
Profit can be partially locked in around $0.0558.
This is not financial advice, and everything you do, you do at your own risk.
