#CFX/USDT — Symmetrical Triangle: Ready for a Rally or a Breakd#CFX
The price is moving within a descending channel on the hourly timeframe. It has reached the lower boundary and is heading towards a breakout, with a retest of the upper boundary expected.
The Relative Strength Index (RSI) is showing a downward trend, approaching the lower boundary, and an upward bounce is anticipated.
There is a key support zone in green at 0.0700. The price has bounced from this level several times and is expected to bounce again.
The indicator is showing a trend towards consolidation above the 100-period moving average, which we are approaching, supporting the upward move.
Entry Price: 0.0722
First Target: 0.0737
Second Target: 0.0758
Third Target: 0.0783
Stop Loss: Below the green support zone.
Remember this simple thing: Money management.
For any questions, please leave a comment.
Thank you.
CFXUSDT

#CFX/USDT — Symmetrical Triangle: Ready for a Rally or a Breakd#CFX
The price is moving in a descending channel on the 1-hour timeframe. It has reached the lower boundary and is heading towards breaking above it, with a retest of the upper boundary expected.
We have a downtrend on the RSI indicator, which has reached near the lower boundary, and an upward rebound is expected.
There is a key support zone in green at 0.0724. The price has bounced from this level multiple times and is expected to bounce again.
We have a trend towards consolidation above the 100-period moving average, as we are moving close to it, which supports the upward movement.
Entry price: 0.0730
First target: 0.0737
Second target: 0.0747
Third target: 0.0760
Don't forget a simple principle: money management.
Place your stop-loss order below the support zone in green.
For any questions, please leave a comment.
Thank you.

CFX/USDT At Major Support — Last Line Before a Deeper Drop?CFX/USDT on the Daily (1D) timeframe is still trading within a medium-term bearish trend, characterized by a clear sequence of lower highs and lower lows since the peak around the 0.27–0.28 area.
Price has now declined back into a historically strong demand zone at 0.072 – 0.063, which previously acted as an accumulation base before a strong bullish impulse.
This area represents a critical decision zone for the next major move.
---
Pattern & Technical Structure
1. Descending Trendline (Bearish Control)
A well-defined descending trendline connects the major swing highs since August.
Each touch of this trendline resulted in strong rejection, confirming persistent seller dominance.
2. Descending Channel / Bearish Continuation
Price structure forms a descending channel, reflecting gradual distribution.
Current price action is located near the lower boundary of the channel, close to key support.
3. Strong Horizontal Demand Zone
The yellow zone at 0.072 – 0.063 represents:
A strong historical reaction area
Previous rebound levels
A psychological deep discount zone
This zone has the potential to act as a base for reversal if buyers step in aggressively.
---
Key Levels
Support
Major Support (Key Demand): 0.072 – 0.063
Critical Breakdown Level: 0.059
Resistance
Minor Resistance: 0.085
Mid Resistance: 0.104
Major Resistance: 0.125
Upper Resistance / Distribution Zone: 0.165 – 0.185
Macro Resistance: 0.230
---
Bullish Scenario
Bullish conditions require:
Price holding above 0.072
Formation of a base / consolidation
Appearance of a bullish daily close (pin bar, engulfing, or strong bullish body)
Potential bullish move:
1. Rebound from the 0.072–0.063 demand zone
2. Break above minor resistance at 0.085
3. Upside targets:
0.104
0.125
Strong momentum continuation → 0.165 – 0.185
Bullish Conclusion:
This area offers a high-risk, high-reward accumulation opportunity for swing traders, as long as the key support remains intact.
---
Bearish Scenario
Bearish confirmation occurs if:
A strong daily close below 0.063
Breakdown accompanied by increasing volume
Failure to reclaim the 0.072 level
Potential bearish continuation:
Further downside toward:
0.059
Possible deeper liquidity zones if panic selling occurs
Note: A breakdown of this zone confirms that the bearish continuation phase remains active.
---
Conclusion
CFX/USDT is currently trading at a major decision zone.
Bounce from 0.072 – 0.063 → potential relief rally or trend reversal
Breakdown below this area → confirmation of bearish continuation
Market is at a critical turning point.
Strict risk management is essential in this region.
---
#CFX #CFXUSDT #CryptoAnalysis #Altcoin #DailyChart #DescendingTrend #SupportResistance #DemandZone #BearishTrend #PotentialReversal

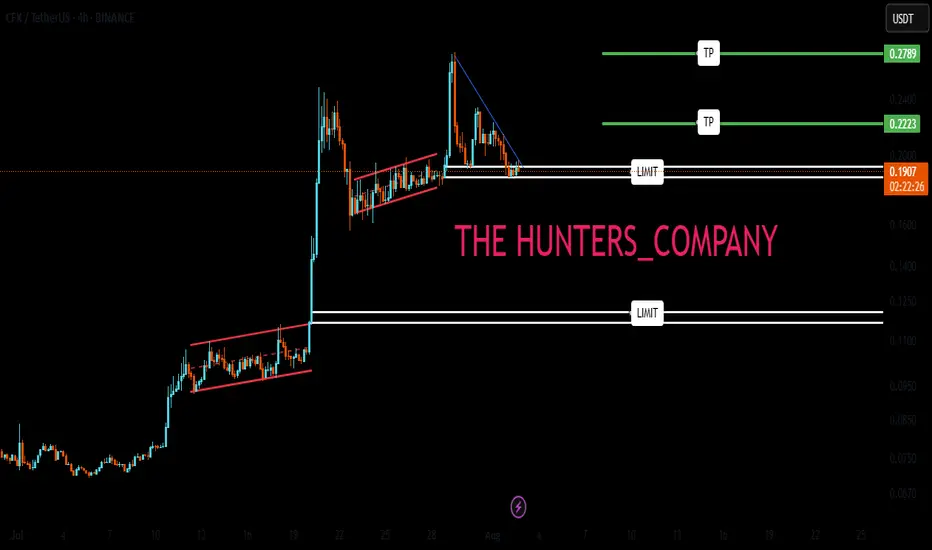
CFX Buy/Long Signal (4H)Considering that a large liquidity pool has been accumulated at the bottom of the chart, the price then formed a bullish CH, and all the order blocks above the chart have been consumed, taking a buy/long position on CFX seems relatively low-risk.
We have two entry points, and entries should be taken using DCA.
The targets have been marked on the chart, and reaching the third target is not even out of the question.
Do not enter the position without capital management and stop setting
Comment if you have any questions
thank you

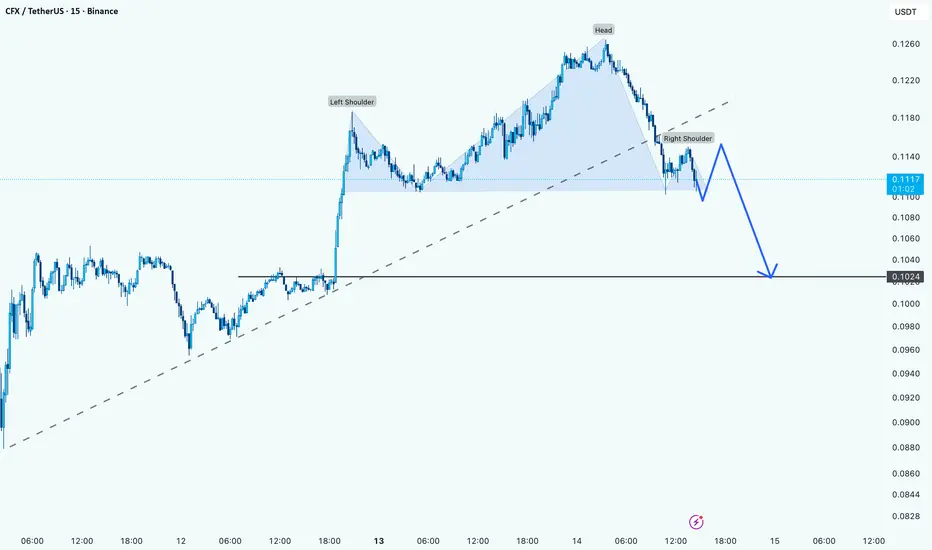
CFX Setting Up for a Head and Shoulders BreakdownHi guys!
just a quick analysis
CFX is printing a clean head and shoulders setup on the 15-minute chart. The neckline sits around the 0.1100 zone, which is acting as short-term support right now.
If the price breaks below that neckline with a solid candle close, it could confirm a bearish reversal. The plan would be to wait for a retest of the neckline as resistance and then look for a short entry.
Trade idea:
Entry: On a confirmed break and retest below 0.1100
Target: 0.1020 area (previous support)
Stop: Above the right shoulder, around 0.1140
If the neckline gives way, momentum could accelerate quickly to the downside. Just make sure to wait for confirmation!
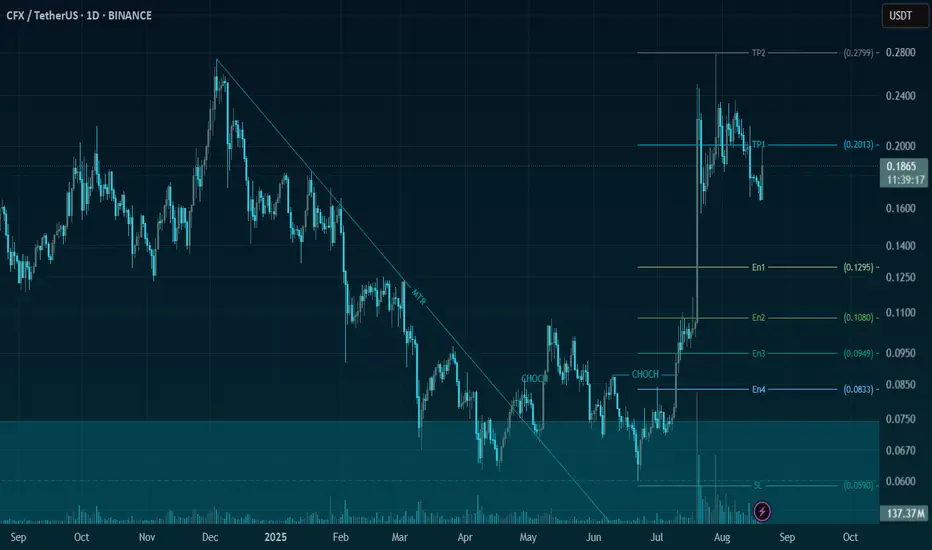
CFX/USDT - Bullish Breakout Imminent!🚀 Trade Setup Details:
🕯 #CFX/USDT 🔼 Buy | Long 🔼
⌛️ TimeFrame: 1D
--------------------
🛡 Risk Management (Example):
🛡 Based on $1000 Balance
🛡 Loss-Limit: 1% (Conservative)
🛡 The Signal Margin: $23.79
--------------------
☄️ En1: 0.1295 (Amount: $2.38)
☄️ En2: 0.1079 (Amount: $8.33)
☄️ En3: 0.0948 (Amount: $10.71)
☄️ En4: 0.0833 (Amount: $2.38)
--------------------
☄️ If All Entries Are Activated, Then:
☄️ Average.En: 0.1018 ($23.79)
--------------------
☑️ TP1: 0.2012 (+97.64%) (RR:2.32)
☑️ TP2: 0.2799 (+174.95%) (RR:4.16)
☑️ TP3: 0.4257 (+318.17%) (RR:7.57)
☑️ TP4: 0.7258 (+612.97%) (RR:14.58)
☑️ TP5: 1.3079 (+1184.77%) (RR:28.18)
☑️ TP6: Open 🔝
--------------------
❌ SL: 0.059 (-42.04%) (-$10)
--------------------
💯 Maximum.Lev: 1X
⌛️ Trading Type: Position Trading
‼️ Signal Risk: 🙂 Low-Risk! 🙂
🔎 Technical Analysis Breakdown:
This technical analysis is based on Price Action, Elliott waves, SMC (Smart Money Concepts), and ICT (Inner Circle Trader) concepts. All entry points, Target Points, and Stop Losses are calculated using professional mathematical formulas. As a result, you can have an optimal trade setup based on great risk management.
📊 Sentiment & Market Context:
The momentum for CFX/USDT is strongly bullish as the market shows renewed investor confidence driven by solid fundamentals and growing adoption. Conflux (CFX) is gaining traction with its high-performance blockchain infrastructure, aiming to solve scalability and interoperability issues — key drivers fueling positive market sentiment. This makes CFX a promising candidate for a sustained upward move in the mid to long term.
⚠️ Disclaimer:
Trading involves significant risk, and past performance does not guarantee future results. This analysis is for informational purposes only and should not be considered financial advice. Always conduct your research and trade responsibly.
💡 Stay Updated:
Like this technical analysis? Follow me for more in-depth insights, technical setups, and market updates. Let's trade smarter together!
#CFX/USDT chart review#CFX
The price is moving within a descending channel on the 1-hour frame, adhering well to it, and is heading for a strong breakout and retest.
We have a bearish trend on the RSI indicator that is about to be broken and retested, which supports the upward breakout.
There is a major support area in green at 0.1410, which represents a strong support point.
We are heading for consolidation above the 100 moving average.
Entry price: 0.1442
First target: 0.1500
Second target: 0.1545
Third target: 0.1604
Don't forget a simple matter: capital management.
When you reach the first target, save some money and then change your stop-loss order to an entry order.
For inquiries, please leave a comment.
Thank you.

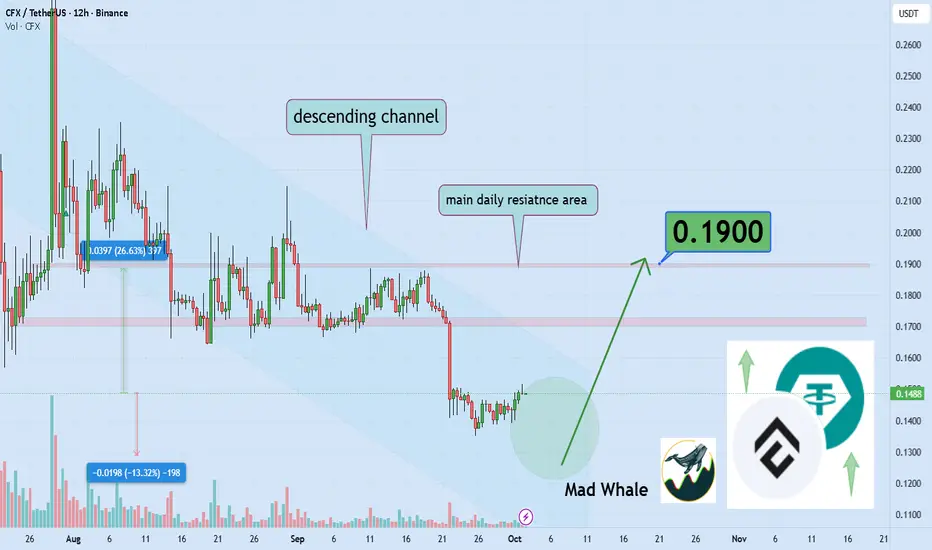
Conflux eyes 26% upside rebound, target set at 0.19$Hello✌️
Let’s analyze Conflux’s price action both technically and fundamentally 📈.
🔍Fundamental analysis:
If the new Conflux (CFX) proposal passes, companies must lock tokens for 4 years, removing about 11% of supply. This could boost CFX’s price outlook, but only 23% of proposals usually pass.
📊Technical analysis:
BINANCE:CFXUSDT is moving inside a daily descending channel; if this support area holds, the setup suggests a potential rebound of around 26% with a target near 0.19. 📊🚀
📈Using My Analysis to Open Your Position:
You can use my fundamental and technical insights along with the chart. The red and green arrows on the left help you set entry, take-profit, and stop-loss levels, serving as clear signals for your trades.⚡️ Also, please review the TradingView disclaimer carefully.🛡
✨We put love into every post!
Your support inspires us 💛 Drop a comment we’d love to hear from you! Thanks, Mad Whale
CFX Market Update📊 LSE:CFX Market Update
LSE:CFX is testing the red resistance zone 🔴
If it breaks out with confirmation, the first target will be the blue line level 🎯

Conflux approaching fair value gapCFX broke down and is hovering above the fair value gap, where the lack of volume could allow the price to fall right through. A breakdown through the imbalance will allow us to buy oversold conditions at a discount.

CFX - BEARISH CONTINUATION ? LSE:CFX - update:
For some reason, bearish pressure was pretty strong.
The current bias is clearly bearish, but price is stuck inside this yellow box.
Following my previous outlook another break downard to visit the lower 0.1350 - 0.1300$ support is likely to be see next! 📉
Are you bull or bear?? 👀

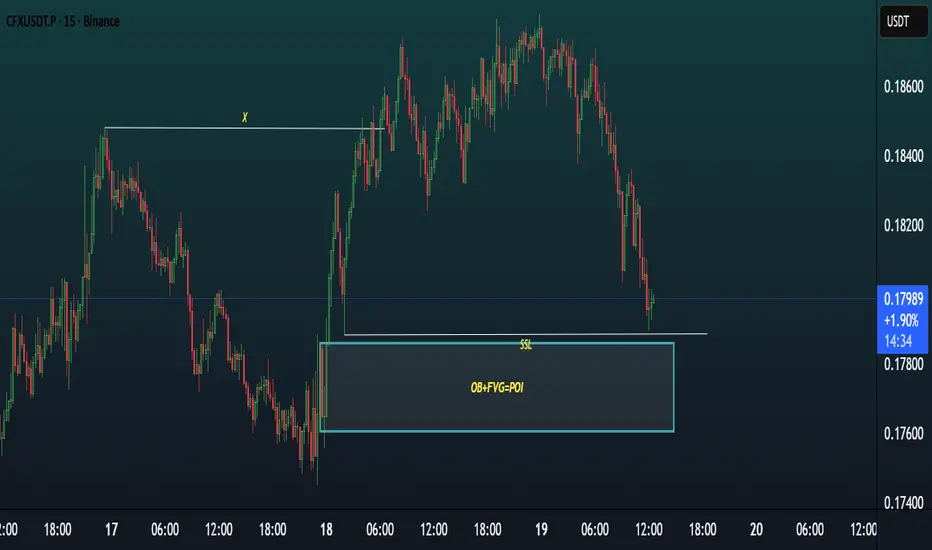
CFX/USDT Update (15m Chart)CFX/USDT Update (15m Chart)
Price is now approaching the OB + FVG confluence POI zone around 0.178 after taking out the SSL liquidity.
🔎 This is an important reaction area. If buyers step in here, we could see a potential reversal move forming.
⚡ Keep an eye on how price behaves once it taps the zone — bullish confirmation will be key before any continuation.
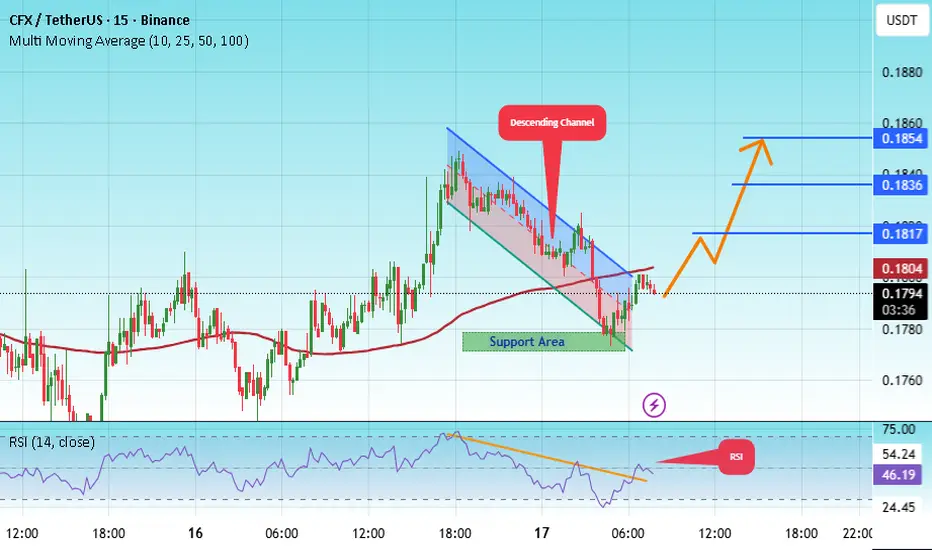
#CFX/USDT — Symmetrical Triangle: Ready for a Rally or a Breakd#CFX
The price is moving within a descending channel on the 1-hour frame, adhering well to it, and is heading for a strong breakout and retest.
We have a bearish trend on the RSI indicator that is about to be broken and retested, which supports the upward breakout.
There is a major support area in green at 0.1777, which represents a strong support point.
We are heading for consolidation above the 100 moving average.
Entry price: 0.1795
First target: 0.1817
Second target: 0.1836
Third target: 0.1854
Don't forget a simple matter: capital management.
When you reach the first target, save some money and then change your stop-loss order to an entry order.
For inquiries, please leave a comment.
Thank you.
CFXUSDT — Symmetrical Triangle: Ready for a Rally or a Breakdown📝 Full Analysis & Narrative
CFX/USDT is currently forming a symmetrical triangle pattern on the daily timeframe after experiencing a strong rally in July–August. This pattern is characterized by a series of lower highs (descending upper trendline) and higher lows (ascending lower trendline), gradually converging into an apex — a classic sign of consolidation with decreasing volatility.
Typically, a symmetrical triangle after a strong impulse tends to act as a continuation pattern, meaning that the price has a higher probability of resuming the prior trend (in this case, bullish). However, we must also acknowledge the possibility of a breakdown if market sentiment turns bearish.
---
🔼 Bullish Scenario
If the price manages to break above the upper trendline with a valid daily close supported by high volume, it will likely confirm a continuation of the bullish move.
Short-term targets:
$0.2000 → psychological and immediate resistance.
$0.2299 → horizontal resistance zone.
$0.2455 → key resistance before retesting previous highs.
Extended target (measured move):
Based on the triangle’s height (~$0.125), a confirmed breakout around $0.2000 projects a potential target near $0.3250, which would exceed the previous high at $0.2799.
Entry strategy:
Conservative: wait for breakout + retest of the upper trendline turned into support.
Aggressive: partial entry before the breakout near the apex (higher risk of fakeouts).
---
🔽 Bearish Scenario
If the price fails to hold and breaks below the lower trendline, bearish momentum could take control.
Short-term targets:
$0.1700 → immediate support.
$0.1550 → lower boundary of the triangle.
Extended target:
If selling pressure accelerates, price could drop toward $0.1000, or even revisit $0.0599 (the historical low shown on the chart).
Entry strategy:
Wait for a confirmed daily close below the lower trendline with strong volume.
Place stop-loss above the broken trendline or near the latest swing high.
---
🔍 Key Factors to Watch
1. Volume is critical → breakouts without volume often lead to fake moves.
2. Daily close confirmation matters more than intraday wicks.
3. Retests of broken trendlines often offer better risk/reward setups.
4. Risk management is essential: keep SL levels clear and limit position size (risk 1–2% per trade).
---
📊 Conclusion
CFX/USDT is approaching a decisive moment. The symmetrical triangle indicates that the market is in “waiting mode” before making its next major move. A breakout above could ignite a continuation rally toward $0.20 → $0.2455 and potentially $0.3250. On the other hand, a breakdown could open the door for a correction back to $0.155 or even $0.10.
Traders should wait for confirmation of direction and maintain strict risk management discipline.
---
#CFX #CFXUSDT #CryptoAnalysis #TrianglePattern #BreakoutOrBreakdown #CryptoTrading #Altcoins #ChartAnalysis #RiskManagement

$CFX: my green zones are back. Time to refill our bags.LSE:CFX delivered an impressive bounce during this mini-altseason, confirming it’s a project worth keeping on the radar for the upcoming full altseason.
However, its non-US listing status could limit its performance if BlackRock launches altcoin index ETFs — as it’s unlikely Conflux would be included, meaning it wouldn’t directly benefit from institutional inflows.
That said, LSE:CFX remains a strong, China-based blockchain project, and if the Chinese government takes significant steps toward crypto adoption, this coin has the potential to skyrocket.
--------------------------------
The altcoin market just saw a solid pump, following the massive CRYPTOCAP:BTC and CRYPTOCAP:ETH institutional billion-dollar purchases.
On the Daily timeframe, we’re actually printing higher lows, showing clear market strength. The top of the range was rejected, and now it’s highly probable that the crypto market will enter a consolidation phase — a move that could push several altcoins into my buying zones.
💡 Reminder: My buying zones are areas where it’s statistically safer to buy and hold, with an almost guaranteed chance of making a solid profit on the next bounce.
What could spark the infamous Altseason?
Many altcoins share one thing in common: a major resistance line (marked in yellow). For them to pump to the moon, this line needs to be broken.
We’re also seeing a price compression — meaning the breakout could be imminent. This pullback might be your last chance to enter a long position before the real Altseason kicks off.
Possible Altseason catalysts:
📉 FED Interest Rate Cut of 1% or more.
📈 Institutional adoption through altcoin index ETFs — imagine BlackRock launching ALT10, ALT50, ALT100 ETFs, attracting massive institutional money into the altcoin market.
I believe both events could happen before the end of the year.
DYOR — but the window might be closing fast. 🚀

Conflux Smart Trade- All in Graphic
- i really doubt it will back to bottom but " who knows ?".
- Now : Nothing to buy yet.
- i do not play a breakout with CFX. Dangerous.
---------------------------------------------------------------
Trading Part
---------------------------------------------------------------
Buy : 0.1$ ish ( 10% invest )
Buy : 0.055$ ish ( 20% invest )
Buy : 0.02$ ish ( 70% invest ) ( Bottom )
---------------------------------------------------------------
TP1 : 0.6$
TP2 : 1.6$ (ATH)
---------------------------------------------------------------
- Don't be greedy with my numbers.
- Set your own SL if you are a scalper.
- Set your own Take Profit.
- Be Logic & Make Money.
Happy Tr4Ding !

CFXUSDT TRADE IDEA.CFX/USDT Update (15m TF)
Market Structure: Price is currently bullish with a strong push upward after breaking structure (BOS).
Current Zone: Trading around 0.1759 after rejecting higher.
Point of Interest (POI): The highlighted demand zone near 0.1710 (OB + liquidity sweep).
Scenario:
Possible retracement into POI around 0.1710.
If demand holds, we can see continuation upward toward 0.1790–0.1800 levels.
Short-term liquidity grabs (zig-zag moves) are expected before push.
⚠️ Note: Watch for confirmation inside POI before entry. Without reaction, deeper drop is possible.

Conflux Grows 367% · Altcoins Market Bullish ConfirmedHere is another trading pair that is doing great. This type of market action confirms our highly controversial bullish bias.
Is the altcoins market really growing in late 2025? The market has been growing for months. CFXUSDT is a perfect example. Let's review the chart.
The price patterns are the same as with other trading pairs. Let's review a few of those. As we have the same price patterns, we will be able to conclude that we will also end up with the same results.
Price patterns
A peak in December 2024, the same with the rest of the altcoins market.
This peak is followed by a strong correction that ends in April 2025, sounds familiar?
After the bottom in April there is a price bounce. In the case of CFXUSDT, the peak in May led to a double-bottom in June. This is a shy lower low and this is the end.
The initial bullish breakout, wave 1, and then the resumption of the bullish trend. As soon as the low was confirmed with the double-bottom, CFXUSDT started to grow. Between 22-June and 29-July, 37 days, Conflux Token grew 367%. That's 4.6X.
This is not the whole bull market. The entire move was very short. Just a small advance, the start, and we have massive growth.
This move ended a while ago already and see how CFXUSDT is doing, prices remain really high. The retrace is very small. This is an extreme bullish signal and reveals the altcoins market will continue to grow.
If the bullish wave were over, then we would see a strong crash after the peak-high. Instead, prices remain strong because sellers are not present, buyers continue to buy and holders continue to hold.
Never give up...
Keep going...
We are only a few days away...
The best is yet to come.
Namaste.

CFX has formed a Bearish Head & Shoulders pattern📉 LSE:CFX Market Update
LSE:CFX has formed a Bearish Head & Shoulders pattern ❌
Price has now broken down the neckline and the blue support level 🔵, confirming sellers are in control.
👉 The potential play:
Further downside is likely if bearish momentum continues.
Best to wait for a clear reversal signal or accumulation before considering longs.
⚠️ Reminder: Head & Shoulders breakdowns usually lead to accelerated bearish continuation.

CFXUSDT Forming Bullish MomentumCFXUSDT has been consolidating within a well-defined range, building strong support at lower levels while repeatedly testing resistance zones. This accumulation phase indicates that buyers are gradually stepping in, preparing for a potential breakout. The chart structure highlights that once price breaks above the upper resistance, momentum could accelerate rapidly, opening the door for a significant bullish move.
The volume profile has been supportive, showing healthy activity during this consolidation period. This suggests that market participants are closely watching the pair, and any surge in buying pressure could fuel a breakout. A successful push above resistance could mark the beginning of a strong upward trend, aligning with bullish expectations.
With a projected gain of 90% to 100%+, CFXUSDT offers an attractive opportunity for traders looking to capitalize on breakout setups. The current price action reflects a balanced structure of accumulation, which often precedes sharp rallies. If confirmed, this breakout could lead to a sustained bullish trend, making CFXUSDT one of the standout performers in the coming sessions.
✅ Show your support by hitting the like button and
✅ Leaving a comment below! (What is You opinion about this Coin)
Your feedback and engagement keep me inspired to share more insightful market analysis with you!

CFX : don't be afraidHello friends🙌
If you take risks, you will win. If you don't, you will regret it.
✅Given the good price growth, now that the price is in a correction phase, there is a good opportunity to buy with risk and capital management, of course, at the specified support levels and move with them to the set targets.
🔥Follow us for more signals🔥
*Trade safely with us*
Conflux CFX price analysis Recently, #CFX price shot up very strongly, due to the publication of the news that:
#ConfluxNetwork, China's Tier 1 blockchain, announced the launch of #Conflux 3.0 in August and announced plans to help issue a stablecoin pegged to the offshore yuan as China explores the possibility of issuing yuan stablecoins.
The news already reads as “very vague, promising...” but let's remember that we are talking about China, where crypto has been gradually banned since 2013 and finally banned in 2021.
💰 Looking at the OKX:CFXUSDT chart, we see that the price cannot be fixed above $0.19, which means that you should be careful with longs.
📈 If the words from the news are confirmed by actions, then the #CFX price will definitely consolidate above $0.19 and then it will be safe to open a long position.
🐻 And if the desired cannot be realized, then a correction to the $0.085-0.105 zone may become a new reality.
_____________________
Did you like our analysis? Leave a comment, like, and follow to get more

CFX Bulls Eyeing 38% Surge Toward Explosive 0.29 TargetHello✌
Let’s analyze Conflux’s upcoming price potential 📈.
BINANCE:CFXUSDT has shown solid bullish momentum recently, supported by a series of positive fundamental catalysts 📈. Price is now approaching a daily support zone that also aligns with a key Fibonacci retracement level. If this level holds, I’m expecting a potential move of around 38% to the upside, with a mid-term target near 0.29 . Watching closely for price action confirmation around support before considering entry 🚀.
✨We put love into every post!
Your support inspires us 💛 Drop a comment we’d love to hear from you! Thanks , Mad Whale
