#CFX/USDT chart review#CFX
The price is moving within a descending channel on the 1-hour frame, adhering well to it, and is heading for a strong breakout and retest.
We have a bearish trend on the RSI indicator that is about to be broken and retested, which supports the upward breakout.
There is a major support area in green at 0.1410, which represents a strong support point.
We are heading for consolidation above the 100 moving average.
Entry price: 0.1442
First target: 0.1500
Second target: 0.1545
Third target: 0.1604
Don't forget a simple matter: capital management.
When you reach the first target, save some money and then change your stop-loss order to an entry order.
For inquiries, please leave a comment.
Thank you.
Cfxusdtlong

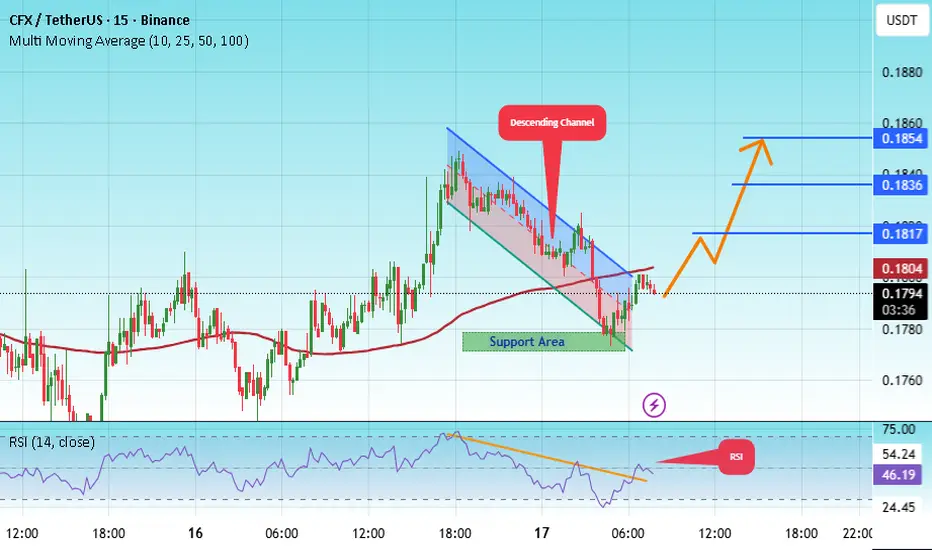
#CFX/USDT — Symmetrical Triangle: Ready for a Rally or a Breakd#CFX
The price is moving within a descending channel on the 1-hour frame, adhering well to it, and is heading for a strong breakout and retest.
We have a bearish trend on the RSI indicator that is about to be broken and retested, which supports the upward breakout.
There is a major support area in green at 0.1777, which represents a strong support point.
We are heading for consolidation above the 100 moving average.
Entry price: 0.1795
First target: 0.1817
Second target: 0.1836
Third target: 0.1854
Don't forget a simple matter: capital management.
When you reach the first target, save some money and then change your stop-loss order to an entry order.
For inquiries, please leave a comment.
Thank you.
CFXUSDT — Symmetrical Triangle: Ready for a Rally or a Breakdown📝 Full Analysis & Narrative
CFX/USDT is currently forming a symmetrical triangle pattern on the daily timeframe after experiencing a strong rally in July–August. This pattern is characterized by a series of lower highs (descending upper trendline) and higher lows (ascending lower trendline), gradually converging into an apex — a classic sign of consolidation with decreasing volatility.
Typically, a symmetrical triangle after a strong impulse tends to act as a continuation pattern, meaning that the price has a higher probability of resuming the prior trend (in this case, bullish). However, we must also acknowledge the possibility of a breakdown if market sentiment turns bearish.
---
🔼 Bullish Scenario
If the price manages to break above the upper trendline with a valid daily close supported by high volume, it will likely confirm a continuation of the bullish move.
Short-term targets:
$0.2000 → psychological and immediate resistance.
$0.2299 → horizontal resistance zone.
$0.2455 → key resistance before retesting previous highs.
Extended target (measured move):
Based on the triangle’s height (~$0.125), a confirmed breakout around $0.2000 projects a potential target near $0.3250, which would exceed the previous high at $0.2799.
Entry strategy:
Conservative: wait for breakout + retest of the upper trendline turned into support.
Aggressive: partial entry before the breakout near the apex (higher risk of fakeouts).
---
🔽 Bearish Scenario
If the price fails to hold and breaks below the lower trendline, bearish momentum could take control.
Short-term targets:
$0.1700 → immediate support.
$0.1550 → lower boundary of the triangle.
Extended target:
If selling pressure accelerates, price could drop toward $0.1000, or even revisit $0.0599 (the historical low shown on the chart).
Entry strategy:
Wait for a confirmed daily close below the lower trendline with strong volume.
Place stop-loss above the broken trendline or near the latest swing high.
---
🔍 Key Factors to Watch
1. Volume is critical → breakouts without volume often lead to fake moves.
2. Daily close confirmation matters more than intraday wicks.
3. Retests of broken trendlines often offer better risk/reward setups.
4. Risk management is essential: keep SL levels clear and limit position size (risk 1–2% per trade).
---
📊 Conclusion
CFX/USDT is approaching a decisive moment. The symmetrical triangle indicates that the market is in “waiting mode” before making its next major move. A breakout above could ignite a continuation rally toward $0.20 → $0.2455 and potentially $0.3250. On the other hand, a breakdown could open the door for a correction back to $0.155 or even $0.10.
Traders should wait for confirmation of direction and maintain strict risk management discipline.
---
#CFX #CFXUSDT #CryptoAnalysis #TrianglePattern #BreakoutOrBreakdown #CryptoTrading #Altcoins #ChartAnalysis #RiskManagement

CFXUSDT Forming Bullish MomentumCFXUSDT has been consolidating within a well-defined range, building strong support at lower levels while repeatedly testing resistance zones. This accumulation phase indicates that buyers are gradually stepping in, preparing for a potential breakout. The chart structure highlights that once price breaks above the upper resistance, momentum could accelerate rapidly, opening the door for a significant bullish move.
The volume profile has been supportive, showing healthy activity during this consolidation period. This suggests that market participants are closely watching the pair, and any surge in buying pressure could fuel a breakout. A successful push above resistance could mark the beginning of a strong upward trend, aligning with bullish expectations.
With a projected gain of 90% to 100%+, CFXUSDT offers an attractive opportunity for traders looking to capitalize on breakout setups. The current price action reflects a balanced structure of accumulation, which often precedes sharp rallies. If confirmed, this breakout could lead to a sustained bullish trend, making CFXUSDT one of the standout performers in the coming sessions.
✅ Show your support by hitting the like button and
✅ Leaving a comment below! (What is You opinion about this Coin)
Your feedback and engagement keep me inspired to share more insightful market analysis with you!

CFX : don't be afraidHello friends🙌
If you take risks, you will win. If you don't, you will regret it.
✅Given the good price growth, now that the price is in a correction phase, there is a good opportunity to buy with risk and capital management, of course, at the specified support levels and move with them to the set targets.
🔥Follow us for more signals🔥
*Trade safely with us*
CFX Bulls Eyeing 38% Surge Toward Explosive 0.29 TargetHello✌
Let’s analyze Conflux’s upcoming price potential 📈.
BINANCE:CFXUSDT has shown solid bullish momentum recently, supported by a series of positive fundamental catalysts 📈. Price is now approaching a daily support zone that also aligns with a key Fibonacci retracement level. If this level holds, I’m expecting a potential move of around 38% to the upside, with a mid-term target near 0.29 . Watching closely for price action confirmation around support before considering entry 🚀.
✨We put love into every post!
Your support inspires us 💛 Drop a comment we’d love to hear from you! Thanks , Mad Whale

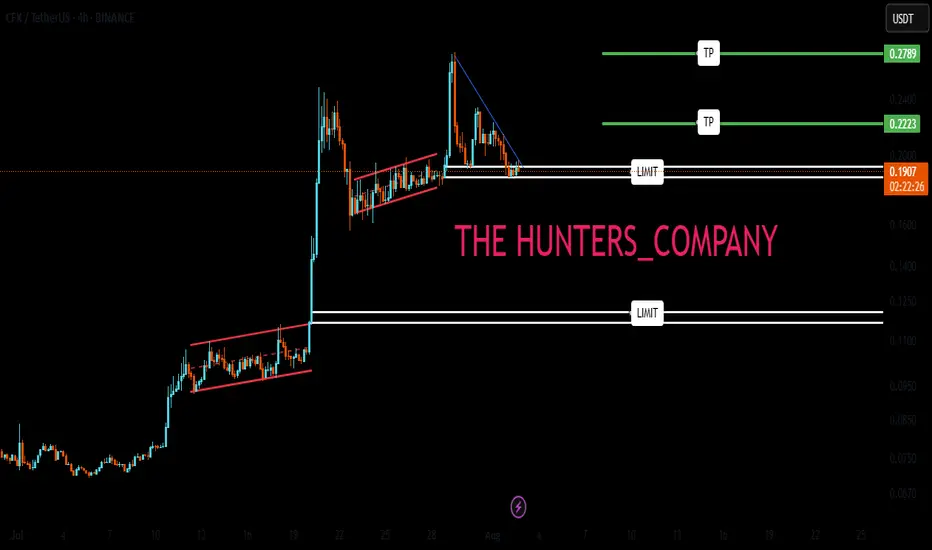
CFX/USDT: Two-Plan Strategy for the Next MoveHello guys.
CFX just broke out of a long-term downtrend line, showing strong bullish momentum. After this sharp impulse, we're now patiently watching for the pullback zone.
Here’s my plan:
✔ First plan: Looking for a reaction around the breakout retest zone (0.1500–0.1300). This is the ideal area for a bullish continuation if buyers step in early.
✔ Backup plan: If the price drops deeper, the second demand zone (around 0.1060–0.0950) is where we’d expect stronger buyer defense.
Potential upside target: 0.31+, where price previously showed strong selling pressure.
CFXUSDT | Sellers Still in ControlI’ve seen this pattern before. CFXUSDT is still under pressure from strong sellers , and nothing has shifted yet to flip the bias.
The red box remains a key resistance. Until that level is clearly broken and turns into support with a proper retest, there’s no reason to look bullish .
If you're patient and wait for structure to shift, you’ll avoid the traps most traders walk into.
“I will not insist on my short idea. If the levels suddenly break upwards and do not give a downward break in the low time frame, I will not evaluate it. If they break upwards with volume and give a retest, I will look long.”
This is how high win rates are built . Not by guessing, but by reacting to confirmation.
📌I keep my charts clean and simple because I believe clarity leads to better decisions.
📌My approach is built on years of experience and a solid track record. I don’t claim to know it all but I’m confident in my ability to spot high-probability setups.
📌If you would like to learn how to use the heatmap, cumulative volume delta and volume footprint techniques that I use below to determine very accurate demand regions, you can send me a private message. I help anyone who wants it completely free of charge.
🔑I have a long list of my proven technique below:
🎯 ZENUSDT.P: Patience & Profitability | %230 Reaction from the Sniper Entry
🐶 DOGEUSDT.P: Next Move
🎨 RENDERUSDT.P: Opportunity of the Month
💎 ETHUSDT.P: Where to Retrace
🟢 BNBUSDT.P: Potential Surge
📊 BTC Dominance: Reaction Zone
🌊 WAVESUSDT.P: Demand Zone Potential
🟣 UNIUSDT.P: Long-Term Trade
🔵 XRPUSDT.P: Entry Zones
🔗 LINKUSDT.P: Follow The River
📈 BTCUSDT.P: Two Key Demand Zones
🟩 POLUSDT: Bullish Momentum
🌟 PENDLEUSDT.P: Where Opportunity Meets Precision
🔥 BTCUSDT.P: Liquidation of Highly Leveraged Longs
🌊 SOLUSDT.P: SOL's Dip - Your Opportunity
🐸 1000PEPEUSDT.P: Prime Bounce Zone Unlocked
🚀 ETHUSDT.P: Set to Explode - Don't Miss This Game Changer
🤖 IQUSDT: Smart Plan
⚡️ PONDUSDT: A Trade Not Taken Is Better Than a Losing One
💼 STMXUSDT: 2 Buying Areas
🐢 TURBOUSDT: Buy Zones and Buyer Presence
🌍 ICPUSDT.P: Massive Upside Potential | Check the Trade Update For Seeing Results
🟠 IDEXUSDT: Spot Buy Area | %26 Profit if You Trade with MSB
📌 USUALUSDT: Buyers Are Active + %70 Profit in Total
🌟 FORTHUSDT: Sniper Entry +%26 Reaction
🐳 QKCUSDT: Sniper Entry +%57 Reaction
📊 BTC.D: Retest of Key Area Highly Likely
📊 XNOUSDT %80 Reaction with a Simple Blue Box!
📊 BELUSDT Amazing %120 Reaction!
📊 Simple Red Box, Extraordinary Results
I stopped adding to the list because it's kinda tiring to add 5-10 charts in every move but you can check my profile and see that it goes on..

CFXUSDT Forming Falling WedgeCFXUSDT is showing signs of a strong bullish continuation as it emerges from a falling wedge pattern — a setup often considered a reliable reversal signal in technical analysis. As depicted in the chart, the price has been compressing within the wedge, gradually forming higher lows and now attempting a breakout from the resistance trendline. The recent green candles and growing volume suggest bulls are taking control, setting the stage for an upside move. With momentum building, traders could be looking at a potential 40% to 50% surge if the breakout sustains.
Conflux (CFX) has been gaining attention due to its unique position as a high-throughput, scalable blockchain that facilitates cross-border data and value transfer, particularly between China and the global crypto community. As regulatory clarity improves and Conflux continues to expand its ecosystem through partnerships and integrations, market sentiment has shifted in favor of the project. This renewed investor confidence is visible in the technical structure forming on the CFXUSDT chart, as smart money begins to accumulate.
The breakout target aligns with a previous high, indicating that this could be more than just a short-term rally. If volume continues to support the price action, CFX could rally toward the $0.12–$0.13 zone, which marks a critical resistance area. This creates a favorable risk-reward environment for both swing traders and position holders eyeing medium-term gains. Technical traders should watch for confirmation above the wedge and continuation candles backed by volume to validate the move.
Overall, CFXUSDT looks primed for a strong upward movement, supported by bullish technicals and increasing investor interest in the Conflux network. As the project remains fundamentally strong and gains traction in the Web3 space, this may be an opportunity to capitalize on a promising mid-cap altcoin.
✅ Show your support by hitting the like button and
✅ Leaving a comment below! (What is You opinion about this Coin)
Your feedback and engagement keep me inspired to share more insightful market analysis with you!
CFX/USDT BREAKOUT ALERT
CFX/USDT BREAKOUT ALERT
CFX/USDT has already broken out of the bull flag pattern and is showing bullish momentum. Since a bull flag is typically a continuation pattern, this breakout suggests the potential for further upside.
However, if the price drops back into the flag structure, it could turn out to be a fakeout. Watch closely to see if the breakout holds or fails.
Key point:
Sustained price action above the breakout = bullish confirmation
Drop back inside the flag = potential fakeout
Stay alert and manage risk accordingly.
#CFX/USDT#CFX
The price is moving within a descending channel on the 1-hour frame and is expected to continue lower.
We have a trend to stabilize above the 100 moving average once again.
We have a downtrend on the RSI indicator that supports the decline with a break below.
We have a support area at the upper limit of the channel at 0.0815.
Entry price: 0.0815
First target: 0.0788
Second target: 0.0763
Third target: 0.0740

CFXUSDT 1DCFX ~ 1D Analysis
#CFX Buy gradually after successfully penetrating this resistant line with a short -term target of at least 10%+.

#CFX/USDT#CFX
The price is moving in a descending channel on the 1-hour frame and is expected to continue upwards
We have a trend to stabilize above the moving average 100 again
We have a descending trend on the RSI indicator that supports the rise by breaking it upwards
We have a support area at the lower limit of the channel at a price of 0.0950
Entry price 0.1000
First target 0.1033
Second target 0.1073
Third target 0.1123

#CFX/USDT #CFX
The price is moving in a descending channel on the 1-hour frame and is adhering to it well and is heading to break it strongly upwards
We have a bounce from the lower limit of the descending channel, this support is at a price of 0.1455
We have a downtrend on the RSI indicator that is about to be broken, which supports the rise
We have a trend to stabilize above the moving average 100
Entry price 0.1500
First target 0.1570
Second target 0.1660
Third target 0.1743

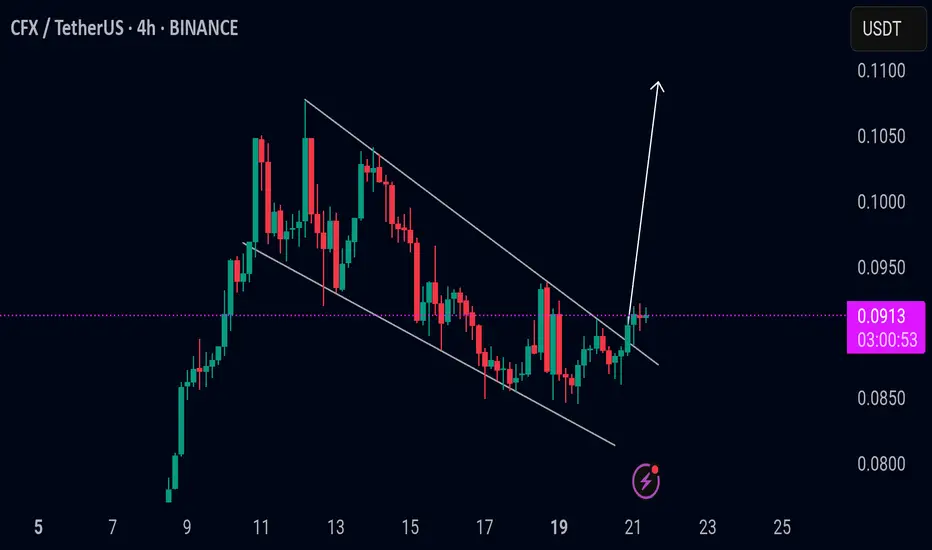
#CFX/USDT#CFX
The price is moving in a descending channel on the 4-hour frame and sticking to it well
We have a bounce from the lower limit of the descending channel, this support is at 0.1242
We have an upward trend, the RSI indicator is about to break, which supports the rise
We have a trend to stabilize above the moving average 100
Entry price 0.1485
First target 0.1621
Second target 0.1770
Third target 0.1955

CFXUSDT 1WCFX ~ 1W
#CFX If you still have Conviction on this coin,. Buy gradually within this support block, with a minimum target of 20%+

CFXUSDT: Is the Next Big Pump Brewing in the Blue Box?CFXUSDT Analysis Promising Setup with Volume Increase
CFXUSDT is showing strength with a notable volume spike. This could be a solid opportunity if the price reaches the blue box.
Highlights:
Volume Increase: Strong market activity supports the bullish potential.
Blue Box Entry: I plan to enter near the blue box with a stop below the most recent low.
For Risk-Reward Seekers: Those looking for higher risk-to-reward setups can wait for upward breaks in lower time frames within the blue box for confirmation.
Key Observations:
"The blue box is very carefully picked using volume footprint, volume profile, cumulative delta volume, and liquidity heatmap. When trading this zone, I will look for buyers and upward market structure breaks in lower time frames for confirmation."
This setup has potential, but as always, wait for confirmation before acting. 🚀
Let me tell you, this is something special. These insights, these setups—they’re not just good; they’re game-changers. I've spent years refining my approach, and the results speak for themselves. People are always asking, "How do you spot these opportunities?" It’s simple: experience, clarity, and a focus on high-probability moves.
Want to know how I use heatmaps, cumulative volume delta, and volume footprint techniques to find demand zones with precision? I’m happy to share—just send me a message. No cost, no catch. I believe in helping people make smarter decisions.
Here are some of my recent analyses. Each one highlights key opportunities:
🚀 RENDERUSDT: Strategic Support Zones at the Blue Boxes +%45 Reaction
🎯 PUNDIXUSDT: Huge Opportunity | 250% Volume Spike - %60 Reaction Sniper Entry
🌐 CryptoMarkets TOTAL2: Support Zone
🚀 GMTUSDT: %35 FAST REJECTION FROM THE RED BOX
🎯 ZENUSDT.P: Patience & Profitability | %230 Reaction from the Sniper Entry
🎯 DEXEUSDT %180 Reaction with %9 Stop
🐶 DOGEUSDT.P: Next Move
🎨 RENDERUSDT.P: Opportunity of the Month
💎 ETHUSDT.P: Where to Retrace
🟢 BNBUSDT.P: Potential Surge
📊 BTC Dominance: Reaction Zone
🌊 WAVESUSDT.P: Demand Zone Potential
🟣 UNIUSDT.P: Long-Term Trade
🔵 XRPUSDT.P: Entry Zones
🔗 LINKUSDT.P: Follow The River
📈 BTCUSDT.P: Two Key Demand Zones
🟩 POLUSDT: Bullish Momentum
🌟 PENDLEUSDT.P: Where Opportunity Meets Precision
🔥 BTCUSDT.P: Liquidation of Highly Leveraged Longs
🌊 SOLUSDT.P: SOL's Dip - Your Opportunity
🐸 1000PEPEUSDT.P: Prime Bounce Zone Unlocked
🚀 ETHUSDT.P: Set to Explode - Don't Miss This Game Changer
🤖 IQUSDT: Smart Plan
⚡️ PONDUSDT: A Trade Not Taken Is Better Than a Losing One
💼 STMXUSDT: 2 Buying Areas
🐢 TURBOUSDT: Buy Zones and Buyer Presence
🌍 ICPUSDT.P: Massive Upside Potential | Check the Trade Update For Seeing Results
🟠 IDEXUSDT: Spot Buy Area | %26 Profit if You Trade with MSB
📌 USUALUSDT: Buyers Are Active + %70 Profit in Total
🌟 FORTHUSDT: Sniper Entry +%26 Reaction
🐳 QKCUSDT: Sniper Entry +%57 Reaction
📊 BTC.D: Retest of Key Area Highly Likely
This list? It’s just a small piece of what I’ve been working on. There’s so much more. Go check my profile, see the results for yourself. My goal is simple: provide value and help you win. If you’ve got questions, I’ve got answers. Let’s get to work!

CFXUSDT Breaks Double-Bottom ResistanceCFXUSDT Technical analysis update
CFX/USDT price found strong support at $0.10 and bounced 110% from this level, forming a potential double-bottom pattern. The price is now breaking the neckline resistance on the daily chart while trading above the 100 and 200 EMA. This setup indicates a possible 100-200% bullish move from the current levels.

CFXUSDT 1WCFX ~ 1W
#CFX Back retesting this support Block,. If you still have Conviction on this coin,. This support block would be an excellent buy spot. Buy gradually with minimal targets 20%++

CFXUSDTCFX ~ 1W ✅
#CFX It looks like the selling pressure has stopped at this support block. Make purchases in stages with at least a short term target of at least 20%+

#CFX/USDT#CFX
The price is moving in a descending channel on the 4-hour frame and is sticking to it very well and is expected to break it upwards
We have a bounce from a major support area in green at 0.1260
We have a downtrend on the RSI indicator that was broken upwards which supports the rise
We have a trend to stabilize above the 100 moving average which supports the rise
Entry price 0.1340
First target 0.1420
Second target 0.1500
Third target 0.1580

CFX explanationCFX update! I am holding it.
We took a CFX trade back then; it gave 50-55% profit on spot with its first target being hit. Then we bought CFX at $0.28 for mid-term on spot without a stop-loss. I expect it to run along with APT when APT will pump. Holding it tight.
It will have its day.

#CFX/USDT#CFX
The price is moving within a bearish channel on a 1-day frame and is strongly committed to it.
We have a support area at 0.1935 and we bounced from it at the lower border of the channel
We have a tendency to stabilize above the Moving Average 100
We have a downtrend on the RSI indicator that supports the rise
Entry price is 0.2100
The first target is 0.2677
The second target is 0.3079
The third goal is 0.3537
